R E G U L A R A R T I C L E
Posttraumatic stress disorders in the Nanai after pollution
of the Amur River: ethnocultural analysis
Natalia Korshunova•Hironobu Katsuyama•Masashi Demura •Hideji Tanii• Midori Katsuyama•Sri Ratna Rahayu•Nikolay Anatoljevich Bogdanov• Lyudmila Vasilyevna Solokhina•Kiyofumi Saijoh
Received: 10 May 2013 / Accepted: 30 May 2013 / Published online: 19 June 2013
ÓThe Japanese Society for Hygiene 2013
Abstract
Objectives Chemical pollution of the Amur River has seriously damaged traditions and caused posttraumatic stress disorder (PTSD) among the Nanai, the indigenous people living along this river. This study was performed to clarify the ethnographic characteristics of PTSD in this unique population.
Methods The study group consisted of 75 male and 112 female randomly selected volunteers. PTSD severity measured using scores of the Impact of Event Scale – Revised (Total-I) and Clinical-Administered PTSD Scale (Total-C) was estimated according to demographic and ethnocultural backgrounds, clinical status, and ethnopsy-chological attitudes toward the Amur River.
Results The differences in averages of I and Total-C were not always the same in the groups divided by ethnographic information. Logistic regression analysis with a dependent variable, possibly without PTSD (Total-I\34 and Total-C\40)/possibly with PTSD (either Total-IC34
or Total-C C40), and categorical independent variables using ethnographic information extracted a low score when ‘priority values’ and ‘the Amur River for me is’ was ‘‘profession’’ and a high score when ‘dominant role in spousal relationship’ was ‘‘self,’’ when ‘predominant forms of response in stressful situations’ was ‘‘try to organize,’’ when ‘preferred method of medical treatment’ was specific for the Nanai, when ‘‘rely on something mystical’’ was manifested, and when the Amur River was believed to be ‘‘sacred’’.
Conclusion Those with a pragmatic attitude were less likely to have PTSD. However, those who were required to make decisions within close relationships and were inti-mate with the Nanai tradition and the Amur River had increased likelihood of PTSD.
Keywords Indigenous people Nanai Posttraumatic stress disorders (PTSD)Impact of Event Scale – Revision (IES-R) Clinical-administered PTSD Scale (CAPS) Ethnocultural analysis
Introduction
The Nanai is a small population of indigenous people in the Russian Far East, living along the middle reaches of the Amur River Valley. Their culture and language include Tungusic (Ewenki), aboriginal Nivkh, and Chinese–Man-chu elements. They have their own independent culture and live by fishing in the Amur River and hunting in the local forest. In December 2005, an accident at a chemical factory caused the release of toxic substances into the Songhua River (Jilin, China), which polluted the Amur River in Russian territory [1]. This serious pollution of river water with benzene and nitrobenzene [2] resulted in the N. KorshunovaM. DemuraH. TaniiM. Katsuyama
S. R. RahayuK. Saijoh (&)
Department of Hygiene, Kanazawa University School of Medicine, Kanazawa 920-8640, Japan
e-mail: saijohk@med.kanazawa-u.ac.jp
H. Katsuyama
Department of Public Health, Kawasaki Medical University, Kurashiki, Japan
N. A. Bogdanov
Department of Psychiatry and Medical Psychology, Far Eastern State Medical University, Khabarovsk, Russia
L. V. Solokhina
Department of Public Health and Healthcare System Organization, Far Eastern State Medical University, Khabarovsk, Russia
prohibition of fishing. Forest fires have significantly reduced the forest area, which has already led to a change in climate and the hydrological regime of the Amur River, and a dramatic reduction in the number of game animals, thus disrupting the way in which the Nanai obtain their staple food, as well as their traditional activities.
This population has always regarded the Amur River as part of their ethos, symbolic culture, and inner world [3]. They have a shamanistic religion with great reverence for the bear and fire. Fire is personified as an elderly woman. Young children are prohibited to run up to the fire in order not to startle her, and men always show respect in the presence of a fire. The Nanai consider that everything in the universe possesses its own spirit that wanders inde-pendently throughout the world, whether it is good or evil. They worship the spirits of the sun, the moon, the moun-tains, the water, and the trees.
In addition, they believe that their ancestors originated from the Amur River, which is also the guide to the spirit world after death. These characteristic beliefs may lead to catastrophic results in this case. The disaster began suddenly. However, pollutants settled to the riverbed and froze into ice, and so their toxicities had prolonged stressful effects, leading to chronic trauma, disadaptation, and feelings of power-lessness regarding the situation among the Nanai.
More than two-thirds of the general population may experience a significant traumatic event at some point in their lives, and therefore traumatic experiences are rela-tively common [4]. Such environmental factors are potential sources of tense social situations and inducers of physical and mental pathologies. There have been a num-ber of studies of disaster victims and they displayed a variety of sample types, disaster types, disaster locations, outcomes and risk factors observed, and overall severity of impairment [5–11]. There have also been a number of reviews analyzing the potential range, magnitude, and duration of the effects of a disaster, as well as the experi-ential, demographic, and psychosocial factors that may influence the mental health of the stricken community [12– 15]. Among them, posttraumatic stress disorder (PTSD) is the most commonly studied and probably the most frequent and debilitating psychological disorder [4,13,15], because it is the only psychiatric disorder that has an etiological component, that is, exposure to a traumatic event. It has been documented that manmade/technological disasters may have different and more marked consequences than natural disasters [13–15]. In addition, more severe expo-sure, female gender, middle age, ethnic minority status, secondary stressors, prior psychiatric problems, and weak or deteriorating psychosocial resources have been reported to increase the likelihood of adverse outcomes [13–15]. Therefore, it is possible that the long-lasting pollution of the Amur River may have serious adverse effects on the
Nanai people. However, their own tradition and culture may exert either protective or risk factors. Ethnographic research with native communities is needed for the devel-opment of effective diagnostic measures and mental health interventions for clinical practice [16].
Therefore, we explored the relationship between seriousness of PTSD in the Nanai people and their ethno-graphic information, such as demoethno-graphic and ethnocul-tural backgrounds, clinical status, and ethnopsychological attitudes toward the Amur River, to clarify the specific characteristics of PTSD in this unique population ethnographically.
Subjects and methods
Subjects
The participants in this study were selected randomly and included 187 indigenous adult Nanai volunteers over 18 years old (the age at which an individual does not require a guardian, according to the laws of the Russian Federation) from the general civilian population in the eight villages of Nanai Regional District of Khabarovsk Territory located in the Far East of the Russian Federation. The field-type survey was performed by visiting the yards in residential areas of the participants during the daytime (usually between 09:00 and 18:00). The survey was carried out during winter and spring 2006 with the ecological catastrophe. Two medical doctors trained in the specifics of PTSD research conducted the interviews under the supervision of the senior interviewer. This study was conducted with all participants’ written informed consent regarding all procedures. The questionnaires were assigned identity (ID) numbers to protect the identities of the par-ticipants. The study design was approved by the Ethical Committee of Kanazawa University School of Medicine (Japan) and the Ethical Committee of Far Eastern State Medical University (Russian Federation).
PTSD examinations
All participants were asked to complete written question-naires designed according to the Russian language certified version [17] of the Impact of Event Scale – Revision (IES-R) [18] and to have an interview according to the Clinical-administered PTSD Scale (CAPS) [19, 20] for PTSD examination.
IES-R (Russian language certified version)
‘‘rarely,’’ ‘‘sometimes,’’ and ‘‘often,’’ respectively. These items were separated into three categories that can identify trends in prevalence of Intrusion/Reexperience (compul-sion to repeat: eight questions), Avoidance of traumatic events (seven), and Hyperarousal (physiological excitabil-ity: seven), which are included in the diagnostic criteria of PTSD in DSM-IV [21]. The total score (Total-I) range was 0–110, and several cut-off values were reported to detect symptoms indicating a risk and/or vulnerability of PTSD. A score of C20 was used to estimate the prevalence of PTSD symptoms, with higher Total-I indicating more symptoms [6, 7]. The high-risk PTSD group was also defined as those scoring C25, based on the screening results [22, 23]. Individuals with scores C34 have been proposed to be probable PTSD cases [24]. However, Total-I can reach near 60 after torture [25].
CAPS (Russian language certified version)
Participants were presented with 17 questions to explore Intrusion (four items), Avoidance (seven), and Hyper-arousal (six) that could be answered by the scheme scores for frequency and intensity. The response was scored on a five-point Likert-type scale; (i) frequency: 0=none, 1=rarely (0–25 % of the period), 2 =sometimes (26–50 %), 3=often (51–75 %), and 4=always ([75 %); (ii) intensity: 0=no such feelings, 1=weak intensity of symptoms, 2=moderate intensity, 3=high intensity, and 4=very high intensity. Estimation of total severity scores was performed by summing the frequency and intensity ratings with Total-C ranging from 0 to 136. Total-C was classified as follows: subclinical=0–19, mild=20–39, moderate=40–59, severe=60–79, and extremely severe C80 [26].
Self-administered questionnaire
We used a self-administered questionnaire to determine participants’ demographic, ethnocultural, clinical, and ethnopsychological information. The demographic section included questions regarding gender, age, education level, profession, marital status, and housing condition.
The ethnocultural section was designed to obtain information regarding native language, relation to own and other nationalities, relation to religion, confession, forms of religious rituals (for believers), dominant role in spousal relationship, domestic atmosphere, age hierarchy, priority values (multiple-responses), observance of national cere-monies (festivals, marriage, birth, funerals), belief in national myths and omens, preferred method of medical treatment (multiple responses), and attitudes toward mental illness and suicide. The data from questions related to religion seemed not to be useful. For example, 120
participants answered that they were ‘‘nonbelievers,’’ but 153 answered that they had ‘‘religious rituals.’’ This con-tradiction was probably because it was prohibited to have religious beliefs during the Soviet Union period. These categories were omitted from the analysis.
The third section was related to clinical examination and included questions about psychopathological family his-tory, psychopathological episodes, predominant forms of response in stressful situations, anxiety, sphere of psy-chotraumatic situation, manifestation of work disadaptation (multiple-responses), manifestation of social disadaptation (multiple-responses), and level of physical health (multi-ple-responses).
The fourth section dealt with ethnopsychological ques-tions related to the Amur River and included information about inhabiting fish, water pollution, sentiment toward the Amur River (multiple responses), and plans for the future. Analysis and statistics
The participants were divided into two or more groups based on to the responses in the self-administered ques-tionnaire. The differences in averages of I and Total-C between and among groups were examined using Stu-dent’sttest and one-way ANOVA with Tukey’s HSD as a post hoc test, respectively. Thus, the present study had a cross-sectional design within the Nanai people.
Thereafter, we performed logistic regression analysis with low score/high score as the dependent valuable, where a low score was the group possibly without PTSD with low Total-l and Total-C, and a high score was the group pos-sibly with PTSD with a high score of either Total-I or Total-C. The above-mentioned groups classified by the responses to the self-administered questionnaire were used as categorical independent variables. All analyses were performed with JMP 9.0.2 (SAS Institute Inc., Cary, NY). In all analyses, P\0.05 was taken to indicate statistical significance.
Results
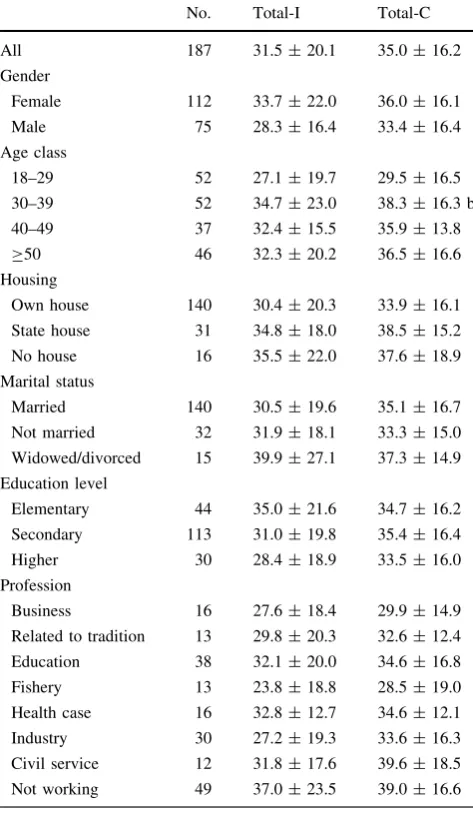
The averages of Total-I and Total-C for all subjects were 31.5±20.1 (range; 0–96) and 35.0±16.2 (0–82), respectively (Table1). Although Total-I and Total-C were significantly correlated, they were not identical. Around 42 % (79 of 187) and 36 % (67) had Total-I scoreC34 and Total-C score C40, respectively (Fig.1).
showed significant differences in the scores. The numbers of ‘‘related to tradition’’ and ‘‘fishery’’ in ‘profession’ were less than expected, both being 13.
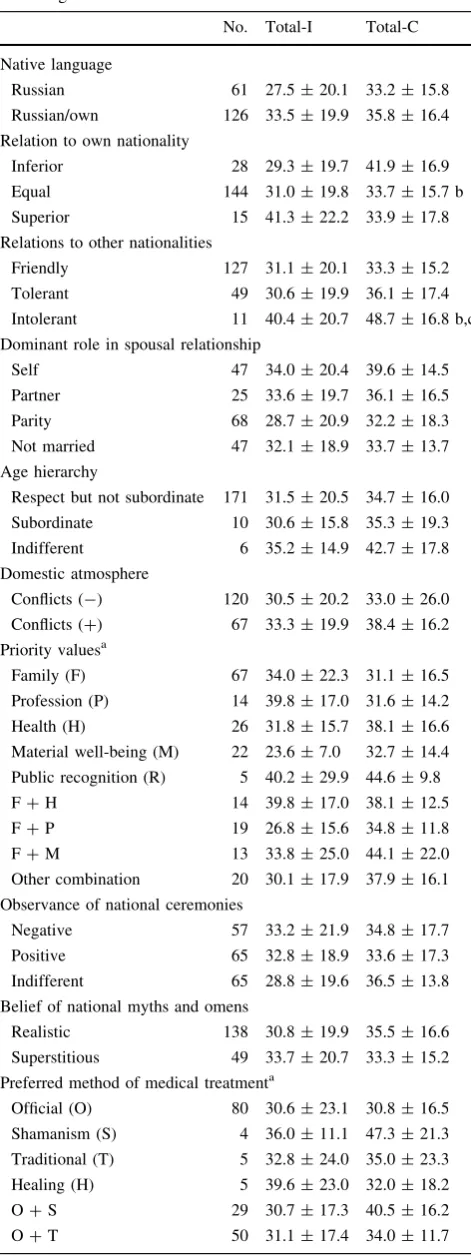
In a comparison between/among groups divided according to ethnocultural information, ‘‘inferior’’ in ‘relation to own nationality’ resulted in a significantly higher Total-C than ‘‘equal’’ (Table2). ‘‘Intolerant’’ in ‘relation to other nationalities’ was associated with higher scores than those of ‘‘friendly’’ and ‘‘tolerant,’’ whereas only very high Total-C (48.7±16.8) showed a significant difference. Other groups, including those divided by mul-tiple-response questions, did not show significant differ-ences. Although comparison among groups divided by multiple-response questions was difficult, ‘‘shamanism’’
and ‘‘healing’’ in ‘preferred method of medical treatment’ was weakly associated with high Total-I or Total-C.
With regard to clinical status, the groups divided both by ‘psychopathological family history’ and ‘psychopatholog-ical episodes’ showed no significant differences in Total-I or Total-C (Table3). Among the groups divided by ‘pre-dominant forms of response in stressful situations,’ the scores of the ‘‘try to organize’’ group tended to be low but Total-C alone (25.9±16.3) was significantly lower than in the ‘‘expressive’’ and ‘‘self-aggressive’’ groups. Regardless of being significant or not, those who had ‘‘none’’ in ‘sphere of psychotraumatic situation’ tended to have low Total-I and Total-C. The group ‘‘always’’ having ‘anxiety’ showed significantly higher Total-C than the ‘‘absent’’ group. Among the groups divided by multiple-response questions, the groups ‘manifesting work disadaptation,’ such as ‘‘underperformance,’’ and ‘‘problems in the shift,’’ showed high Total-C. Their combination like underper-formance, mistake, and problems in the shift (U ?M ?S) resulted in higher Total-I (47.5±25.0) and Total-C (52.2±13.5). Similar tendencies were observed among the groups divided by ‘manifestation of social disadapta-tion’ and ‘physical health.’
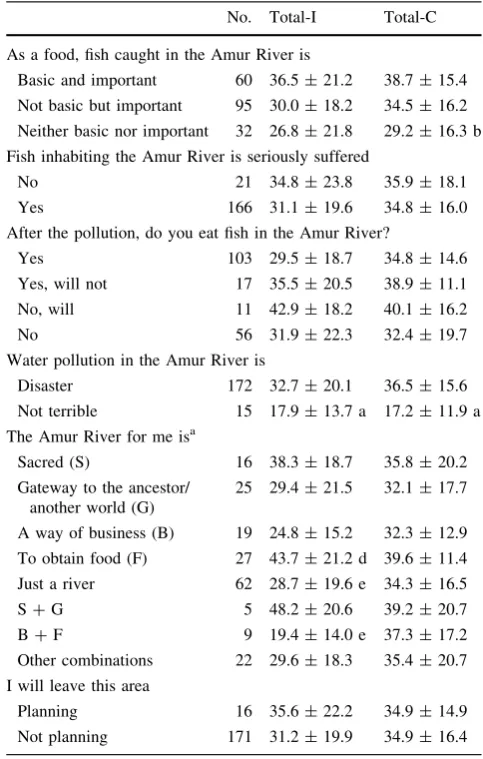
Among the groups divided by ethnopsychological questions, those who felt that ‘fish caught in the Amur River is’ ‘‘neither basic nor important’’ displayed low Total-I and Total-C compared to ‘‘basic and important,’’ although the difference was not always significant (Table4). The group responding that ‘water pollution in the Amur River is’ ‘‘not terrible’’ had significantly lower Total-I and Total-C than the ‘‘disaster’’ group. Effects of Table 1 Comparison of Total-I and Total-C between groups divided
according to demographic characteristics
No. Total-I Total-C
All 187 31.5±20.1 35.0±16.2
Gender
Female 112 33.7±22.0 36.0±16.1
Male 75 28.3±16.4 33.4±16.4
Age class
18–29 52 27.1±19.7 29.5±16.5
30–39 52 34.7±23.0 38.3±16.3 b
40–49 37 32.4±15.5 35.9±13.8
C50 46 32.3±20.2 36.5±16.6
Housing
Own house 140 30.4±20.3 33.9±16.1
State house 31 34.8±18.0 38.5±15.2
No house 16 35.5±22.0 37.6±18.9
Marital status
Married 140 30.5±19.6 35.1±16.7
Not married 32 31.9±18.1 33.3±15.0
Widowed/divorced 15 39.9±27.1 37.3±14.9
Education level
Elementary 44 35.0±21.6 34.7±16.2
Secondary 113 31.0±19.8 35.4±16.4
Higher 30 28.4±18.9 33.5±16.0
Profession
Business 16 27.6±18.4 29.9±14.9
Related to tradition 13 29.8±20.3 32.6±12.4
Education 38 32.1±20.0 34.6±16.8
Fishery 13 23.8±18.8 28.5±19.0
Health case 16 32.8±12.7 34.6±12.1
Industry 30 27.2±19.3 33.6±16.3
Civil service 12 31.8±17.6 39.6±18.5
Not working 49 37.0±23.5 39.0±16.6
Values represent mean±SD. Significant difference:bfrom the first group (P\0.05, one-way ANOVA with Tucky’s HSD as a post hoc test)
0 10 20 30 40 50 60 70 80 90
0 20 40 60 80 100
Total-I
Total-C
Fig. 1 Correlation of Total-I and Total-C. (R=0.45,P\0.0001).
Dotted lines indicate the cut-off value used in logistic regression
‘the Amur River for me is’ on Total-I than Total-C were more complex. For example, ‘‘to obtain food’’ had a sig-nificant higher Total-I (43.7±21.2) than ‘‘a way of business’’ (24.8±15.2), whereas a combination of ‘‘a way of business’’ and ‘‘to obtain food’’ (B?F) displayed lower Total-I (19.4±14.0) than ‘‘a way of business’’ alone. In addition to such difficulties in average comparison for multiple-response questions, average comparison between/ among groups was not always the same between Total-I and Total-C. Therefore, we applied logistic regression analysis.
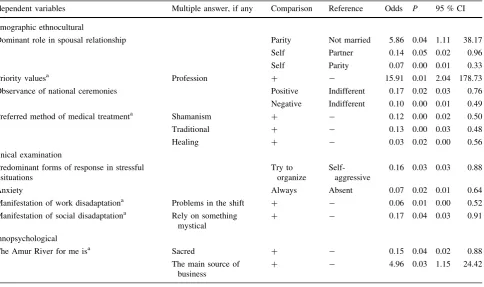
The participants were separated into two groups, that is, the group with Total-I \34 and Total-C \40 (n=77, approx. 40 %; low score), and the group with either Total-I C34 or Total-CC40 (n=110, approx. 60 %; high score). The dependent variable, that is, low score/high score, was analyzed in the above-mentioned groups (Tables1–4) as categorical independent variables. Odds values[1 and\1 represent the likelihood of being a low score and a high score, respectively. We omitted ‘marital status’ and ‘sphere of psychotraumatic situation’ because they showed high colinearity with ‘dominant role in spousal relationship’ and ‘priority values,’ respectively.
None of the determinants from demographic informa-tion was extracted, including ‘gender’ and ‘age class’ (Table5). From the ethnocultural information, ‘dominant role in spousal relationship’ was extracted. ‘‘Parity’’ com-pared to ‘‘not married’’ (odds: 5.86) showed a likelihood of being a low score, and ‘‘self’’ compared to ‘‘partner’’ (0.14) and ‘‘parity’’ (0.07) being a high score. The odds of ‘‘profession’’ in ‘priority values’ to be in a low score were as high as 15.91. Both ‘‘positive’’ and ‘‘negative’’ in ‘observance of national ceremonies’ led to a high score Table 2 Comparison of Total-I and Total-C between groups, divided
according to the ethnocultural information
No. Total-I Total-C
Native language
Russian 61 27.5±20.1 33.2±15.8
Russian/own 126 33.5±19.9 35.8±16.4
Relation to own nationality
Inferior 28 29.3±19.7 41.9±16.9
Equal 144 31.0±19.8 33.7±15.7 b
Superior 15 41.3±22.2 33.9±17.8
Relations to other nationalities
Friendly 127 31.1±20.1 33.3±15.2
Tolerant 49 30.6±19.9 36.1±17.4
Intolerant 11 40.4±20.7 48.7±16.8 b,c
Dominant role in spousal relationship
Self 47 34.0±20.4 39.6±14.5
Partner 25 33.6±19.7 36.1±16.5
Parity 68 28.7±20.9 32.2±18.3
Not married 47 32.1±18.9 33.7±13.7
Age hierarchy
Respect but not subordinate 171 31.5±20.5 34.7±16.0
Subordinate 10 30.6±15.8 35.3±19.3
Indifferent 6 35.2±14.9 42.7±17.8
Domestic atmosphere
Conflicts (-) 120 30.5±20.2 33.0±26.0
Conflicts (?) 67 33.3±19.9 38.4±16.2
Priority valuesa
Family (F) 67 34.0±22.3 31.1±16.5
Profession (P) 14 39.8±17.0 31.6±14.2
Health (H) 26 31.8±15.7 38.1±16.6
Material well-being (M) 22 23.6±7.0 32.7±14.4
Public recognition (R) 5 40.2±29.9 44.6±9.8
F?H 14 39.8±17.0 38.1±12.5
F?P 19 26.8±15.6 34.8±11.8
F?M 13 33.8±25.0 44.1±22.0
Other combination 20 30.1±17.9 37.9±16.1
Observance of national ceremonies
Negative 57 33.2±21.9 34.8±17.7
Positive 65 32.8±18.9 33.6±17.3
Indifferent 65 28.8±19.6 36.5±13.8
Belief of national myths and omens
Realistic 138 30.8±19.9 35.5±16.6
Superstitious 49 33.7±20.7 33.3±15.2
Preferred method of medical treatmenta
Official (O) 80 30.6±23.1 30.8±16.5
Shamanism (S) 4 36.0±11.1 47.3±21.3
Traditional (T) 5 32.8±24.0 35.0±23.3
Healing (H) 5 39.6±23.0 32.0±18.2
O?S 29 30.7±17.3 40.5±16.2
O?T 50 31.1±17.4 34.0±11.7
Table 2 continued
No. Total-I Total-C
Other combinations 14 35.4±18.4 48.0±14.4
Attitude to mental illness
Civilized 117 31.7±19.5 34.4±16.7
Mystical 12 34.9±17.9 30.2±15.1
Negative 15 28.1±22.5 35.9±15.6
Uncertain 43 31.4±21.9 37.4±15.5
Attitude to suicide
Without the possibility 152 30.5±18.8 33.5±15.7
Approve as a way out of intractableness
12 33.3±24.5 43.0±14.9
With the possibility 23 37.2±25.4 40.6±18.2
a Multiple-response questions
Values represent mean±SD. Significant difference, P\0.05,
compared to ‘‘indifferent’’ (odds: 0.17 and 0.10, respec-tively). In the multiple responses to ‘preferred method of medical treatment,’ the existence of ‘‘shamanism’’ (odds: 0.12), ‘‘traditional’’ (0.13), and ‘‘healing’’ (0.03) were associated with a high score.
Table 3 Comparison of Total-I and Total-C between groups, divided according to the clinical status
No. Total-I Total-C
Psychopathological family history
None 125 30.7±19.5 35.1±15.8
Yes 62 34.7±21.3 34.6±15.8
Psychopathological episodes
None 137 31.2±20.7 33.1±15.6
Organic type 24 34.8±19.8 39.0±16.8
Affective type 26 30.3±17.5 40.8±13.4
Predominant forms of response in stressful situations
Try to organize 33 24.8±16.0 25.9±16.3
Autistic 22 31.9±22.8 36.5±20.2
Expressive 60 31.8±21.7 35.9±14.0 b
Self-aggressive 72 34.3±19.2 37.8±15.5 b
Sphere of psychotraumatic situation
Family 72 36.8±20.7 38.4±14.2
Profession 43 26.8±18.0 36.4±14.3
Both 11 33.7±26.7 41.5±16.9
Ecology 38 31.7±19.7 33.9±16.5
None 23 22.6±14.9 b 19.9±17.1 b,c,d,e
Anxiety
Absent 26 27.5±19.0 26.9±20.3
Situational 123 31.1±18.7 34.7±13.7
Always 38 35.7±24.6 41.2±18.4 b
Manifestation of work disadaptationa
None 110 30.9±19.4 28.9±14.3
Underperformance (U) 13 29.0±26.1 43.7±16.7 b
Mistake (M) 18 23.4±14.9 39.3±16.0
Problems in the shift (S)
10 31.7±19.6 46.5±14.9 b
U?M?S 11 47.5±25.0 d 52.2±13.5 b
Other combinations 25 31.7±19.6 41.7±13.4 b
Manifestation of social disadaptationa
None 69 30.5±18.7 26.8±14.1
Loss of interest (L) 17 25.8±18.7 30.3±19.2
Conflict/aggression (C)
31 26.8±16.8 41.7±15.0 b
Rely on something mystical (M)
6 31.0±15.8 31.8±7.9
Antisocial behavior (A)
4 25.0±18.3 24.0±11.0
L?C 19 31.2±24.2 40.3±15.6 b
L?C?M 13 35.1±20.6 45.5±14.5 b
Other combinations 28 42.4±20.6 43.4±7.9 b
Physical healtha
Healthy (H) 75 27.5±16.1 29.2±13.8
Subclinical (S) 62 34.4±21.5 37.5±15.7 b
Disorder (D) 12 33.2±30.8 39.2±17.9
H?newly occurred (N)?aggravation (A)
8 32.9±25.5 32.3±27.3
S?N 16 37.4±20.8 46.0±12.7 b
Table 4 Comparison of Total-I and Total-C between groups divided according to the ethnopsychological questions
No. Total-I Total-C
As a food, fish caught in the Amur River is
Basic and important 60 36.5±21.2 38.7±15.4
Not basic but important 95 30.0±18.2 34.5±16.2
Neither basic nor important 32 26.8±21.8 29.2±16.3 b
Fish inhabiting the Amur River is seriously suffered
No 21 34.8±23.8 35.9±18.1
Yes 166 31.1±19.6 34.8±16.0
After the pollution, do you eat fish in the Amur River?
Yes 103 29.5±18.7 34.8±14.6
Yes, will not 17 35.5±20.5 38.9±11.1
No, will 11 42.9±18.2 40.1±16.2
No 56 31.9±22.3 32.4±19.7
Water pollution in the Amur River is
Disaster 172 32.7±20.1 36.5±15.6
Not terrible 15 17.9±13.7 a 17.2±11.9 a
The Amur River for me isa
Sacred (S) 16 38.3±18.7 35.8±20.2
Gateway to the ancestor/ another world (G)
25 29.4±21.5 32.1±17.7
A way of business (B) 19 24.8±15.2 32.3±12.9
To obtain food (F) 27 43.7±21.2 d 39.6±11.4
Just a river 62 28.7±19.6 e 34.3±16.5
S?G 5 48.2±20.6 39.2±20.7
B?F 9 19.4±14.0 e 37.3±17.2
Other combinations 22 29.6±18.3 35.4±20.7
I will leave this area
Planning 16 35.6±22.2 34.9±14.9
Not planning 171 31.2±19.9 34.9±16.4
a Multiple-response question
Values represent mean±SD. Significant difference: a between groups (P\0.05, Students’ttest),bfrom the first,dfrom the third,
efrom the fourth groups, respectively (P\0.05, one-way ANOVA with Tucky’s HSD as a post hoc test)
Table 3 continued
No. Total-I Total-C
Other combinations 14 31.7±17.5 38.6±15.2
a Multiple-response questions
The values represent the mean±SD. Significant difference:bfrom the first group, c from the second group, d from the third group,
In clinical status, ‘‘try to organize’’ versus ‘‘self-aggressive’’ in ‘predominant form of response in stressful situation’ (odds: 0.16), ‘‘always’’ versus ‘‘absent’’ in ‘anxiety’ (0.07), the existence of ‘‘problems in the shift’’ in ‘manifestation of work disadaptation’ (0.06), and the existence of ‘‘rely on something mystical’’ in ‘manifesta-tion of social disadapta‘manifesta-tion’ (0.17) were associated with a high score. From the ethnopsychological information, ‘the Amur River for me is’ was extracted. Existence of ‘‘sacred’’ and ‘‘the main source of business’’ showed a likelihood of being a high score (odds: 0.15) and a low score (4.96), respectively.
Discussion
Both IES/IES-R and CAPS have been used in various epidemiological studies to assess the prevalence of PTSD and to estimate the frequency and intensity of individual symptoms/disorders and their impact on social activities of patients [27–29]. Total-I and Total-C of the Nanai people showed significantly strong correlations but were not
identical, which was in good accordance with a previous report [28]. However, both seemed to be high compared with previous reports [22–24, 26]. The ethnic minority status of the Nanai may increase the likelihood of adverse outcomes [13–15]. In the present cross-sectional study, inter-ethnic comparison was unavailable. Thus, to specify the characteristics of PTSD within the Nanai people, the averages of Total-I and Total-C were compared between/ among the groups divided by information obtained from a self-administered questionnaire survey.
In average comparison, groups divided by demographic information showed no differences. Regarding ‘profes-sion’, those who engaged in modern works seemed to be more than expected. In addition to the prohibition of fish-ing and huntfish-ing, the development and introduction of modern economical lifestyles may affect the choice of ‘profession’. In fact, there are new cities and industrial sites in the vicinity of Nanai settlements and railroads now run through the region. However, businesses and industries themselves were oriented mainly on fishing, thus their development was very low [3]. The main employment was in the social sphere, like education, civil service, and health Table 5 Logistic regression analysis exploring possibly without PTSD versus possibly with PTSD
Independent variables Multiple answer, if any Comparison Reference Odds P 95 % CI
Demographic ethnocultural
Dominant role in spousal relationship Parity Not married 5.86 0.04 1.11 38.17
Self Partner 0.14 0.05 0.02 0.96
Self Parity 0.07 0.00 0.01 0.33
Priority valuesa Profession ? - 15.91 0.01 2.04 178.73
Observance of national ceremonies Positive Indifferent 0.17 0.02 0.03 0.76
Negative Indifferent 0.10 0.00 0.01 0.49
Preferred method of medical treatmenta Shamanism ? - 0.12 0.00 0.02 0.50
Traditional ? - 0.13 0.00 0.03 0.48
Healing ? - 0.03 0.02 0.00 0.56
Clinical examination
Predominant forms of response in stressful situations
Try to organize
Self-aggressive
0.16 0.03 0.03 0.88
Anxiety Always Absent 0.07 0.02 0.01 0.64
Manifestation of work disadaptationa Problems in the shift ? - 0.06 0.01 0.00 0.52
Manifestation of social disadaptationa Rely on something mystical
? - 0.17 0.04 0.03 0.91
Ethnopsychological
The Amur River for me isa Sacred ? - 0.15 0.04 0.02 0.88
The main source of business
? - 4.96 0.03 1.15 24.42
a Multiple-response questions
care. Moreover, only around 5% of the Nanais live in towns and cities and their life is still limited in the Nanai settlement. Thus, it seems also natural that groups divided by ‘profession’ displayed no significant differences, whe-ther they are traditional or modern.
Some of the groups divided by ethnocultural, clinical status, and ethnopsychological information showed signifi-cant differences in either Total-I or Total-C. However, the differences in Total-I and Total-C were not identical. Moreover, multiple-response questions had combinations with small number of participants (‘‘other combinations’’ in Tables2–4) and therefore average comparisons were not always available. Logistic regression analysis is useful to analyze multiple-response questions as well as to remove confounding factors. Regardless of Total-I or Total-C, a high score indicated the possibility of having PTSD. Thus, the group possibly without PTSD (both Total-l and Total-C were low; low score)/group possibly with PTSD (either Total-I or Total-C were high; high score) was analyzed as the depen-dent variable using categories obtained by self-administered questionnaire as categorical independent variables.
Logistic regression analysis did not extract categories of demographic information. That is, although female gender was reported to increase vulnerability compared to male gender [13–15, 30, 31], neither average comparison nor logistic regression showed significant differences in the present study. The middle-aged class, which increased the scores in previous studies using logistic regression [13–15], was also not extracted. Those who were required to make decisions within close relationships seemed to have a risk to PTSD, because ‘‘self’’ and ‘‘not married’’ in ‘dominant role in spousal relationship’ displayed high scores as well as ‘‘try to organize’’ in ‘predominant forms of response in stressful situation.’ Although the impact of marital status on PTSD was previously reported to be ambiguous [32], ‘‘not married’’ was associated with high scores in the present study. Adults living in the same household reported sharing similar PTSD levels [33], but the level also seemed to be dependent on ‘role in spousal relationship.’ Such characteristics may be responsible for the discrepancies with previous reports [13–15,30,31].
Being pragmatic, for example, ‘priority value’ was ‘‘profession,’’ was associated with a low score. With regard to other ethnocultural information, ‘relation to own nationality’ and ‘relation to other nationalities’ that showed differences in average comparison were not extracted in logistic regression analysis.Further, ‘observance of national ceremonies’ and ‘preferred method of medical treatment’ were extracted. Therefore, it is possible that psychological connection to the Nanai tradition plays an important role in the score. It is still unclear why both ‘‘positive’’ and ‘‘negative’’ attitudes toward ‘observance of national cere-monies’ displayed high scores. However, ‘‘indifferent’’ was
at least supposed to be a pragmatic attitude displaying likelihood of having a low score. In average comparison, ‘‘loss of interest,’’ ‘‘conflict/aggression,’’ and ‘‘rely on something mystical’’ in ‘manifestation of social disadap-tation’ participated in high scores, whereas ‘‘rely on something mystical’’ alone was extracted in logistic regression analysis. This finding also supports the impor-tance of psychological connection to the Nanai tradition. It seems natural that a response of ‘‘always’’ regarding ‘anxiety’ showed high scores in both average comparison and logistic regression analysis. Several previous studies indicated that PTSD symptoms were strongly related to physical health problems and functional health status [14, 31,33]. However, ‘physical health’ was not extracted in the present study.
Judging from an average comparison among the ethno-psychological questions related to the Amur River, ‘water pollution in the Amur River is’ and ‘the Amur River for me is’ seemed to affect the scores. ‘The Amur River for me is,’ but not ‘water pollution in the Amur River is,’ was extracted in logistic regression analysis. As ‘‘sacred’’ was associated with a high score, intimacy to the Amur River was suggested to increase the scores as well as psycho-logical connection to the Nanai tradition. The low score in ‘‘the main source of business’’ also seemed to be related to pragmatic attitude.
It is suggested that the Nanai have specific spousal relationships, that those who are more pragmatic are less likely to have PTSD, and that those who are intimate to the Nanai tradition and the Amur River are likely to have PTSD. However, attitudes toward the Nanai tradition and the Amur River are specific to the Nanai. Their ethno-graphic information was independent and could not be compared with other ethnic groups. The development of a questionnaire suitable to identify ethnographic research with native communities is essential to incorporate a dee-per understanding of culturally based reactions and responses to trauma exposure [34]. The present findings provide a means of distinguishing ethnographic informa-tion more precisely. We are currently planning to perform a follow-up investigation to clarify relationships between the scores and ethnographic specificity.
Conflict of interest We acknowledge that we have no conflict of interest.
References
1. U.N.E.P. The Songhua River Spill China, December 2005, Field Mission Report, 2005.
3. Sulyandziga RV, Kudryashov D, Sulyandziga PV. Indigenous peoples of the North, Siberia and Far East of the Russian Fed-eration. Overview of the current situation. 2003.http://raipon.info/ narody/narody-severa-sibiri-i-dalnego-vostoka-rf/243-2009-08-19-14-43-43.html. (In Russian).
4. Galea S, Nandi A, Vlahov D. The epidemiology of post-traumatic stress disorder after disasters. Epidemiol Rev. 2005;27:78–91. 5. North CS, Nixon SJ, Shariat S, Mallonee S, McMillen JC,
Spit-znagel E, Smith EM. Psychiatric disorders among survivors of the Oklahoma City bombing. JAMA. 1999;282:755–62.
6. Feinstein A, Owen J, Blair N. A hazardous profession: war, journalists and psychopathology. Am J Psychol. 2002;59:1570–5. 7. Hawryluck L, Gold WL, Robinson S, Pogorski S, Galea S, Styra R. SARS control and psychological effects of quarantine, Toronto Canada. Emerg Infect Dis. 2004;10:1206–12.
8. Smith MW, Schnurr PP, Rosenheck RA. Employment outcomes and PTSD symptom severity. Ment Health Serv Res. 2005;7: 89–101.
9. Magruder KM, Frueh BC, Knapp RG, Davis L, Hamner MB, Martin RH, Gold PB, Arana GW. Prevalence of posttraumatic stress disorder in Veterans Affairs primary care clinics. Gen Hosp Psychiatr. 2005;27:169–79.
10. Azoulay E, Pochard F, Kentish-Barnes N, Chevret S, Aboab J, Adrie C, et al. Risk of post-traumatic stress symptoms in family members of intensive care unit patients. Am J Respir Crit Care Med. 2005;171:987–94.
11. Bromet EJ. Mental health consequences of the Chernobyl disas-ter. J Radiol Prot. 2012;32:N71–5.
12. Norris FH. Epidemiology of trauma: frequency and impact of different potentially traumatic events on different demographic groups. J Consult Clin Psychol. 1992;60:409–18.
13. Norris FH, Friedman MJ, Watson PJ, Byrne CM, Diaz E, Kani-asty K. 60,000 disaster victims speak: part I. An empirical review of the empirical literature 1981–2001. Psychiatr. 2001;65: 207–39.
14. Schnurr PP, Green BL. Understanding relationships among trauma, post-tramatic stress disorder, and health outcomes. Adv Mind Body Med. 2004;20:18–29.
15. Ursano RJ, Fullerton CS, Weisaeth L, Raphael B, editors. Text-book of disaster psychiatry. Cambridge: Cambridge University Press; 2007. p. 3–28.
16. Bassett D, Tsosie U, Nannauck S. ‘‘Our culture is medicine’’: perspectives of native healers on posttrauma recovery among American Indian and Alaska Native patients. Perm J. 2012;16:19–27.
17. Tarabrina NV. Workshop on the psychology of post-traumatic stress. St. Petersburg, Russia. 2001; 272: pp 118–40, 210–27 (in Russian).
18. Weiss DS, Marmar CR. The Impact of Event Scale—Revised. In: Wilson JP, Keane TM, editors. Assessing Psychological Trauma and PTSD Guilford Press. NY, USA, 1997; pp. 399–411. 19. Weathers FW, Blake DD, Krinsley KE, Haddad W, Huska JA,
Keane TM. The Clinician-Administered PTSD Scale (CAPS): reliability and construct validity. Paper presented at the meeting of the Association for the Advancement of Behavior Therapy. Boston, MA, USA, 1992a.
20. Weathers FW, Blake DD, Krinsley K, Haddad W, Huska J, Keane TM. The Clinician-Administered PTSD Scale—diagnostic
Version (CAPS-1): description, use, and psychometric properties. In Symposium, An update on the Clinician Administered PTSD Scales (CAPS-1 and CAPS-2), presented at the meeting of the International Society of Traumatic Stress Studies, Los Angeles, CA, USA, 1992b.
21. American Psychiatric Association. Diagnostic and statistical manual of mental disorders. 4th ed. DC: Washington; 1994. 22. Asukai N, Kato H, Kawamura N, Kim Y, Yamamoto K,
Kishimoto J, Miyake Y, Nishizono MA. Reliability and validity of the Japanese-language version of the impact of event scale-revised (IES-R-J). Four studies of different traumatic events. J Nerv Dis. 2002;190:175–82.
23. Mitani S. Comparative analysis of the Japanese version of the revised impact of event scale: a study of firefighters. Prehosp Disaster Med. 2008;23:s20–6.
24. Creamer M, Bell R, Failla S. Psychometric properties of the Impact of Event Scale-Revised. Behav Res Ther. 2003;41: 1489–96.
25. Amone PK. Torture against children in rebel captivity in North-ern Uganda: physical and psychological effects and implications for clinical practice. Torture. 2009;19:102–17.
26. Mello MF, Yeh MS, Barbosa NJ, Braga LL, Fiks JP, Mendes DD, Moriyama TS, Valente N, Costa MC, Mattos P, Bressan RA, Andreoli SB, Mari JJ. A randomized, double-blind, placebo-controlled trial to assess the efficacy of topiramate in the treat-ment of post-traumatic stress disorder. BMC Psychiatr. 2009; 29:9–28.
27. Elhai D, Gray J, Kashdan B, Franklin L. Which instruments are most commonly used to assess traumatic event exposure and posttraumatic effects? A survey of traumatic stress professionals. J Trauma Stress. 2005;18:541–5.
28. Adkins JW, Weathers FW, McDevitt MM, Daniels JB. Psycho-metric properties of seven self-report measures of posttraumatic stress disorder in college students with mixed civilian trauma exposure. J Anxiety Disord. 2008;22:1393–402.
29. Beck JG, Grant DM, Read JP, Clapp JD, Coffey SF, Miller LM, Palyo SA. The Impact of Event Scale—revised: psychometric properties in a sample of motor vehicle accident survivors. J Anxiety Disord. 2008;22:187–98.
30. Giorgadze T, Maisuradze I, Giorgadze S, Utiashvili Z, Abesadze G. Mainstreaming gender in disaster (review). Georgian Med News. 2012; 38–41.
31. Javidi H, Yadollahie M. Post-traumatic stress disorder. Int J Occup Environ Med. 2012;3:2–9.
32. Nygaard E, Wentzel-Larsen T, Hussain A, Heir T. Family structure and posttraumatic stress reactions: a longitudinal study using multilevel analyses. BMC Psychiatr. 2011;15:195–204. 33. Ford JD, Schnurr PP, Friedman MJ, Green BL, Adams G, Jex S.
Posttraumatic stress disorder symptoms, physical health, and health care utilization 50 years after repeated exposure to a toxic gas. J Trauma Stress. 2004;17:185–94.