R E S E A R C H A R T I C L E
Open Access
Knowledge, attitude, practice and
associated factors towards spectacles
use among adults in Gondar town,
northwest Ethiopia
Alemayehu Desalegn
1*, Asamer Tsegaw
2, Destaye Shiferaw
1and Haile Woretaw
1Abstract
Background:Refractive error is the main cause of visual impairment in the world. Spectacles are the most frequently used options for correcting refractive errors. In addition, they can be used for protection and fashion. It is the simplest, cheapest and only method used in developing countries like Ethiopia. This study aims to explore the knowledge, attitude, practice and associated factors towards spectacles use among adult population of Gondar town, northwest Ethiopia.
Methods:Community based cross sectional study was conducted on 780 participants using a pre-tested
structured questionnaire in Gondar. Data were analyzed using Statistical Package for Social Sciences (SPSS) 20 version computer software. Association and strength between variables was determined using odds ratio with 95 % confidence interval.
Result:A total of 780 study subjects participated in this study. The male to female ratio was 1:2.4. The median age of the participants was 29 (±22 IQR) with a range of 18–86 years. About fifty percent of participants were married and 284 (36.4 %) were educated up to secondary school. Seven hundred and three (90.6 %) participants had adequate knowledge about spectacles and 90.4 % had favorable attitude towards spectacle use. About 25 % of the participants have been using spectacles during the study. Participants with primary school education (AOR: 2.79, 95 % CI 1.20–6.50) had good knowledge about spectacles. Housewives (AOR = 3.40, 95 % CI; 1.35–8.54) and participants who unable to read and write (AOR: 3.51, 95 % CI 14–10.72) had favorable attitude towards
spectacles use.
Conclusion:Gondar town adult population has adequate knowledge and favorable attitude towards spectacles.
However, practice of spectacles use is poor. Eye health education related to spectacles utilization need to be given due emphasis by eye care professionals in collaboration with University of Gondar and Gondar town administration.
Keywords:Spectacles, Knowledge, Attitude, Practice, Gondar
* Correspondence:[email protected]
1Department of Optometry, College of Medicine and Health Science,
University of Gondar, Gondar, Ethiopia
Full list of author information is available at the end of the article
Background
Spectacles are optical instruments consisting of a frame that holds a pair of lenses to correct defective visions (reading and/or distance), protection, fashion and for achievement of confidence [1–3].
Refractive error is a common cause of visual impairment and blindness and It is estimated that 2.3 billion people lives with refractive errors worldwide [4, 5]. There are an estimated 153 million people with visual impairment due to uncorrected refractive errors, i.e. presenting visual acu-ity < 6/18 in the better eye, excluding presbyopia [6]. The prevalence of refractive errors varies from one place to the other ranging from 20 to 80.5 % [7, 8].
Uncorrected refractive errors are increasingly being addressed in national plans for the prevention of blindness, and low-cost, good-quality spectacles are becoming available [6].
Despite the fact that, majority of those with refractive errors could have their sight restored with spectacles, it is only 1.8 billion have access to eye examinations and af-fordable correction. This leaves approximately 500 million people, mostly in developing countries (close to one-third are in Africa) and many children, with uncorrected re-fractive error which exposes them to blindness and im-paired vision. Many are not aware that there is a correction for their compromised vision, have no one to provide treatment, or cannot afford the appliances they need. In the above 50 years, at least 80 % of them require spectacle corrections for near vision [9].
The way to eliminate uncorrected refractive error is through the development of all aspects of a self-sustaining system, including human resources to provide eye care services; and spectacles to correct vision [5]. Spectacles are the most frequently used options for correcting re-fractive errors as they are the simplest, cheapest and most widely used methods that have a high success rate in terms of visual acuity, quality of life and cultural accept-ance to rural as well as urban populations [6].
Though spectacles has been included in the essential drug list of the World Health Organization’s [10], people are not using glasses even when prescribed by a spe-cialist due to beliefs and attitudes of users, parent (if children) and the community as a whole [2, 3].
It was vision 2020’s plan to improve public awareness, gen-erate demand for services through community-based initia-tives, primary eye care, and school eye-health programmers. Specifically, in low-income settings, provided that spectacles are new, of good quality, accessible and affordable [6].
This study explored knowledge, attitude, practice and associated factors towards spectacles use among adult population in Gondar. The findings will help efforts to be geared towards altering them or strengthening them. It will also give base line information for further study to be conducted on similar topics.
Methods
Community based cross sectional study was conducted in Gondar town, northwest Ethiopia, Amhara National Re-gional State, 738 Km from the capital city (Addis Ababa) and 180 Km from Bahir Dar (Capital city of Amhara Na-tional Regional State). According to the 2007 naNa-tional cen-tral statistical agency, an estimated population of 207,044 lives in the town of whom 98,120 and 108,924 male and female respectively with total house hold count of 53,725. Gondar town has 24 administrative areas (kebeles). There is one tertiary eye care and training center in the town, which serves more than 14 million people of the catch-ment area. In the eye, care and training center there is one optical workshop where spectacles are glazed and fitted. The study was conducted from November 2013 to December 2013.
Adults age≥18 years old living in Gondar town were the source population. The inclusion criterion was per-manent residence in Gondar town. Individuals who were unable to respond to the questionnaire due to ei-ther serious illness or mental problem and those who resided less than 6 month in the study area were excluded.
Sample size was determined by using the single popula-tion proporpopula-tion formula. Considering the proporpopula-tion of people with adequate knowledge, favorable attitude and good practice towards spectacles use 50 %, a design effect of 2 and 10 % of non-response rate, the final sample size was 845. (Detail annexed)
In order to reach the calculated sample, a multistage random sampling technique was used. Initially, 4 kebeles (local administrative areas) out of 12 were selected using computer generated random numbers after a census list of all kebeles. Households were allocated for each kebele proportionally. Systematic random sampling was employed to select households (with sampling fraction of constant K = 14). Finally, lottery method was used to select partici-pants in households where more than one adult (≥18 years old) was present.
The outcome variables were knowledge (adequate/ inadequate), attitude (favorable/unfavorable) and practice (good/poor).
respondents who wear spectacles below fifty percent of the time for intended use.
Face to face interview was employed using structured questionnaires to collect data from 2nd November to 24th November 2013. Eight hundred forty-five households were selected through systematic random sampling tech-nique. First, data collectors (six optometrists and eight 4th year optometry students) introduced themselves and ex-plained the purpose of the study. Oral informed consent was obtained from each participant. If there was no individ-ual in the selected household on the first visit of data collec-tion, the house was re-visited. Non-response was considered when the randomly selected individual was not willing to participate and the reason for refusal was recorded.
In order to ensure the quality of data, the questionnaire was translated from English to Amharic (local language) and then back to English by language expertise for consistency. Pre-test was conducted (on 5 % of the sample size) in Azezo, which was not included in the sample area, and training was given for data collectors for 1 day. Data were checked for completeness, clarity and cleanliness be-fore analysis by the supervisor.
After coding, data were entered into EPI INFO 2002 and exported to and analyzed using SPSS version 20. De-scriptive statistics was used to compute the proportion of knowledge, attitude and practice towards spectacles use. Binary logistic regression was carried out to identify factors associated with the outcome variables. Variables that were found to be association at p-value of 0.2 and below were entered into the multiple logistic regression. Odds ratio with 95 % confidence interval atp< 0.05 was used to determine statistically significant association.
Results
Socio-demographic characteristics of respondents
A total of 780 study subjects participated in the study. The response rate was 92.2 %. The male to female ratio was 1:2.4. Five hundred and fifty one (70.6 %) were fe-males and 229 (29.4 %) were fe-males. The median age of the participants was 29 (±22 IQR) with range of 18–86 years. Four hundred seventy eight (61.3 %) were between 18 and 34 years. Three hundred and ninety four (50.5 %) participants were married, 637 (81.7 %) were Christian Orthodox in religion, 736(94.4 %) were Amhara in ethni-city, 284 (36.4 %) were educated up to secondary school and 238(30.5 %) were house wives (Appendix, Table 1).
Knowledge about spectacles among study participants
Among the total participants, 703 (90.6 %) of them had adequate knowledge about spectacles. Among partici-pants with adequate knowledge, 209 (29.8 %) source of information was from colleagues. Six hundred and fifty nine (94.0 %) of participants responded that spectacles are useful of whom 397 (56.5 %) responded as spectacles
are useful for both distances (near and distance), protec-tion and fashion (Appendix, Table 2).
Attitude towards spectacles use in the study population
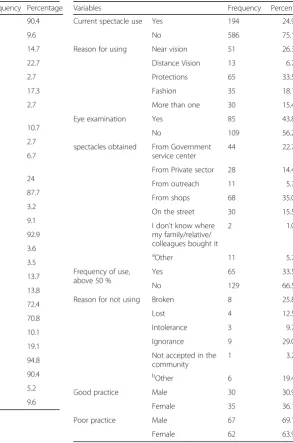
From the total 780 respondents, 705 (90.4 %) agreed to use spectacles if prescribed by eye care professional whereas 75 (9.6 %) disagree. Worsening existing problem 18 (24.0 %), age 17 (22.4 %), social unacceptability 13 (17.3 %) were frequently mentioned as reasons for not wearing. Six hundred and eighty four (87.7 %) of the re-spondents agreed that spectacles can be worn at any age and 725 (92.9 %) of the respondents agreed that spectacles can be worn by male and female if prescribed by eye care professionals. Five hundred and fifty two (70.8 %) of par-ticipants also agreed that wearing spectacles which are not prescribed by eye care professionals can cause problem to the eye. Overall, 715(91.7 %) of the respondents had favor-able attitude towards spectacles use (Appendix, Tfavor-able 3).
Practice of spectacles use in the study population
From the total 780 participants, 194 (24.9 %) have been using spectacles. The reasons mentioned for using spectacles include: near vision 51 (26.3 %), distance vision 13 (6.7 %), protection 65 (33.5 %) and fashion 35 (18.1 %). More than half (56.2 %) of the spectacles users got their spectacles with-out eye examination. Forty four (22.7 %), 68 (35.0 %), and 30 (15.5 %) of the participants got their spectacles from govern-ment service centers, shops and on streets respectively. About 34 % of spectacles users have good practice. Among previous spectacle users about 26 % do not use spectacles currently due to spectacles break and 29 % due to ignorance (Appendix, Table 4).
Variables associated with knowledge about spectacles
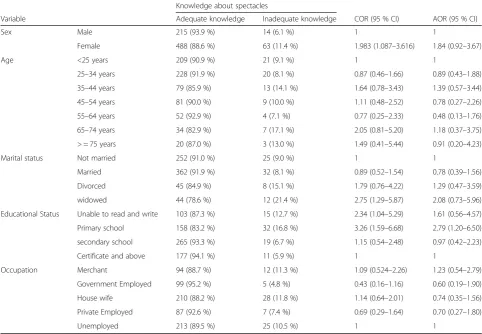
Educational status has an overall statistical association with knowledge about spectacles (overall P< 0.001). Pri-mary school level of education has statistically significant association with knowledge about spectacles (AOR = 2.79, 95 % CI, 1.20–6.50) (Appendix, Table 5).
Variables associated with attitude towards spectacles use
Variables association with spectacles use (practice)
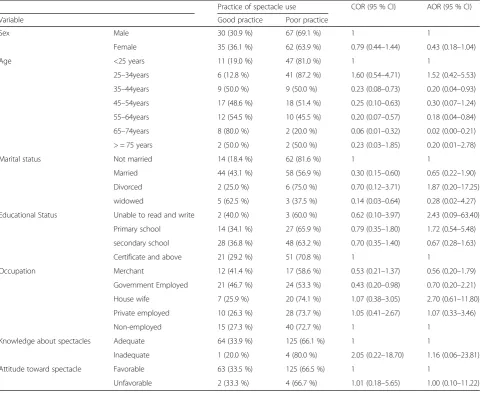
Only age of the respondents showed association with practice of spectacles use. Age category 35–44 years (AOR = 0.20, 95 % CI; 0.04–0.93), 55–64 years (AOR = 0.18, 95 % CI; 0.04–0.84), and 65–74 years (AOR = 0.02, 95 % CI; 0.00–0.2) has an association with practice of spectacle use (Appendix, Table 7).
Discussion
In this study, about 91 % of the participants had adequate knowledge about spectacles. This result is higher than study done in India [11]. This might be due to the differ-ence in the study setting; the study in India was rural set-ting while this study was conducted in urban setset-ting. People living in urban have multiple source of information to know about spectacles: health centers, mass media and higher people interactions than those live in rural. Again, the proportion of educated people living in urban may be higher than those live in rural, which attributed to know-ledge about spectacles.
The most frequently reported source of information for knowledge about spectacles was colleagues. This might be because people-to-people interaction (those wearing spectacles and not wearing) was ease way to get knowledge about spectacles than other source of infor-mation in the study area.
More than half (56.5 %) of the respondents reported that spectacles are useful for near vision, distance vision, protection and fashion. About 13 % of the participants re-ported that spectacles are useful only for protection. Less than 3 % of the participants reported that spectacles are useful for only near vision. This result is lower than study done in India (90 %) [12]. This might be due to the sample population in the Indian study was old people (mean age 45 years) who were more likely to be presbyopic and likely to use spectacles for near vision.
In this study 715 (91.7 %) of the respondents had favorable attitude towards spectacles use which is higher than a study reported from Nigeria (61.6 %) [14]. This might be due to cul-tural difference (beliefs of spectacles are not useful is much higher in Nigeria 60.53 % than this study area (14.7 %), whereas others beliefs towards spectacles were comparable).
Seven hundred and five (90.4 %) respondents intend to use spectacles if prescribed for them (including those who have been using spectacles and claiming that they will use it again). This result is higher than that of a study con-ducted in Nigeria, 122 (61.6 %) [14]. It might be due to two reasons: cultural difference (beliefs- don’t like spectacles was higher in Nigeria) and other options availability that can replace spectacles such as contact lens in Nigeria, and the inclusion of already spectacles users in this study.
Seventy five (9.6 %) of the respondents were not willing to wear spectacles if prescribed for them. This result is lower than study done in Nigeria (38.38 %) [14]. This
might be due to numbers of study participants in Nigeria who responded “do not like spectacles” 38 (38.4 %), is higher than in this study 11 (14.6 %). The others reasons mentioned for not using were; social unacceptability 13 (17.3 %) and worsen the problem 15 (20.0 %) in this study which is comparable with study result reported from Nigeria. Ignorance 9 (29.0 %) and intolerance 3 (9.7 %) were other reasons for not using spectacles which is simi-lar with the study reported from Nigeria [15].
One hundred and ninety four (24.9 %) of the respon-dents were spectacles users during the study period which is similar with the finding in India [13]. But this result is lower than a study reported from Nigeria [14]. This could be attributable to a different in refractive errors preva-lence and accessibility to spectacles.
Among 194 (24.9 %) of spectacle users, 100 (51.6 %) of them use spectacles for protection and fashion. One hundred and nine (56.2 %) of spectacles users did not examine their eyes for spectacles use. Ninety eight (50.5 %) of spectacles users got their spectacles on streets and shops. The reason why more than half of the spectacles users did not get their eye examined and bought spectacles from street and shop might be due to their beliefs that all spectacles are protective and don’t need eye examination. Sixty five (33.5 %) of spectacles users use for protection which is much higher than study result from Nigeria. This might be due to ad-equate knowledge about spectacles and dusty as well as sunny environment in this study area.
Overall, 129 (66.5 %) of the spectacles users had poor practice of spectacles use. This might be related to getting spectacles from shops and on streets with-out their eyes examined. This result is almost similar with the study reported from Nigeria [15].
Sex, marital status, educational status, occupations, knowledge and attitude of the study participants about spectacles have no statistical significant association with practice of spectacles use. However, age of the re-spondent showed significant statistical association with practice of spectacles use. Age category 35–44 years (AOR = 0.20, 95 % CI; 0.04–0.93), 55–64 years (AOR = 0.18, 95 % CI; 0.04–0.84), and 65–74years (AOR = 0.02, 95 % CI; 0.00–0.21) had significant association with spectacles use.
Participants with primary school level of education (AOR: 2.79, 95 % CI 1.20–6.50) were about three times more likely to have adequate knowledge about spectacles. This might be due to participants with primary level education feel that they know everything.
use. In this study, most of the participants were house-wives and were not enable to read and write. The probability of having favorable attitude towards spec-tacle use might be due adherence to advice given to them and/or believing that spectacles are prescribed as mechanism to correct their eye problem.
The probability of having favorable attitude in those who have inadequate knowledge about spectacles might be due to their beliefs that spectacles are like medicine and they only given to individual for particular reasons which enhance the vision or confidence of them. An-other possible reason might be ignorance from those who have adequate knowledge about spectacles.
Age category 35–44 years (AOR = 0.20, 95 % CI; 0.04–0.93), the likelihood of good practice of spectacles among this age category was less. This might be due to three reasons. Firstly, this age category is age of pre and early presbyopia. Though, this is the age at which prob-ability of using spectacles for near vision starts due to pre and early presbyopia, they might use spectacles for limited reasons like for very small prints than as per prescribed to use. Secondly, they might have used spectacles bought from shops and on streets without their eye examined which might be too much or too low for their vision demand. This may result in poor adaptation or infrequent use of the spectacles. Thirdly, using spectacles, especially for near vision, might be as-sumed the sign of aging which might result in infre-quent use of spectacles.
The likelihood of good practice of spectacles use among participants with age category 55–64 years (AOR = 0.18, 95 % CI; 0.04–0.84) and 65–74 years (AOR = 0.02, 95 % CI; 0.00–0.21) becomes less. The odds of good practice in the age groups also showed that there is a decreasing likelihood of using spectacles as age increases. This could be explained: first, spectacles bought from streets and shops without eye examination may not fulfill visual demand. Second, even though this age group is the time of presbyopia when near vision spectacles demanded, it is also the time of retirement so that they infrequently uses spectacles near vision. If they do not regularly checkup their eyes and do not change their spectacles, current spectacles may not satisfy their near vision demand. Third, because of regular spectacles change is needed to achieve their good near vision; there might be an economic problem to change their spectacles, which might lead to poor practice of spectacles use. Fourth, as age increases spectacles might not correct their vision to what they expected this is probably due to increase in age related ocular problems, which reduces correc-tion of vision with spectacles. Hence, the likelihood of good practice of spectacles use among these age groups was minimal.
Conclusion
In general, finding from this study showed that adult population in Gondar town have adequate knowledge and favorable attitude towards spectacles use. How-ever, the practice of spectacles use is poor and old age people have poor practice of spectacles use. People with primary education level were more likely know-ledgeable about spectacles use. Housewives and people who can’t read and write had favorable attitude to-wards spectacles use.
Appendix
Sample size determination and sampling procedure
Sample size was determined by using the single popula-tion proporpopula-tion formula:
n¼z
2α=2p 1ð −pÞ
w2 ¼
1:96 ð Þ2
0:5
ð Þð1−0:5Þ 0:05
ð Þ2 ¼384
Where:
– α(Level of significance) = 5 %
– Z = value of z statistic at 95 % confidence level = 1.96
– W = maximum allowable error = 5 %
– P (proportion people with adequate knowledge, favorable attitude and good practice towards spectacle use) = 50 %
– q = 1–p = 50 %
– n = sample size
Table 1Socio-demographic characteristics of study participants in Gondar town, Northwest Ethiopia, 2013 (n= 780)
Variable Frequency Percentage
Sex Male 229 29.4
Female 551 70.6
Age <25 years 230 29.5
25–34 years 248 31.8
35–44 years 92 11.8
45–54 years 90 11.5
55–64 years 56 7.2
65–74 years 41 5.3
≥75 years 23 2.9
Marital status Not married 277 35.5
Married 394 50.5
Divorced 53 6.8
widowed 56 7.2
Religion Orthodox 637 81.6
Muslim 126 16.2
Catholic 1 0.1
Protestant 7 0.9
aOther 9 1.2
Ethnicity Amhara 736 94.4
Tigrie 26 3.3
Oromo 3 0.4
bOther 15 1.9
Educational Status Unable to read and write 118 15.1
Primary school 190 24.4
secondary school 284 36.4
Certificate and above 188 24.1
Occupation Merchant 106 13.6
Government Employed 104 13.3
House wife 238 30.5
Private employed 94 12.1
unemployed 238 30.5
a
Others: Judaism, Paganism
b
Others: SNNP, Benishangul Gumuz, Afar and Harari
Table 2Knowledge about spectacles among study participants in Gondar town, Northwest Ethiopia, 2013 (n= 780)
Variables Frequency Percentage
Do you know spectacles Yes 703 90.1
No 77 9.9
Source of information School 94 13.4
Mass media 40 5.7
Health institution 170 24.2
Colleagues 209 29.8
Family 39 5.6
Reading materials 21 2.8
More than one source
130 18.5
Usefulness of spectacle Yes 659 94
No 15 2.5
Don’t know 29 3.5
Why it is useful Near vision only 17 2.4
Distance vision only 9 1.3
Protection 88 12.5
Fashion 3 0.4
For all of the above 397 56.5
More than one but not all
189 26.9
Adequate Knowledge Male 215 93.9
Female 488 88.6
Inadequate knowledge Male 14 6.1
Table 3Attitude towards spectacle use among study participant in Gondar town, Northwest Ethiopia, 2013 (n= 780)
Variables Frequency Percentage
Use of spectacle if prescribed
Yes 705 90.4
No 75 9.6
Reason for not using if prescribed
Not Useful (like it) 11 14.7
Because of my age 17 22.7
Because of my sex 2 2.7
Socially unacceptable 13 17.3
My religion doesn’t allow
2 2.7
Can’t afford 8 10.7
Makes my eye big 2 2.7
It makes my eye small
5 6.7
Worsen the problem 18 24
Spectacles should worn at any age
Agree 684 87.7
Neither 25 3.2
Disagree 71 9.1
Both sex should wear spectacles
Agree 725 92.9
Neither 28 3.6
Disagree 27 3.5
Professionally prescribed spectacles weaken the eye
Agree 107 13.7
Neither 108 13.8
Disagree 565 72.4
Wearing Professionally not prescribed spectacles cause eye problem
Agree 552 70.8
Neither 79 10.1
Disagree 149 19.1
Favorable attitude Male 217 94.8
Female 498 90.4
Unfavorable attitude Male 12 5.2
Female 53 9.6
Table 4Practice of spectacles use among respondents in Gondar town, Northwest Ethiopia, 2013 (n= 780)
Variables Frequency Percentage
Current spectacle use Yes 194 24.9
No 586 75.1
Reason for using Near vision 51 26.3
Distance Vision 13 6.7
Protections 65 33.5
Fashion 35 18.1
More than one 30 15.4
Eye examination Yes 85 43.8
No 109 56.2
spectacles obtained From Government service center
44 22.7
From Private sector 28 14.4
From outreach 11 5.7
From shops 68 35.0
On the street 30 15.5
I don’t know where my family/relative/ colleagues bought it
2 1.0
a
Other 11 5.7
Frequency of use, above 50 %
Yes 65 33.5
No 129 66.5
Reason for not using Broken 8 25.8
Lost 4 12.5
Intolerance 3 9.7
Ignorance 9 29.0
Not accepted in the community
1 3.2
bOther 6 19.4
Good practice Male 30 30.9
Female 35 36.1
Poor practice Male 67 69.1
Female 62 63.9
a
Others: From friend, got lost one, given as a gift from a friend
b
Table 5Association between socio-demographic variables with the knowledge of respondents about spectacles, in Gondar town Northwest Ethiopia 2013
Knowledge about spectacles
Variable Adequate knowledge Inadequate knowledge COR (95 % CI) AOR (95 % CI)
Sex Male 215 (93.9 %) 14 (6.1 %) 1 1
Female 488 (88.6 %) 63 (11.4 %) 1.983 (1.087–3.616) 1.84 (0.92–3.67)
Age <25 years 209 (90.9 %) 21 (9.1 %) 1 1
25–34 years 228 (91.9 %) 20 (8.1 %) 0.87 (0.46–1.66) 0.89 (0.43–1.88)
35–44 years 79 (85.9 %) 13 (14.1 %) 1.64 (0.78–3.43) 1.39 (0.57–3.44)
45–54 years 81 (90.0 %) 9 (10.0 %) 1.11 (0.48–2.52) 0.78 (0.27–2.26)
55–64 years 52 (92.9 %) 4 (7.1 %) 0.77 (0.25–2.33) 0.48 (0.13–1.76)
65–74 years 34 (82.9 %) 7 (17.1 %) 2.05 (0.81–5.20) 1.18 (0.37–3.75)
> = 75 years 20 (87.0 %) 3 (13.0 %) 1.49 (0.41–5.44) 0.91 (0.20–4.23)
Marital status Not married 252 (91.0 %) 25 (9.0 %) 1 1
Married 362 (91.9 %) 32 (8.1 %) 0.89 (0.52–1.54) 0.78 (0.39–1.56)
Divorced 45 (84.9 %) 8 (15.1 %) 1.79 (0.76–4.22) 1.29 (0.47–3.59)
widowed 44 (78.6 %) 12 (21.4 %) 2.75 (1.29–5.87) 2.08 (0.73–5.96)
Educational Status Unable to read and write 103 (87.3 %) 15 (12.7 %) 2.34 (1.04–5.29) 1.61 (0.56–4.57)
Primary school 158 (83.2 %) 32 (16.8 %) 3.26 (1.59–6.68) 2.79 (1.20–6.50)
secondary school 265 (93.3 %) 19 (6.7 %) 1.15 (0.54–2.48) 0.97 (0.42–2.23)
Certificate and above 177 (94.1 %) 11 (5.9 %) 1 1
Occupation Merchant 94 (88.7 %) 12 (11.3 %) 1.09 (0.524–2.26) 1.23 (0.54–2.79)
Government Employed 99 (95.2 %) 5 (4.8 %) 0.43 (0.16–1.16) 0.60 (0.19–1.90)
House wife 210 (88.2 %) 28 (11.8 %) 1.14 (0.64–2.01) 0.74 (0.35–1.56)
Private Employed 87 (92.6 %) 7 (7.4 %) 0.69 (0.29–1.64) 0.70 (0.27–1.80)
Table 6Association of variables with attitude towards spectacles use among respondents, in Gondar town, Northwest Ethiopia 2013
Attitude toward spectacle
Variable Favorable Unfavorable COR (95 % CI) AOR (95 % CI)
Sex Male 217 (94.8 %) 12 (5.2 %) 1 1
Female 498 (90.4 %) 53 (9.6 %) 1.93 (1.01–3.67) 1.16 (0.51–2.61)
Age <25 years 217 (94.3 %) 13 (5.7 %) 1 1
25–34 years 228 (91.9 %) 20 (8.1 %) 1.46 (0.71–3.02) 1.46 (0.62–3.43)
35–44 years 84 (91.3 %) 8 (8.7 %) 1.59 (0.64–3.97) 1.01 (0.31–3.25)
45–54 years 84 (93.3 %) 6 (6.7 %) 1.19 (0.44–3.24) 0.65 (0.18–2.38)
55–64 years 50 (89.3 %) 6 (10.7 %) 2.00 (0.73–5.53) 1.20 (0.32–4.48)
65–74 years 33 (80.5 %) 8 (19.5 %) 4.05 (1.56–10.50) 1.81 (0.49–6.67)
> = 75 years 19 (82.6 %) 4 (17.4 %) 3.51 (1.04–11.84) 1.31 (0.26–6.54)
Marital status Not married 254 (91.7 %) 23 (8.3 %) 1 1
Married 369 (93.7 %) 25 (6.3 %) 0.75 (0.42–1.35) 0.30 (0.14–0.65)
Divorced 46 (86.8 %) 7 (13.2 %) 1.68 (0.68–4.14) 0.42 (0.14–1.3)
widowed 46 (82.1 %) 10 (17.9 %) 2.40 (1.07–5.37) 0.32 (0.01–1.05)
Educational Status Unable to read and write 94 (79.7 %) 24 (20.3 %) 4.11 (1.93–8.75) 3.5 (1.14–10.72)
Primary school 170 (89.5 %) 20 (10.5 %) 1.89 (0.88–4.07) 1.38 (0.51–3.71)
secondary school 274 (96.5 %) 10 (3.5 %) 0.59 (0.24–1.41) 0.48 (0.18–1.30)
Certificate and above 177 (94.1 %) 11 (5.9 %) 1 1
Occupation Merchant 97 (91.5 %) 9 (8.5 %) 1.60 (0.66–3.88) 2.64 (0.95–7.30)
Government Employed 99 (95.2 %) 5 (4.8 %) 0.87 (0.30–2.52) 1.67 (0.46–6.08)
House wife 206 (86.6 %) 32 (13.4 %) 2.69 (1.37–5.26) 3.40 (1.35–8.54)
Private employed 88 (93.6 %) 6 (6.4 %) 1.18 (0.44–3.20) 1.60 (0.52–4.67)
Non-employed 225 (94.5 %) 13 (5.5 %) 1 1
Knowledge about spectacle Adequate Knowledgeable 663 (94.3 %) 40 (5.7 %) 1 1
Acknowledgements
Gondar town administration office and all study participants for their cooperation and willingness.
Funding
University of Gondar.
Availability of data and materials
Dataset on which the conclusion was made is available in software and only available on request from Mr. Alemayehu Desalegn (contact address [email protected]).
Authors’contributions
AD developed the proposal and AT reviewed the proposal; DS analyze and write up the paper and HW reviewed final paper and prepares the manuscript. All the authors reviewed and approved the final manuscript.
Competing interests
The authors declare that they have no competing interest.
Consent for publication Not applicable.
Ethics approval and consent of participate
Ethical clearance was obtained from the School of Medicine, University of Gondar College of Medicine and Health Science, ethical review committee. Support letter from respective administrative areas (kebeles) were obtained. Participants were informed the purpose of the study and participation was voluntary. Confidentiality was kept by coding personal identity and locking data with password. Data collectors gave education and advice to those participants who misunderstood and displayed malpractice of spectacles use.
Author details
1Department of Optometry, College of Medicine and Health Science,
University of Gondar, Gondar, Ethiopia.2Department of Ophthalmology, College of Medicine and Health Science, University of Gondar, Gondar, Ethiopia.
Received: 13 July 2015 Accepted: 11 October 2016
References
1. Pamke J, Williams C, Ximenes L, Ximenes D, Palanui A, de Toit R, et al. A public-private partnership to provide spectacles for Timor-Leste. J Community Eye Health. 2002;20(63):54.
2. Faderin MA, Ajaiyeoba AI. Barriers to wearing glasses among primary school children in Lagos, Nigeria. Niger J Ophthalmol. 2001;9(1):15–9.
Table 7Association variables to practice of spectacles use among respondents, Gondar town, Northwest Ethiopia 2013 (n= 780)
Practice of spectacle use COR (95 % CI) AOR (95 % CI)
Variable Good practice Poor practice
Sex Male 30 (30.9 %) 67 (69.1 %) 1 1
Female 35 (36.1 %) 62 (63.9 %) 0.79 (0.44–1.44) 0.43 (0.18–1.04)
Age <25 years 11 (19.0 %) 47 (81.0 %) 1 1
25–34years 6 (12.8 %) 41 (87.2 %) 1.60 (0.54–4.71) 1.52 (0.42–5.53)
35–44years 9 (50.0 %) 9 (50.0 %) 0.23 (0.08–0.73) 0.20 (0.04–0.93)
45–54years 17 (48.6 %) 18 (51.4 %) 0.25 (0.10–0.63) 0.30 (0.07–1.24)
55–64years 12 (54.5 %) 10 (45.5 %) 0.20 (0.07–0.57) 0.18 (0.04–0.84)
65–74years 8 (80.0 %) 2 (20.0 %) 0.06 (0.01–0.32) 0.02 (0.00–0.21)
> = 75 years 2 (50.0 %) 2 (50.0 %) 0.23 (0.03–1.85) 0.20 (0.01–2.78)
Marital status Not married 14 (18.4 %) 62 (81.6 %) 1 1
Married 44 (43.1 %) 58 (56.9 %) 0.30 (0.15–0.60) 0.65 (0.22–1.90)
Divorced 2 (25.0 %) 6 (75.0 %) 0.70 (0.12–3.71) 1.87 (0.20–17.25)
widowed 5 (62.5 %) 3 (37.5 %) 0.14 (0.03–0.64) 0.28 (0.02–4.27)
Educational Status Unable to read and write 2 (40.0 %) 3 (60.0 %) 0.62 (0.10–3.97) 2.43 (0.09–63.40)
Primary school 14 (34.1 %) 27 (65.9 %) 0.79 (0.35–1.80) 1.72 (0.54–5.48)
secondary school 28 (36.8 %) 48 (63.2 %) 0.70 (0.35–1.40) 0.67 (0.28–1.63)
Certificate and above 21 (29.2 %) 51 (70.8 %) 1 1
Occupation Merchant 12 (41.4 %) 17 (58.6 %) 0.53 (0.21–1.37) 0.56 (0.20–1.79)
Government Employed 21 (46.7 %) 24 (53.3 %) 0.43 (0.20–0.98) 0.70 (0.20–2.21)
House wife 7 (25.9 %) 20 (74.1 %) 1.07 (0.38–3.05) 2.70 (0.61–11.80)
Private employed 10 (26.3 %) 28 (73.7 %) 1.05 (0.41–2.67) 1.07 (0.33–3.46)
Non-employed 15 (27.3 %) 40 (72.7 %) 1 1
Knowledge about spectacles Adequate 64 (33.9 %) 125 (66.1 %) 1 1
Inadequate 1 (20.0 %) 4 (80.0 %) 2.05 (0.22–18.70) 1.16 (0.06–23.81)
Attitude toward spectacle Favorable 63 (33.5 %) 125 (66.5 %) 1 1
3. Yawn BP, Kurland M, Butterfield L, Johnson B. Barriers to seeking care following school vision in Rochester, Minnesota. J School Health. 1998;68(8):319–24. 4. Dandona R, Dandona L. Refractive error blindness. Bull World Health Organ.
2001;79:237–43.
5. Brien AH, Sylvie S, Kylie K. The challenge of providing spectacles in the developing world. J Community Eye Health. 2000;13(33):9–10. 6. World Health Organization. Sight test and glasses could dramatically
improve the lives of 150 million people with poor vision. Press release, 11 October 2006. http://www.who.int/mediacentre/news/releases/2006/pr55/ en/index.html.
7. Olurin O. Refractive errors in Nigeria (A hospital clinic study). Ann Ophthalmol. 1973;5:971–6.
8. Nworah PB, Ezepue UF. Prevalence of errors of refraction in a Nigerian eye clinic. Orient J Med. 1992;4:57–60.
9. Thulasiraj RD, Aravind S, Pradhan BK. Spectacles for the Millions Addressing a priority of“Vision 2020 - The Right to Sight”. J Community Ophthalmol. 2003;3(4):19–21.
10. Potter AR. Providing spectacles in developing countries. Millions endure poor vision for want of affordable glasses. Biomed J. 1998;317(7158):551–2. 11. Chawla K, Rovers J. Survey of patient opinions on eyeglasses and eye care in rural and slum populations in Chennai. The Internet J of Epidemiol. 2009; 8(2):5.
12. Du Toit R, Ramke J, Palagyi A, Brian G. Spectacles in Fiji: need, acquisition, use and willingness to pay. Clin Exp Optometry. 2008;91(6):538–44. 13. Dandona R, Dandona L, Kovai V, Giridhar P, Prasad MN, Srinivas M.
Population-based study of spectacles use in Southern India. Community Eye Care. 2002;50(2):145–55.
14. Department of Ophthalmology, LAUTECH Teaching Hospital. Beliefs and attitude towards spectacles Osogbo, Nigeria. Niger J Clin Pract. 2009;12(4):359–61.
15. Omolase CO, Mahmoud AO. Factors associated with non-compliance with spectacle wear in an adult Nigerian population. Afr J Biomed Res. 2009;12(1):43–6.
• We accept pre-submission inquiries
• Our selector tool helps you to find the most relevant journal • We provide round the clock customer support
• Convenient online submission • Thorough peer review
• Inclusion in PubMed and all major indexing services • Maximum visibility for your research
Submit your manuscript at www.biomedcentral.com/submit