R E S E A R C H A R T I C L E
Open Access
A comparison of a new multinomial stopping
rule with stopping rules of fleming and gehan
in single arm phase II cancer clinical trials
John R Goffin
1*, Greg R Pond
2and Dongsheng Tu
3Abstract
Background:Response rate (RR) alone may be insensitive to drug activity in phase II trials. Early progressive disease (EPD) could improve sensitivity as well as increase stage I stopping rates. This study compares the previously developed dual endpoint stopping rule (DESR), which incorporates both RR and EPD into a two-stage, phase II trial, with rules using only RR.
Methods:Stopping rules according to the DESR were compared with studies conducted under the Fleming (16 trials) or Gehan (23 trials) designs. The RR hypothesis for the DESR was consistent with the comparison studies (ralt= 0.2,rnul= 0.05). Two parameter sets were used for EPD rates of interest and disinterest respectively (epdalt, epdnul): (0.4, 0.6) and (0.3, 0.5).
Results:Compared with Fleming, the DESR was more likely to allow stage two of accrual and to reject the null hypothesis (Hnul) after stage two, with rejection being more common with EPD parameters (0.4, 0.6) than (0.3, 0.5).
Compared with Gehan, both DESR parameter sets acceptedHnulin 15 trials after stage I compared with 8 trials by
Gehan, with consistent conclusions in all 23 trials after stage II.
Conclusions:The DESR may rejectHnulwhen EPD rates alone are low, and thereby may improve phase II trial
sensitivity to active, cytostatic drugs having limited response rates. Conversely, the DESR may invoke early stopping when response rates are low and EPD rates are high, thus shortening trials when drug activity is unlikely. EPD parameters should be chosen specific to each trial.
Background
The increase in drugs available for study along with the human and resource costs for the conduct of clinical trials requires investigators to revisit trial design [1,2]. Nowhere is this more evident than in oncology, which must contend with more first-in-class drugs, longer development times, more drugs entering large phase III studies, and generally greater costs than other therapeu-tic areas [3]. In addition, the development of targeted drugs, which may induce limited tumour response, demands phase II trial designs which both minimize resource use and are sensitive and specific to signals of drug activity [4].
When response rate (RR) is used as a single primary endpoint, two sets of stopping rules have served as the basis for many prior two-stage phase II trials. The stop-ping rules of Gehan stop trials at the first stage when no response was observed [5]. The sample size for the first stage is based on a specified RR of interest and a beta error rate. If at least one response was observed, the second stage accrues using a sample size based on the desired standard error for the RR estimation and the number of responses observed in stage one. For the stopping rules of Fleming, the investigator specifies RR’s of interest and disinterest as well as desired alpha and beta error rates [6]. Calculations determine the sample size in each stage and the minimum responses in stage one required to proceed to the second stage. The trial may be stopped after stage I of accrual to accept or reject the null hypothesis. Variations of the two-stage rules, such as those of Simon [7], have been designed to * Correspondence: [email protected]
1
McMaster University, Juravinski Cancer Centre, 699 Concession St., Hamilton, Ontario, L8V 5C2, Canada
Full list of author information is available at the end of the article
minimize the expected number of enrolled patients when drug is inactive. Despite the introduction of new study methods, the designs of Gehan, Fleming, and Simon still in common use [8,9].
Although RR remains the most common primary end-point in phase II trials [8], disease stabilization may be a more appropriate endpoint for some agents and has also been associated with improved survival [10,11]. Similarly, a high rate of early progressive disease (EPD), defined here as progression at the first tumour measurement after initiation of treatment, correlates with poor survival [12,13]. Conversely, a low EPD rate may suggest drug activity, and could serve as a warning against early dis-card of a new agent. A combination of response and EPD as a multinomial endpoint would identify an active drug which produces a high response rate or low EPD rate.
Zeeet al first derived stopping rules for a two-stage
clinical trial with a multinomial endpoint of RR and EPD [14]. However, it was found that these stopping rules only achieved the desired power for an alternate hypothesis requiring sufficiently high RRandsufficiently low EPD, whereas the study had sought power for an alternate hypothesis allowing for either a favourable RR
ora favourable EPD [15]. Recently, a new rule set [16], the Dual Endpoint Stopping Rule (DESR), was derived to address this problem. The new stopping rules offer the desired power as well as high rates of early stopping for drugs meeting the null hypothesis, but have not been applied to real data from phase II clinical trials. The objective of this paper is to compare the DESR with the stopping rules of Fleming and Gehan in a series of phase II trials as summarized by Dentet al[14,17]
Methods
The Dual Endpoint Stopping Rule (DESR) for phase II trials with endpoints of response and early progressive disease (EPD) rates is described here briefly and in detail previously, where variations on the rules and sensitivity testing have been provided [16]. Specifically, DESR is based on testing of the following hypotheses:
Hnul:r≤rnulandepd≥epdnulversusHalt:r≥raltorepd≤epdalt,
where the response rates (rnul,ralt) and early
progres-sive disease rates (epdnul,epdalt) of interest are
prespeci-fied. These hypotheses imply that a new drug would be considered of interest for further study if eitherthe response rate, r, was sufficiently high orthe early pro-gressive disease rate, epd, was sufficiently low; it is not necessary that both outcomes occur.
After additional study parameters including the sample size for stage I (n1) and stage II (n2) of the trial and the
desired alpha error rate and power are provided, stopping rules are generated by simulations performed using TreeAge Pro Healthcare software (Williamstown, Massachusetts)
with the Borderline Value Method [16], which assumes that response and EPD rates of the desirable drugs are not better thanr=raltorepd=epdalt. With the DESR,
the trial would be stopped at the first stage aftern1
sub-jects are entered ifn1r≤n1r-nulandn1p≥n1p-nul, where
n1randn1pare respectively the number of patients who
responded and had early progression andn1r-nulandn
1p-nulare thresholds of the DESR. Barring stopping,n2more
patients are recruited into the second stage. The null hypothesis will be rejected at the end of the second stage ifn1r+n2r≥n1r-alt+n2r-altorn1p+n2p≤n1p-alt+n2p-alt,
wheren2randn2pare respectively the number of patients
who responded and had early progression at stage II,n
1r-alt+n2r-altrepresents the threshold number of responders
required after stage II to concludeHalt, andn1p-alt+n
2p-altis similarly the threshold for the stage I and stage II
subjects with early progression to concludeHalt.
Data from two sets of phase II trials previously studied by Dentet al[17], were used to evaluate the DESR and compare it with stopping rules of Fleming and Gehan. The first set of these phase II trials was undertaken by the National Cancer Institute of Canada Clinical Trials Group, using the two stage stopping rule of Fleming. Trials were designed based on testing of hypothesesHnul:
r≤5% andHalt:r≥20%, which allows for continuation
to the second stage of accrual (withn2= 15) if one or
more responses are observed among the firstn1 = 15
patients. At the second stage,Hnulis rejected if four or
more responses are found. The second set of phase II trials was performed by the EORTC using the stopping rule of Gehan. The response rate of interest and beta error rate for the first stage were prespecified respectively as 20% and 0.05, which led to the sample sizen1 = 14.
Recruitment to the second stage occurs if at least one response is seen, with the size of n2 varying with the
number of responses seen in the first stage in conjunc-tion with a desired standard error rate. For comparison purposes, (rnul,ralt) was selected as (0.05, 0.2) to derive
DESR thresholds. Based on the work of Zeeet aland
others [Zee, 1999;Sekine, 1999], two plausible parameter sets were selected for EPD, (epdnul,epdalt) = (0.6, 0.4) or
(0.5, 0.3), to assess the impact of EPD on early stopping. The alpha error rate and power used to derive DESR thresholds were respectively 0.05 and 0.8, although actual error rates vary from this according to the final thresholds selected by the program [Goffin, 2008]. The sample sizes for both stages were set the same as that in the Fleming rules or actual recruitment to the various EORTC studies when comparisons were made with the Fleming and Gehan stopping rules respectively.
Results
utilizing the rules of Fleming. The table is read along the first row of results as follows: With desired study parameters ofrnul= 0.05,ralt = 0.2,epdnul= 0.6,epdalt=
0.4, alpha error 0.05, power 0.8, and two stages of accrual of 15 patients each, the trial would be stopped at the first stage to reject the drug (accept the null hypothesis) if there were 1 or fewer responding patients
and 8 or more patients with early progressive disease. Otherwise, the second stage would accrue, at the end of which the drug would be accepted (null hypothesis rejected) if 4 or more patients had responded to the drug or 14 or fewer progressed. This stopping rule would have an actual power of 0.796, alpha error of 0.025, and an expected number of 16.4 patients accrued if the drug under study was uninteresting (i.e. drug
meeting Hnul). Two pairs for the null and alternate
hypothesis forepdare shown.
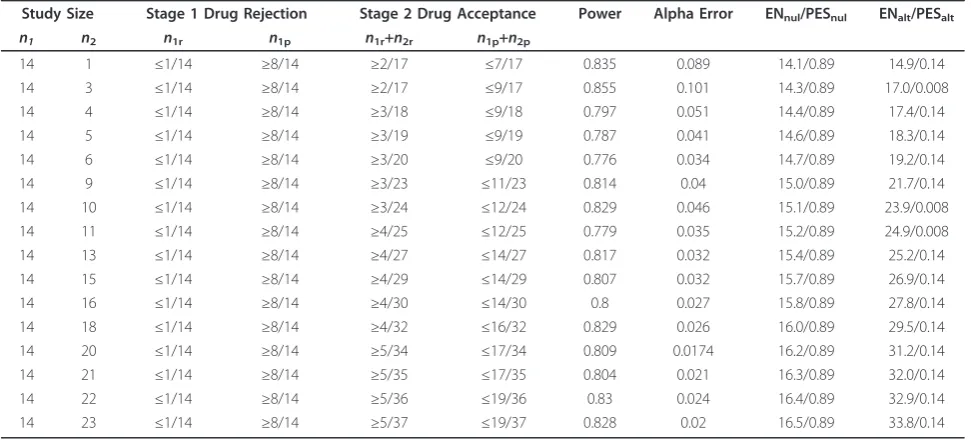
Thresholds for DESR trials sized to match the studies conducted under the rules of Gehan are shown in Tables 2 and 3. Table 2 gives values for epdalt = 0.4,
epdnul = 0.6, while Table 3 gives values forepdalt= 0.3,
epdnul= 0.5.
Comparison with the Stopping Rules of Fleming
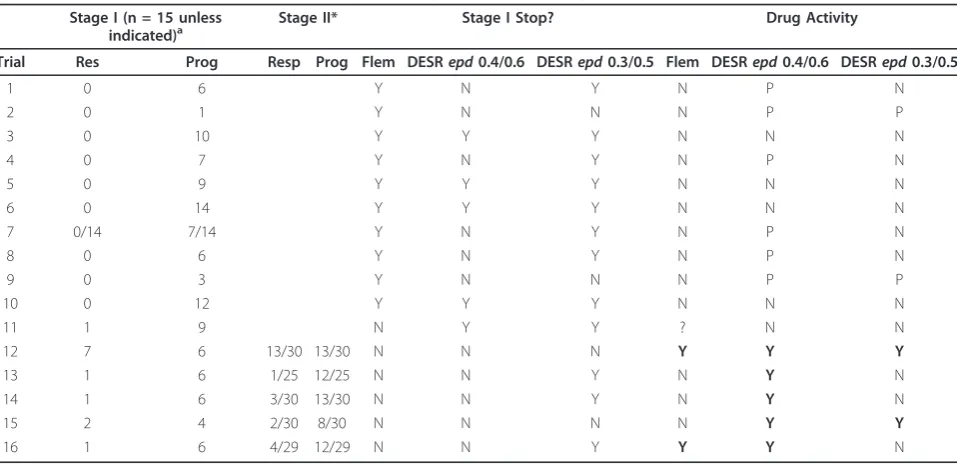
The comparison of the DESR and Fleming stopping rules for first stage stopping and second stage rejection of the null hypothesis is shown in Table 4. The DESR was more permissive at the first stage. For the EPD parametersepdalt= 0.4, epdnul = 0.6, the DESR allowed
6 of the 10 studies stopped by the Fleming rule to con-tinue to the second stage of accrual, all on the basis of an acceptably low EPD rate. Using the EPD parameters
epdalt = 0.3,epdnul= 0.5, the DESR allowed only 2 of
these same 10 studies to continue to the second stage. In all cases where the DESR allowed accrual to the sec-ond stage but the rules of Fleming did not, the final conclusions about activity of the drugs from DESR were unknown since there was no data from the second stage of the trials and we could find no published phase III trial and no U.S. Food and Drug Administration (FDA) indication for the drugs and diseases under study in these phase II trials.
While six studies (Trials 11 through 16) were per-mitted to accrue to the second stage according to the
Fleming rule, one study (Trial 11) was stopped by the investigators and this same study would have been stopped at stage one by the DESR. In the remaining five studies, Hnul was rejected at end of study by the
Fleming rule in two (12 and 16). By comparison, for
the EPD parameters epda lt = 0.4, epdnul = 0.6, the
DESR rejected Hnul in all five trials at the end of stage
II as a result of acceptable rates of EPD. Conversely, for the EPD parameters epdalt = 0.3,epdnul= 0.5, the
DESR stopped three of the five trials at stage I, and rejected Hnulafter stage II in two trials (studies 12 and
15), with one consistent with the conclusion from Fleming rule (Trial 12). The differences again lay in the threshold for epd in the hypotheses under testing, with the EPD parameter set (epdalt = 0.3,epdnul= 0.5)
requiring a lower observed rate of EPD for rejection of
Hnul than the EPD parameter set (epdalt = 0.4,epdnul=
0.6). In all cases where the DESR rejected Hnul but
Fleming did not, we found no phase III trial to confirm or deny drug activity, and no disease-specific FDA indication was found. The same lack of confirmation
was found for study 16 which rejected Hnul by the
Fleming rule but not by the DESR with EPD para-metersepdalt= 0.3, epdnul= 0.5.
Comparison with the Stopping Rules of Gehan
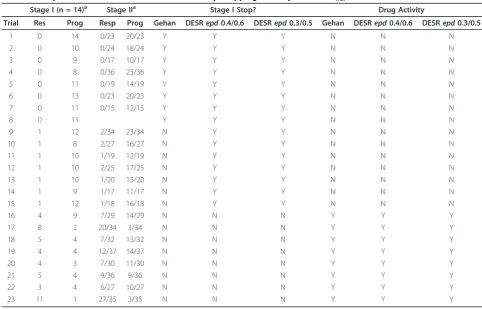
Comparing the DESR rules based on two sets of EPD parameters in the cohort of phase II trials conducted under the Gehan design, the choice of null and alternate values forepddid not alter the likelihood of early stop-ping or rejection of the null hypothesis by the DESR, in part as a result of consistently high rates of EPD in trials 1-15 (see Table 5).
Of the 23 trials conducted using the Gehan stopping rules, eight would have been stopped at stage I for
acceptance of Hnul by both Gehan and the DESR. In
actuality, investigators continued seven of those trials (studies 1-7) through the second stage, although in all cases the studies were ultimately negative.
In the other 15 trials (9 to 23), accrual to the second stage was permitted under the stopping rules of Gehan. Of these, seven trials would have been stopped at the first stage by the DESR as a result of high epdrates in conjunction with only a single responding subject in Table 1 Thresholds by DESR to compare with rules of Fleming (n1= 15, n2= 15, power = 0.8, alpha = 0.05)
Response Early Progression Stage 1 Drug Rejection Stage 2 Drug Acceptance Power Alpha Error ENnul/PESnul ENalt/PESalt ralt rnul epdalt epdnul n1r n1p n1r+n2r n1p+n2p
0.2 0.05 0.4 0.6 ≤1/15 ≥8/15 ≥4/30 ≤14/30 0.796 0.025 16.4/0.90 27.7/0.15
0.2 0.05 0.3 0.5 ≤1/15 ≥6/15 ≥4/30 ≤11/30 0.785 0.025 16.2/0.92 27.4/0.17
ENnul= expected number of patients accrued if a drug meets the criteria of the null hypothesis.
ENalt= expected number of patients accrued if a drug meets the criteria of the alternate hypothesis.
PESnul= probability of stopping the trial after stage I if a drug meets the criteria of the null hypothesis.
each trial, and in all seven of these trials the rules of Gehan found the same results after accrual of the sec-ond stage (i.e., Hnulaccepted). In the final eight trials,
Hnul was rejected after the second stage by both the
Gehan stopping rule and the DESR.
Discussion
The DESR uses the signal provided by the rate of early progressive disease in an attempt to better discern drug effectivess compared with response alone [16]. It has been demonstrated that rules can be generated that Table 2 Thresholds by DESR to compare with the rules of Gehan (ralt= 0.2,rnul= 0.05,epdalt= 0.4,epdnul= 0.6, power = 0.8, alpha = 0.05)
Study Size Stage 1 Drug Rejection Stage 2 Drug Acceptance Power Alpha Error ENnul/PESnul ENalt/PESalt n1 n2 n1r n1p n1r+n2r n1p+n2p
14 1 ≤1/14 ≥8/14 ≥2/17 ≤7/17 0.835 0.089 14.1/0.89 14.9/0.14
14 3 ≤1/14 ≥8/14 ≥2/17 ≤9/17 0.855 0.101 14.3/0.89 17.0/0.008
14 4 ≤1/14 ≥8/14 ≥3/18 ≤9/18 0.797 0.051 14.4/0.89 17.4/0.14
14 5 ≤1/14 ≥8/14 ≥3/19 ≤9/19 0.787 0.041 14.6/0.89 18.3/0.14
14 6 ≤1/14 ≥8/14 ≥3/20 ≤9/20 0.776 0.034 14.7/0.89 19.2/0.14
14 9 ≤1/14 ≥8/14 ≥3/23 ≤11/23 0.814 0.04 15.0/0.89 21.7/0.14
14 10 ≤1/14 ≥8/14 ≥3/24 ≤12/24 0.829 0.046 15.1/0.89 23.9/0.008
14 11 ≤1/14 ≥8/14 ≥4/25 ≤12/25 0.779 0.035 15.2/0.89 24.9/0.008
14 13 ≤1/14 ≥8/14 ≥4/27 ≤14/27 0.817 0.032 15.4/0.89 25.2/0.14
14 15 ≤1/14 ≥8/14 ≥4/29 ≤14/29 0.807 0.032 15.7/0.89 26.9/0.14
14 16 ≤1/14 ≥8/14 ≥4/30 ≤14/30 0.8 0.027 15.8/0.89 27.8/0.14
14 18 ≤1/14 ≥8/14 ≥4/32 ≤16/32 0.829 0.026 16.0/0.89 29.5/0.14
14 20 ≤1/14 ≥8/14 ≥5/34 ≤17/34 0.809 0.0174 16.2/0.89 31.2/0.14
14 21 ≤1/14 ≥8/14 ≥5/35 ≤17/35 0.804 0.021 16.3/0.89 32.0/0.14
14 22 ≤1/14 ≥8/14 ≥5/36 ≤19/36 0.83 0.024 16.4/0.89 32.9/0.14
14 23 ≤1/14 ≥8/14 ≥5/37 ≤19/37 0.828 0.02 16.5/0.89 33.8/0.14
ENnul= expected number of patients accrued if a drug meets the criteria of the null hypothesis.
ENalt= expected number of patients accrued if a drug meets the criteria of the alternate hypothesis.
PESnul= probability of stopping the trial after stage I if a drug meets the criteria of the null hypothesis.
PESalt= probability of stopping the trial after stage I if a drug meets the criteria of the alternate hypothesis.
Table 3 Thresholds by DESR to compare with rules of Gehan (ralt= 0.2,rnul= 0.05,epdalt= 0.3,epdnul= 0.5, power = 0.8, alpha = 0.05)
Study Size Stage 1 Drug Rejection Stage 2 Drug Acceptance Power Alpha Error ENnul/PESnul ENalt/PESalt n1 n2 n1r n1p n1r+n2r n1p+n2p
14 1 ≤1/14 ≥6/14 ≥2/17 ≤5/17 0.811 0.075 14.1/0.91 14.8/0.17
14 3 ≤1/14 ≥6/14 ≥3/17 ≤7/17 0. 773 0.043 14.3/0.91 16.5/0.17
14 4 ≤1/14 ≥6/14 ≥3/18 ≤7/18 0.775 0.038 14.3/0.91 17.3/0.17
14 5 ≤1/14 ≥6/14 ≥3/19 ≤7/19 0.773 0.034 14.4/0.92 18.2/0.17
14 6 ≤1/14 ≥6/14 ≥3/20 ≤7/20 0.769 0.031 14.5/0.91 19.0/0.17
14 9 ≤1/14 ≥6/14 ≥3/23 ≤9/23 0.805 0.038 14.8/0.91 21.5/0.17
14 10 ≤1/14 ≥6/14 ≥4/24 ≤9/24 0.753 0.026 14.9/0.91 22.3/0.17
14 11 ≤1/14 ≥6/14 ≥3/25 ≤9/25 0.797 0.033 14.9/0.91 23.2/0.17
14 13 ≤1/14 ≥6/14 ≥4/27 ≤11/27 0.791 0.023 15.1/0.91 24.8/0.17
14 15 ≤1/14 ≥6/14 ≥4/29 ≤11/29 0.789 0.024 15.3/0.91 26.5/0.17
14 16 ≤1/14 ≥6/14 ≥4/30 ≤11/30 0.787 0.028 15.4/0.91 27.3/0.17
14 18 ≤1/14 ≥6/14 ≥4/32 ≤13/32 0.811 0.023 15.5/0.91 29.0/0.17
14 20 ≤1/14 ≥6/14 ≥5/34 ≤13/34 0.781 0.015 15.7/0.91 30.7/0.17
14 21 ≤1/14 ≥6/14 ≥5/35 ≤13/35 0.779 0.013 15.8/0.91 31.5/0.17
14 22 ≤1/14 ≥6/14 ≥5/36 ≤15/36 0.803 0.016 15.9/0.91 32.3/0.17
14 23 ≤1/14 ≥6/14 ≥5/37 ≤15/37 0.804 0.014 16.0/0.91 33.2/0.17
ENnul= expected number of patients accrued if a drug meets the criteria of the null hypothesis.
ENalt= expected number of patients accrued if a drug meets the criteria of the alternate hypothesis.
PESnul= probability of stopping the trial after stage I if a drug meets the criteria of the null hypothesis.
meet the specified alpha error rate and power; this study assesses the relevance of the DESR when applied to actual patient data from phase II clinical trials [17].
Compared with the stopping rules of Fleming, the DESR was more likely to allow accrual of the second stage. This was more common with the rules specifying
epdnul= 0.6 than epdnul= 0.5, as a higher EPD rate was
tolerated without early drug rejection in the former case. At the second stage, the DESR with design para-metersepdalt= 0.4,epdnul = 0.6 rejectedHnulmore
fre-quently than either the Fleming stopping rules or the DESR with parametersepdalt= 0.3, epdnul= 0.5.
A somewhat different result was seen when comparing the DESR and the stopping rules of Gehan. In this instance, 15 studies were stopped at the first stage by
the DESR (using both epd design parameter pairs),
while only 8 were stopped by Gehan at the first stage, with high rates of EPD triggering the more frequent early stopping by the DESR. The discrepant seven stu-dies ultimately acceptedHnul at the end of the second
stage under Gehan stopping rules. For the remaining eight studies allowed to continue to the second stage by the Gehan stopping rules and the DESR, conclusions on
Hnulwere consistent between the rules.
The DESR is designed to find drugs that have either a desirable rate of response or a desirably low level of early progression. However, because it is designed to
find the ‘good’drugs among a mixed (50/50) population of drugs having either good response or early progres-sion rates, it appears to require a higher response rate at the end of stage one to allow recruitment of stage two than that required if response is considered in isolation. For this reason, compared with the Gehan stopping rule, the DESR was more likely to stop trials after the first stage of accrual despite a single response being observed in stage I. Conversely, as noted above, the DESR was less likely than the Fleming rules to stop a study at stage I despite a lack of any response, as EPD rates were low enough that the drugs under study might have met the specified level for an interesting agent.
For trials in which response is the clear priority, a set of rules devoted to response only may be more appro-priate. However, in the present age of molecularly tar-geted anti-cancer agents, the likelihood of an investigational agent inducing tumour shrinkage or pre-venting tumour growth is often unclear prior to initiat-ing phase II studies.
In the absence of suitable rules, examples are readily found of investigators setting a primary endpoint of response, a drug failing to meet that response, but the drug being declared interesting for further study based on other desirable characteristics [18,19]
Other authors have investigated the use of multiple endpoints in phase II trials. Zeeet algenerated a set of Table 4 Comparison of the DESR and Fleming for Early Stopping and Rejection ofHnul
Stage I (n = 15 unless indicated)a
Stage II* Stage I Stop? Drug Activity
Trial Res Prog Resp Prog Flem DESRepd0.4/0.6 DESRepd0.3/0.5 Flem DESRepd0.4/0.6 DESRepd0.3/0.5
1 0 6 Y N Y N P N
2 0 1 Y N N N P P
3 0 10 Y Y Y N N N
4 0 7 Y N Y N P N
5 0 9 Y Y Y N N N
6 0 14 Y Y Y N N N
7 0/14 7/14 Y N Y N P N
8 0 6 Y N Y N P N
9 0 3 Y N N N P P
10 0 12 Y Y Y N N N
11 1 9 N Y Y ? N N
12 7 6 13/30 13/30 N N N Y Y Y
13 1 6 1/25 12/25 N N Y N Y N
14 1 6 3/30 13/30 N N Y N Y N
15 2 4 2/30 8/30 N N N N Y Y
16 1 6 4/29 12/29 N N Y Y Y N
a
Actual trial results.
DESRepd0.4/0.6 = Dual Endpoint Stopping Ruleepdalt= 0.4,epdnul= 0.6.
DESRepd0.3/0.5 = Dual Endpoint Stopping Ruleepdalt= 0.3,epdnul= 0.5.
Flem = result according to rules of Fleming. Prog = Progression.
stopping rules similar to the DESR, but later found that the rules generated had poorer power than intended [14,15]. However, results for the comparisons between DESR and the stopping rules of Zee with Gehan’s stop-ping rules were very similar in the same data set [17]. Although only the design parameter pair epdalt= 0.4,
epdnul= 0.6 was considered in the paper which applied
their rules [17], both the DESR and the stopping rules of
Zeeet alstop the first 15 trials at stage I and rejectHnul
after stage II in the remaining trials, with high EPD rates being the common reason for early stopping. Conversely, considering drugs studied under the Fleming stopping rules, the DESR was less likely to acceptHnulat the end
of stage I, and so to recruit to stage II. The conclusions at the end of stage II were more difficult to compare, as many of the actual trials did not recruit to the second stage. While the DESR remained more likely to reject
Hnulfor the design parameter pairepdalt= 0.4,epdnul=
0.6, it may have been less likely to rejectHnulwith the
pairepdalt= 0.3,epdnul= 0.5, suggesting the sensitivity of
the results to changes in the design EPD parameters.
In an analogous paper, Panageaset al consider a rule set where response is divided into complete and partial response, and levels of interest and disinterest are again specified for the null and alternate hypothesis [20]. This rule set is potentially attractive for highly responsive cancers such as germ cell tumours, where complete responses are more frequent. However, it may be less applicable in the setting of most phase II trials involving previously treated malignancies and targeted drugs with uncertain tumour effects. In this setting, complete responses may be infrequent, and modest response rates or non-progression may suggest drug activity and lead to drug approval [8]. A slight modification to this design can be made which substitutes response and stable dis-ease for complete response and partial response, similar to the DESR design. However, the study power calcu-lated when using the Panageas design may actually be overestimated, thus underestimating the number of patients needed. This is because power is calculated assuming raltandepdaltare simultaneously at the exact
minimum response rate and maximum early progressive Table 5 Comparison of the DESR and Gehan for Early Stopping and Rejection ofHnul
Stage I (n = 14)a Stage IIa Stage I Stop? Drug Activity
Trial Res Prog Resp Prog Gehan DESRepd0.4/0.6 DESRepd0.3/0.5 Gehan DESRepd0.4/0.6 DESRepd0.3/0.5
1 0 14 0/23 20/23 Y Y Y N N N
2 0 10 0/24 18/24 Y Y Y N N N
3 0 9 0/17 10/17 Y Y Y N N N
4 0 8 0/36 23/36 Y Y Y N N N
5 0 11 0/19 14/19 Y Y Y N N N
6 0 13 0/23 20/23 Y Y Y N N N
7 0 11 0/15 12/15 Y Y Y N N N
8 0 11 Y Y Y N N N
9 1 12 2/34 23/34 N Y Y N N N
10 1 8 2/27 16/27 N Y Y N N N
11 1 10 1/19 12/19 N Y Y N N N
12 1 10 2/25 17/25 N Y Y N N N
13 1 10 1/20 15/20 N Y Y N N N
14 1 9 1/17 11/17 N Y Y N N N
15 1 12 1/18 16/18 N Y Y N N N
16 4 9 7/29 14/29 N N N Y Y Y
17 8 2 20/34 3/34 N N N Y Y Y
18 5 4 7/32 13/32 N N N Y Y Y
19 4 4 12/37 14/37 N N N Y Y Y
20 4 3 7/30 11/30 N N N Y Y Y
21 5 4 9/36 9/36 N N N Y Y Y
22 3 4 6/27 10/27 N N N Y Y Y
23 11 1 27/35 3/35 N N N Y Y Y
a
Actual trial results.
DESRepd0.4/0.6 = Dual Endpoint Stopping Ruleepdalt= 0.4,epdnul= 0.6.
DESRepd0.3/0.5 = Dual Endpoint Stopping Ruleepdalt= 0.3,epdnul= 0.5.
disease rate of interest for further study for the novel agent. The DESR design using the borderline method variesralt andepdaltwhile maintaining power. Both
end-points do not have to be simultaneously at the boundary of interest, potentially giving a more accurate estimate of statistical power.
One limitation to the present study is that it applies arbitraryepdaltandepdnul pairs to existing data.
Indivi-dualizedepdrates may be more relevant to a given drug and give different results, although the pairs chosen were felt to be commonly plausible. Additionally, although the results presented are only for trials in
which the Hnul for response rate is 0.05, the DESR
method can be implemented for trials with higher null response rates. This comparison was not performed due to a critical lack of published phase II trials which pre-sent response and EPD rates at both stage I and II. It is also unknown whether actual efficacy might have been seen when the DESR rejectedHnulbut the Fleming rule
did not, as subsequent phase III studies were not conducted.
Conclusion
In conclusion, while the number of trials in our study is small, different patterns of early stopping and final rejec-tion ofHnulare evident with the addition of EPD as an
endpoint. With limited follow-up in terms of phase III studies, the final benefit in terms of drug development is not certain. However, the DESR may shorten studies where response rates are low but high EPD rates suggest the ultimate efficacy will be poor. Conversely, the DESR will allow accrual to the second stage in the absence of response when there are few patients with EPD, and this may allow more sensitive detection of drug activity. Based on the comparisons in this paper, theepdalt= 0.3,
epdnul= 0.5 pair appears to offer the better balance of
these outcomes, but the design parameters for a particu-lar trial should be individualized.
Acknowledgements No funding source.
Author details
1McMaster University, Juravinski Cancer Centre, 699 Concession St., Hamilton,
Ontario, L8V 5C2, Canada.2McMaster University, Ontario Clinical Oncology Group (OCOG), Juravinski Hospital G(60) Wing. 1st Floor, 711 Concession Street, Hamilton, Ontario, L8V 1C3, Canada.3Dongsheng Tu, NCIC Clinical Trials Group, Queen’s University, 10 Stuart Street, Kingston, Ontario, K7L 3N6, Canada.
Authors’contributions
JRG designed the study, programmed simulations, analyzed data, and drafted the manuscript. GRP designed the study, analyzed data, and drafted the manuscript. DT designed the study, analyzed data, and drafted the manuscript. All authors read and approved the final manuscript.
Competing interests
The authors declare that they have no competing interests.
Received: 5 November 2010 Accepted: 21 June 2011 Published: 21 June 2011
References
1. DiMasi JA, Hansen RW, Grabowski HG:The price of innovation: new estimates of drug development costs.J Health Econ2003,22:151-185. 2. Booth B, Glassman R, Ma P:Oncology’s trials.Nat Rev Drug Discov2003,
2:609-610.
3. DiMasi JA, Grabowski HG:Economics of new oncology drug development.J Clin Oncol2007,25:209-216.
4. Dhani N, Tu D, Sargent DJ, Seymour L, Moore MJ:Alternate endpoints for screening phase II studies.Clin Cancer Res2009,15:1873-1882. 5. Gehan EA:The determination of the number of patients required in a
preliminary and a follow-up trial of a new chemotherapeutic agent.J Chronic Dis1961,13:346-353.
6. Fleming TR:One-sample multiple testing procedure for phase II clinical trials.Biometrics1982,38:143-151.
7. Simon R:Optimal two-stage designs for phase II clinical trials.Control Clin Trials1989,10:1-10.
8. El-Maraghi RH, Eisenhauer EA:Review of phase II trial designs used in studies of molecular targeted agents: outcomes and predictors of success in phase III.J Clin Oncol2008,26:1346-1354.
9. Thezenas S, Duffour J, Culine S, Kramar A:Five-year change in statistical designs of phase II trials published in leading cancer journals.Eur J Cancer2004,40:1244-1249.
10. Cesano A, Lane SR, Poulin R, Ross G, Fields SZ:Stabilization of disease as a useful predictor of survival following second-line chemotherapy in small cell lung cancer and ovarian cancer patients.Int J Oncol1999,
15:1233-1238.
11. Rapp E, Pater JL, Willan A, Cormier Y, Murray N, Evans WK, Hodson DI, Clark DA, Feld R, Arnold AM,et al:Chemotherapy can prolong survival in patients with advanced non-small-cell lung cancer–report of a Canadian multicenter randomized trial.J Clin Oncol1988,6:633-641.
12. Sekine I, Tamura T, Kunitoh H, Kubota K, Shinkai T, Kamiya Y, Saijo N:
Progressive disease rate as a surrogate endpoint of phase II trials for non-small-cell lung cancer.Ann Oncol1999,10:731-733.
13. Lara PN Jr, Redman MW, Kelly K, Edelman MJ, Williamson SK, Crowley JJ, Gandara DR:Disease control rate at 8 weeks predicts clinical benefit in advanced non-small-cell lung cancer: results from Southwest Oncology Group randomized trials.J Clin Oncol2008,26:463-467.
14. Zee B, Melnychuk D, Dancey J, Eisenhauer E:Multinomial phase II cancer trials incorporating response and early progression.J Biopharm Stat1999,
9:351-363.
15. Freidlin B, Dancey J, Korn EL, Zee B, Eisenhauer E:Multinomial phase II trial designs.J Clin Oncol2002,20:599.
16. Goffin JR, Tu D:Phase II stopping rules that employ response rates and early progression.J Clin Oncol2008,26:3715-3720.
17. Dent S, Zee B, Dancey J, Hanauske A, Wanders J, Eisenhauer E:Application of a new multinomial phase II stopping rule using response and early progression.J Clin Oncol2001,19:785-791.
18. Gallagher DJ, Milowsky MI, Gerst SR, Ishill N, Riches J, Regazzi A, Boyle MG, Trout A, Flaherty AM, Bajorin DF:Phase II Study of Sunitinib in Patients With Metastatic Urothelial Cancer.Journal of Clinical Oncology2010,
28:1373-1379.
19. Schiller JH, Larson T, Ou SH, Limentani S, Sandler A, Vokes E, Kim S, Liau K, Bycott P, Olszanski AJ,et al:Efficacy and safety of axitinib in patients with advanced non-small-cell lung cancer: results from a phase II study.J Clin Oncol2009,27:3836-3841.
20. Panageas KS, Smith A, Gonen M, Chapman PB:An optimal two-stage phase II design utilizing complete and partial response information separately.Control Clin Trials2002,23:367-379.
Pre-publication history
The pre-publication history for this paper can be accessed here: http://www.biomedcentral.com/1471-2288/11/95/prepub
doi:10.1186/1471-2288-11-95
Cite this article as:Goffinet al.:A comparison of a new multinomial