Volume 3, Issue 2, 2016
41 Available online at www.ijiere.com
International Journal of Innovative and Emerging
Research in Engineering
e-ISSN: 2394 - 3343 p-ISSN: 2394 - 5494
Measurement of Raindrop Parameters using Image Processing
Pallavi Bacche
a, Savita Basantani
a, Pranav Deshpande
a, Jayashri Joshi
aand Rohini Bhalwankar
b a Savitribai Phule Pune University,Pimpri Chinchwad College Of Engineering, Nigdi, Pune, Indiab Indian Institute of tropical meteorology, Pashan, Pune, India
ABSTRACT:
This paper deals with simple algorithms for detection of various parameters of a raindrop. Digital imaging of raindrops with high speed camera is essentially required which provides detail information of raindrop shape. Thus, analysis of these large number of images and the accuracy of the measured drop size depends critically on the characteristics of the digital image processing algorithm used to determine the drop size. The study of shape and oscillation of raindrops is crucial to understand the warm rain process i.e. the growth of rain by collision-coalescence and breakup processes in clouds. In the present study, images of the water drops of equivalent diameter from 2.5 to 7.5 mm captured using a high speed camera will be analyzed with a digital image processing method. This analysis will help in determining of the time-averaged raindrop shape and its oscillations which are the main microphysical parameters for the estimation of rainfall rate.
Keywords: image processing, thresholding, opening operation, histogram, oscillation frequency
I. INTRODUCTION
The rain is critical not only to weather, but to life on earth. Rain is necessary for the survival of plants and humans. The need to measure this rainfall because prolonged or heavy rainfall is often the main cause of debris flows and flash floods in rivers and urban areas, and can be a key factor for dam breaks and other types of flash flood. Optical imaging of raindrops provides important information on the statistical distribution of raindrop size and raindrop shape. These distributions are critical for extracting rainfall rates from both dual- and single-polarization radar signals. A large number of raindrop images are required to obtain these statistics, necessitating automatic processing of the imagery. The accuracy of the measured drop size depends critically on the characteristics of the digital image processing algorithm. In the traditional method of rainfall measurement a rain gauge is used to determine the rainfall in mm. But some of the raindrops stick to the funnel used in rain gauge which leads to an error of approximately 0.25mm which can be overcome in the proposed system since it deals with capturing the images of raindrops.
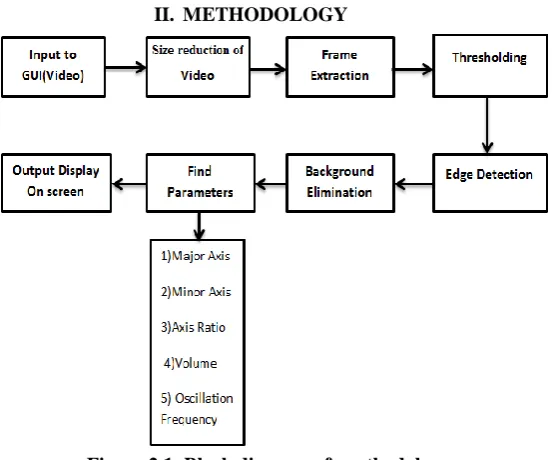
II. METHODOLOGY
Figure 2.1: Block diagram of methodology
Figure shows the block diagram of MRPUIP systems. There are different operations done on image/video to get results.
Volume 3, Issue 2, 2016
42 HD video captured from high speed camera has 1000 frames in 1sec, so it takes large amount of time for processing. So the size of video needs to be reduced. Using motion vector the movement of the object between two consecutive frames can be determined. If the value of motion vector is zero, then one out of the two frames can be discarded. The video captured from HD camera has rate of 1000 fps therefore to reduce the frame count approach of motion vector is used. In this the centroid of the drop in X,Y direction is calculated. The difference between centroid of previous frame and centroid of the present frame is called as the motion vector. The motion vector for consecutive frames is calculated. If the motion vector is zero then that particular frame is discarded.
Present_centroid_x=centX Present_centroid_y=centY
Previous_cent_x=prevX=0 (Initialised to 0) Previous_cent_y=prevY=0 (Initialised to 0) Motion vector=MV
MV =(abs (centX-prevX)>m)|(abs(centY - prevY)>n)
B. Frame extraction
In the present database(video) there is only a single raindrop, therefore the frames for which the number of blobs obtained is more than one can be discarded & others can be taken for further processing. frames are selected as per the conditions applied to area, major axis & minor axis.
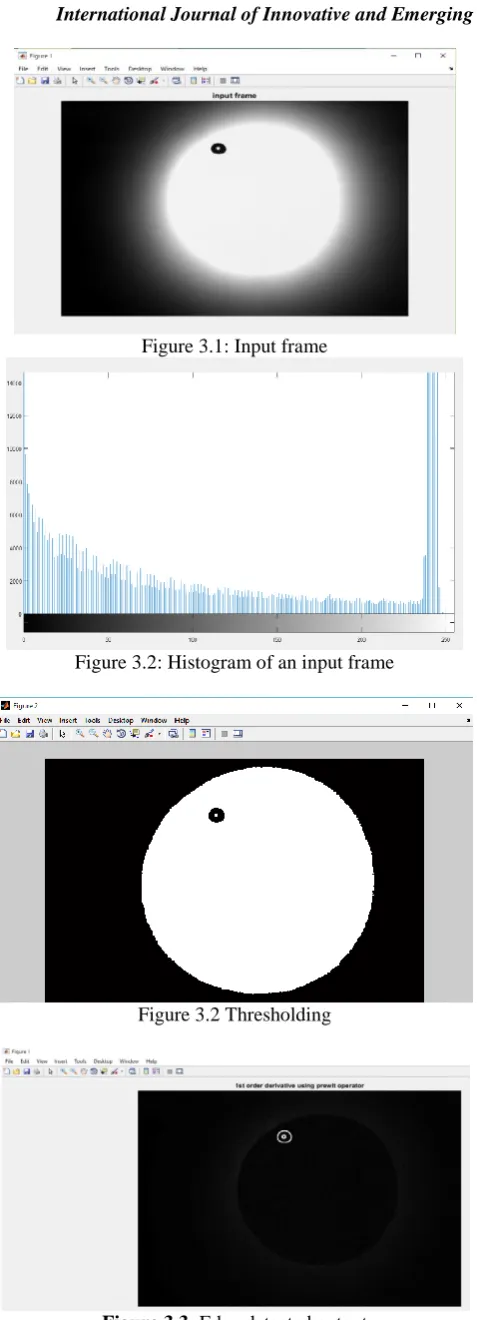
C. Thresholding
Extracted frame is a gray scale image so to convert it into a binary image thresholding needs to be applied. To distinguish between object & background thresholding is applied. Suppose that the gray-level histogram corresponds to an image, f(x,y), composed of light objects in a dark background, in such a way that object and background pixels have gray levels grouped into two dominant modes. One obvious way to extract the objects from the background is to select a threshold ‘T’ that separates these modes. Then any point (x,y) for which f(x,y) > T is called an object point, otherwise, the point is called a background point. Binarization is the process of converting a gray-scale image to a binary image by using threshold selection techniques to categorize the pixels of an image into either one of the two classes. There are two main techniques of binarization and they are global thresholding and local adaptive thresholding techniques. Threshold value can be found out using histogram technique. Histogram is plot of gray scale value against number of occurrence of particular gray scale.
1). Global Thresholding Techniques:
Global thresholding techniques attempt to find a suitable single threshold value (Thr) from the overall image. The pixels are separated into two classes: the foreground (text which is white color) and the background (black color). This can be expressed as follows
Ib(x,y) = black if If(x,y)≤Thr White if If(x,y)>Thr
where If(x,y) is the pixel of the input image and Ib(x,y) is the pixel of the binarized image.
2).Thresholding point T using histogram method:
An Image Histogram is a type of histogram that acts as a graphical representation of the lightness/color distribution in a digital image. It plots the number of pixels for each value. The histogram of a digital image with gray levels in the range [0, L-1] is a discrete function h(rk) = nk, where rk is the kth gray level and nk is the number of pixels in the image having gray level rk.
h = imhist (I, b)
Where I, is the input image, h is the histogram, b is number of bins (tick marks) used in forming the histogram (b = 255 is the default). The valley point in the histogram is considered as threshold value.[7]
D.Edge detection
For measurement of raindrop parameters like major & minor axis edge of the object needs to be detected. : Edges characterize boundaries and are therefore a problem of fundamental importance in image processing. Image Edge detection significantly reduces the amount of data and filters out useless information, while preserving the important structural properties in an image.
Prewitt Operator:
The operator consists of a pair of 3×3 convolution kernels. One kernel is simply the other rotated by 90°.
Gx = Gy = -1 0 +1
-1 0 +1
-1 0 +1
-1 -1 -1
0 0 0
Volume 3, Issue 2, 2016
43 These kernels are designed to respond maximally to edges running vertically and horizontally relative to the pixel grid, one kernel for each of the two perpendicular orientations. The kernels can be applied separately to the input image, to produce separate measurements of the gradient component in each orientation (call these Gx and Gy). These can then be combined together to find the absolute magnitude of the gradient at each point and the orientation of that gradient. The gradient magnitude is given by:
G = √Gx2+ Gy2
Typically, an approximate magnitude is computed using:
|G |=| Gx|+ |Gy|
which is much faster to compute.[8]
E.Background elimination:
In this case background doesn’t contain any information, so the background can be eliminated. M=size(binFrame,1);
N=size(binFrame,2); imArea=M*N; F.Opening operation:
In mathematical morphology, opening is the dilation of the erosion of a set A by a structuring element B:
where and denote erosion and dilation, respectively.
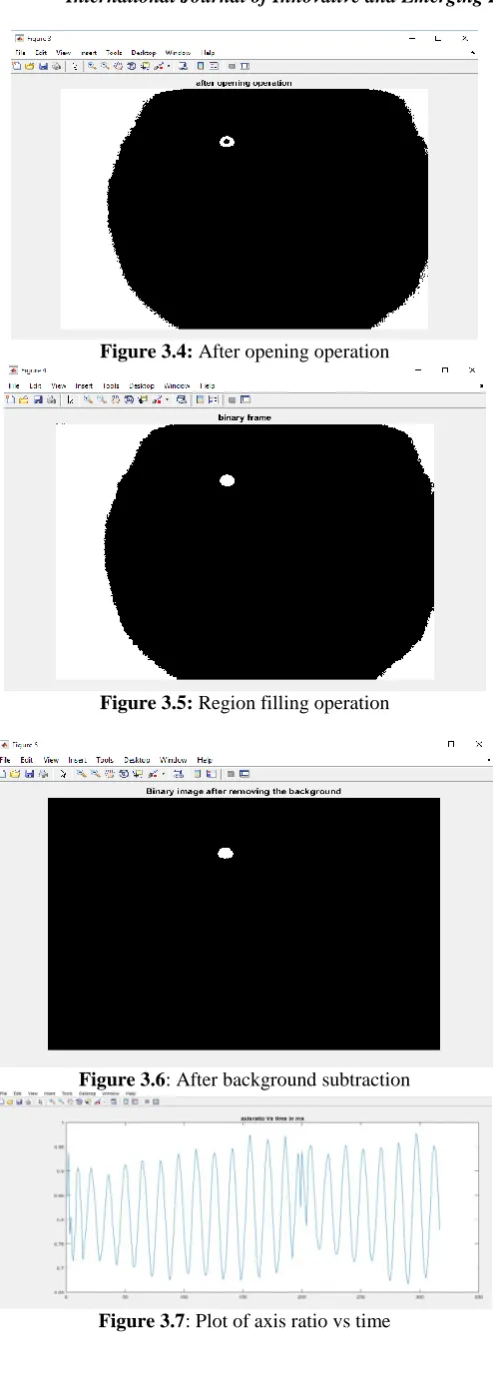
Together with closing, the opening serves in computer vision and image processing as a basic workhorse of morphological noise removal. Opening removes small objects from the foreground (usually taken as the dark pixels) of an image, placing them in the background, while closing removes small holes in the foreground, changing small islands of background into foreground. These techniques can also be used to find specific shapes in an image. Opening can be used to find things into which a specific structuring element can fit (edges, corners).[8]
G.Region filling:
In the experimental setup, light source is present behind the drop so as to capture clear images of the drop but as a result, the drop acts as a lens and concentrates the light at the center while the images are captured therefore a white spot appears in the final image of the drop. To eliminate this spot the region filling operation is performed.
H.Axis ratio:
The rain drop practically has elliptical shape, it has minor & major axis. Axis ratio is ratio of minor axis of rain drop to major axis. Major & minor axis can be found out using image processing methods in matlab. Value of axis ratio is different according to the radius & size of raindrop. Axis ratio decreases with the increase in size of raindrop. Axis ratio= (Minor axis / Major axis)
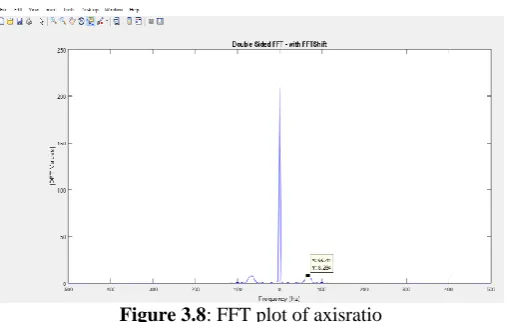
I.Oscillation frequency:
Oscillation frequency is the most important parameter, which can give the rainfall distribution. It is the plot of axis ratio with respect to time. Oscillation frequency can be found out using fft of axis ratio ploted against time.
X=fftshift(fft(Axis_ratio,NFFT)); where NFFT is N point FFT.
Oscillation frequency can be calculated using theoretical method called Rayleigh’s formula.
1/2 F = 2σ
π2ρWa0
ρw= density of water
σ =surface tension of water (72.75 dyne/cm2) ao=radius of water drop in cm
Volume 3, Issue 2, 2016
44 Figure 3.1: Input frame
Figure 3.2: Histogram of an input frame
Figure 3.2 Thresholding
Volume 3, Issue 2, 2016
45
Figure 3.4: After opening operation
Figure 3.5: Region filling operation
Figure 3.6: After background subtraction
Volume 3, Issue 2, 2016
46
Figure 3.8: FFT plot of axisratio
IV.IMPLEMENTATION
A. Software Requirements
Platform: Windows 7 service pack 1,windows 8/8.1 and Windows 10 Programming Language: MATLAB Version 7.9.0.529 (R2015a)
B. Hardware Requirements
Main processor: Any Intel or AMD x86 processor supporting SSE2 instruction set
RAM: 2 GB
Disk Space:1GB for MATLAB only, 3–4 GB for a typical installation
V. CONCLUSION
In MRPUIP parameters of raindrop like major ,minor axis,oscillation frequency are found out using image processing. This system has advantage over rain gauge and other measuring instruments also the error due to very less human interference. The costing of this system is very low.
REFERENCES
[1] Miklo ´ S Szaka ´ Ll,Karoline Diehl, And Subir K. Mitra „A Wind Tunnel Study on the Shape, Oscillation, and Internal Circulation of Large Raindrops with Sizes between 2.5 and 7.5 mm‟, March 2009
[2] K. V. Beard, “Oscillation models for predicting raindrop axis and backscatter ratios,” Radio Sci. 19, 67–74 (1984).
[3] A. K. Kamra, Rohini V. Bhalwankar, and A. B. Sathe „A. K. Kamra, Rohini V. Bhalwankar, and A. B. Sathe,Spontaneous breakup of charged and uncharged water drops freely suspended in a wind tunnel’ , Journal Of Geophysical Research, Vol. 96, No. D9, September 20, 1993
[4] A. K. Kamra, Rohini V. Bhalwankar, and A. B. Sathe‟the Onset Of Disintegration And Corona In Water Drops Falling At Terminal Velocity In Horizontal Electric Fields‟, Journal Of Geophysical Research, July 20, 1993
[5] R. V. Bhalwankar and A. K. Kamra ‟ A wind tunnel investigation of the deformation of water drops in the vertical and horizontal electric fields‟, Journal Of Geophysical Research, Vol. 112, D10215, Doi:10.1029/2006jd007863, 2007 .
[6] J. R. Saylor and N. A. Sivasubramanian „Edge detection methods applied to the analysis of spherical raindrop images‟ , Received 8 December 2006; revised 25 April 2007; accepted 30 April 2007; posted 14 May 2007 (Doc. ID 77911); published 23 July 2007.
[7] Sameer Sawant, P.A.Ghonge „Estimation of Rain Drop Analysis Using Image Processing‟ , Volume 4 Issue 1, January 2015.