78
Detection of Error & Life Prediction of Corrode Metal Plate using Ultrasonic
Inspection Technique
Sheetal Kumar Dewangan
**
Assistant professor, Department of Mechanical Engineering, CCET Bhilai, India,
[email protected]
Abstract
This paper summarizes some of the major aspects of precision ultrasonic thickness gauging. Ultrasonic non-destructive testing (NDT) characterizing material thickness, integrity, or other physical properties by means of high-frequency sound waves has become a widely used technique for quality control. In thickness gauging, ultrasonic techniques permit quick and reliable measurement of thickness without requiring access to both sides of a part.
Corrosion is one of the serious problem affecting ship, pipe line and aviation industries. It affects the body of ship and thickness of pipe and an Aeroplane wings, surface, between joints and fasteners. The presences of corrosion underneath the paints of surface and between joints are not easy to be detected. The unnoticed presence of corrosion may cause many accidents, leads to the human and money loses. To detect the thickness of the metal surface, various methods and tests are used. These tests conducted should be such that it does not destroy or disassemble the equipment to parts or damage its surface Hence for the further use of the equipment, Non-destructive tests (NDT) are carried out. In the field of NDT industry one of the most important method to detect the thickness of component is the ultrasonic thickness measurement. The change in the thickness of any plate with respect to the time is also helpful for determining the corrosion rate and prediction of remaining life of corrode plate as well as prediction for the measurement error due to corrosion of any steel plate.
Index Terms:
NDT, UT, Corrosion
1.
INTRODUCTION
Mild Steel is one of the major construction materials used in the industries. This paper focuses on the experimental study of the corrosion behaviour and mechanism for mild steel in three different media namely: 0.1M of Hydrochloric acid, Atmosphere, Salt water (Nacl). Mild steel of length 12 cm and 10 cm width and 6 mm thick was used for this experiment and studied for a period of one year interval of each three month weighing and re-immersing. The weight losses were tabulated and analyzed graphically. Any suitable NDE technique, such as ultrasonic may be used as long as it will provide minimum thickness determinations. To detect the thickness of the metal surface, various methods and tests are used. These tests conducted should be such that it does not destroy or disassemble the equipment to parts or damage its surface. Hence for the further use of the equipment, Non-destructive tests (NDT) are carried out.
The another and The simplest, and longest-established, method of estimating corrosion losses in plant and equipment is weight loss analysis. A weighed sample (coupon) of the metal or alloy under consideration is introduced into the process, and later removed after a reasonable time interval. The coupon
is then cleaned of all corrosion product and is reweighed. The weight loss for each three month was obtained using the weighing balance and the difference in weigh for each of the week was then calculated that is the difference between the weight of each plate before and after each week of the immersion of the sample in the different environments.
1.1
NON-DESTRUCTIVE TESTS
Paragraph content goes here. Paragraph content goes here. Non-destructive testing as the name suggests is testing procedure without any damage to the part being tested. The various non-destructive testing methods used are:
1. Visual inspection 2. X-ray inspection
79
2. EXPERIMENTAL WORK
2.1 Experimental Set Up Used In Thickness Measurement Operation
Equipments used to perform ultrasonic thickness measurement is shown
Table no 2.1: List of Equipment and material used for thickness Measurement Operation
S/NO Equipment/ Material used
1 Power hacksaw
2 Ultrasonic thickness Gauge
3 Single Element Transducer/ 2.25MHz Probe 4 Calibration Block
5 Micrometer/Vernier caliper 6 Couplent/Gel
7 Corroded plate(specimen)
3. EXPERIMENTAL PROCEDURE
Preparation of specimen of
Mild steel Plate
Specimen A
(on open environment
)
Specimen B
(on NaCl solution)
Specimen C
(on HCL environment)
Ultrasonic Thickness
Measurement
Test
Result and Conclusion
Finish
Ultrasonic Thickness
Measurement
Test
Collection of observation & Prediction for remaining life of plate
Ultrasonic Thickness
Measurement
Test
Grinding
(For Remove corrosion layer)
Grinding
(For Remove corrosion layer)
80
3.1 Error detection
Measurement Error of the thickness gauge will continuously increases with respect to period of corrosion. Therefore it is advice to consider probability of detection first. The highest degree of measurement accuracy on detected pits is of little consolation if the deepest pit has not been detected.as per previous research that the probability of detection depends on the Scanning technique.[3]
Two quite different approaches are common use, spot readings on a defined grid pattern and area scanning on an overlapping raster pattern. Clearly the grid
pattern .Technique is suitable for erosion monitoring if suitable grid spacing is chosen. From the Reflectivity of erosion author can suppose that both Digital Thickness Meters (DTM's) would be suitable for this application. The DTM is simpler to use and may have some advantages in the hands of less experienced Operators. However the grid pattern technique is just as clearly not suitable for isolated Pitting of either lake or cone type, So if author want to detect pitting type corrosion, author must use an area scanning technique. Nevertheless, I still see operators taking 12 random readings on plate 10 metres by 2 metres observation given in table 3.1
Table-3.1: Thickness of Specimen B before & after grinding with different time period
Actual thickness (in mm)
Specimen B (before grinding)
Specimen B (after grinding)
Difference (error)
% error
Average % error
6.11
0.13
3 month
6.43 5.55 0.88 0.14
6.47 5.34 1.13 0.17
6.58 5.33 1.25 0.19
5.88 5.61 0.27 0.05
6.5 5.13 1.37 0.21
6 month
6.56 5.33 1.23 0.19
0.19
6.66 5.3 1.36 0.20
6.45 5.25 1.2 0.19
6.34 5.29 1.05 0.17
6.58 5.11 1.47 0.22
9 month
6.6 5.22 1.38 0.21
0.21
6.66 5.27 1.39 0.21
6.59 5.21 1.38 0.21
6.45 5.24 1.21 0.19
6.62 5.07 1.55 0.23
12 month
6.66 5.18 1.48 0.22
0.22
6.81 5.21 1.6 0.23
N/A 5.11 N/A N/A
6.35 5.16 1.19 0.19
81
Table-3.2: Thickness of Specimen C before & after grinding with different time period
Actual Thickness (in mm)
Specimen B (Before Grinding)
Specimen B (After Grinding)
Difference (error)
% error
Average % error
6.17
0.15 3 month
6.51 5.21 1.3 0.20
6.38 5.23 1.15 0.18
6.34 5.5 0.84 0.13
6.37 5.36 1.01 0.16
6.45 5.65 0.8 0.12
6month
6.52 5.12 1.4 0.21
0.17
6.61 5.2 1.41 0.21
6.36 5.32 1.04 0.16
6.24 5.33 0.91 0.15
6.55 5.49 1.06 0.16
9month
6.61 5.11 1.5 0.23
0.19
6.68 5.18 1.5 0.22
6 5.29 0.71 0.12
6.49 5.3 1.19 0.18
6.65 5.44 1.21 0.18
12month
6.67 5.08 1.59 0.24
0.24
6.8 5.11 1.69 0.25
6.66 5.18 1.48 0.22
6.41 5.1 1.31 0.20
6.77 5.34 1.43 0.21
The short-term (ST) corrosion rate was evaluated within one year and was calculated from the following formula:
Where,
t (initial) = The initial thickness at the same Condition Monitoring Location as . It’s either the first thickness measurement at this or thickness at the start of a new corrosion rate environment, in mm.
t(actual) = The actual thickness of a plate, in (mm), measured during the most recent inspection
82
4.1.1 Remaining Life Calculation of plate
The remaining life of the plate (in years) was evaluated from the following formula:
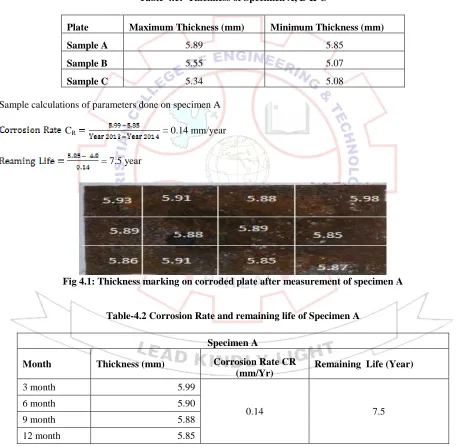
Table-4.1: Thickness of Specimen A, B & C
Plate Maximum Thickness (mm) Minimum Thickness (mm)
Sample A 5.89 5.85
Sample B 5.55 5.07
Sample C 5.34 5.08
Sample calculations of parameters done on specimen A
CR = 0.14 mm/year
= 7.5 year
Fig 4.1: Thickness marking on corroded plate after measurement of specimen A
Table-4.2 Corrosion Rate and remaining life of Specimen A
Specimen A
Month Thickness (mm) Corrosion Rate CR (mm/Yr)
Remaining Life (Year)
3 month 5.99
0.14 7.5
6 month 5.90
9 month 5.88
83
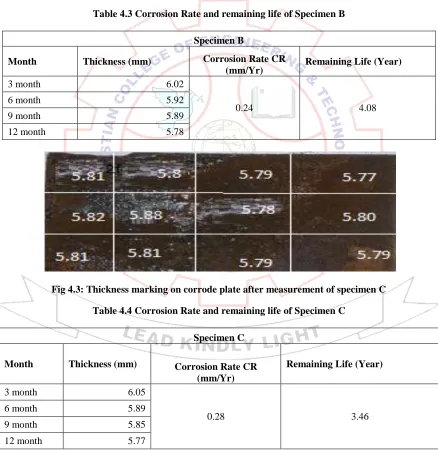
Fig 4.2: Thickness marking on corrode plate after measurement of specimen B
Table 4.3 Corrosion Rate and remaining life of Specimen B
Specimen B
Month Thickness (mm) Corrosion Rate CR (mm/Yr)
Remaining Life (Year)
3 month 6.02
0.24 4.08
6 month 5.92
9 month 5.89
12 month 5.78
Fig 4.3: Thickness marking on corrode plate after measurement of specimen C
Table 4.4 Corrosion Rate and remaining life of Specimen C
Specimen C
Month Thickness (mm) Corrosion Rate CR (mm/Yr)
Remaining Life (Year)
3 month 6.05
0.28 3.46
6 month 5.89
9 month 5.85
84
4.1.2 Discussion
The designated areas on the plates where periodic examinations were conducted to monitor the presence and rate of damage were the plate A, B and C. These CMLs become the critical areas on the plates where failure (localized corrosion and service-specific damage) becomes probable. The corrosion mechanisms of all the inspected plates with exception of sample A are lesser than sample B and C. This implies that, the short term corrosion rate may be relied on in predicting accurately the remaining life of the plates (A, B and C). Plate three had its year on year corrosion rate uniform (the closeness of short-term) hence one can use the short-term corrosion rate of such plate to predict its remaining life. Observation is given in table 4.1,4.2,4.3 and 4.4. The most common method that is used to address corrosion in plates is to specify the corrosion allowance. This allowance is supplemental metal thickness that is added to the minimum thickness that is required to resist the applied loads. This added thickness compensates for thinning (corrosion) that will take place during service. It is of this allowance (added thickness) that helps in predicting the service life of a plate in a particular working or environmental conditions had its minimum wall thickness at CML.
The estimated annual corrosion rates of the inspected plates (1, 3 and 4) are in excess of what is prescribed by the code. These high corrosion rates can be attributed to the aggressive working conditions (situated close to the coastal regions) of the plates.
4.2 Corrosion Rate Determination of Existing plate by Measurement of weight Loss(Method II )
4.2.1 Introduction
The simplest, and longest-established, method of estimating corrosion losses in plant and equipment is weight loss analysis. A weighed sample (coupon) of the metal or alloy under consideration is introduced into the process, and later removed after a reasonable time interval. The coupon is then cleaned of all corrosion product and is reweighed. The weight loss for each three month was obtained using the weighing balance and the difference in weigh for each of the week was then calculated that is the difference between the weight of each plate before and after each week of the immersion of the sample in the different environments. The weight loss is converted to a corrosion rate (CR) or a metal loss (ML), as follows:
Weight loss (g) x K Corrosion Rate (CR) =
Alloy Density (g/cm3) x Exposed Area (A) x Exposure Time (hr)
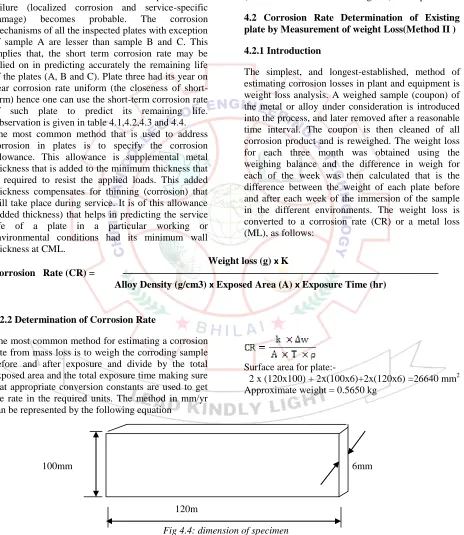
4.2.2 Determination of Corrosion Rate
The most common method for estimating a corrosion rate from mass loss is to weigh the corroding sample before and after exposure and divide by the total exposed area and the total exposure time making sure that appropriate conversion constants are used to get the rate in the required units. The method in mm/yr can be represented by the following equation
Surface area for plate:-
2 x (120x100) + 2x(100x6)+2x(120x6) =26640 mm2 Approximate weight = 0.5650 kg
100mm 6mm
120m
85
𝐶𝑅 = Penetration (corrosion) rate (𝑚𝑚/yr), Δ𝑤 = Weight loss in gram, A = Exposed surface area of plate = 266𝑐𝑚2, 𝜌 = Density of mild steel (𝑔𝑐𝑚3) = 7.86𝑔𝑐𝑚3 , T = Time of exposure in hours, k =
Constant for unit conversion = 8.76 × 10⁴.
4.2.3 Experimental Results and Data Analysis
The weight loss and corrosion rate of metal depend to a large extent on a number of factors. The weight loss and the corrosion rate of the different mild steel samples were calculated and shown in tables 4.5, 4.6 and4.7.
Table 4.5 Remaining weight of plate after each quarter year
Table 4.6 Remaining weight of plate after each quarter year
Medium
Initial weight (in gram)
Remaining Weight (in gram) 3 Month
(2160 hr)
6 month (4320 hr)
9 month (6480 hr)
12 month (8640 hr)
Atmosphere 565 2.5 6.7 7.5 6.8
Nacl 565 10.8 15.6 13 6.5
0.1MHCL 565 12.6 17.2 15.3 15.3
The laboratory corrosion test revolves around the actualization of facts for the perfect selection of materials for specific environments, determination of environments in which materials are especially suitable, corrosion control methods that can be applied and the study of corrosion mechanisms. In this project, three different environments were used;
hydrochloric acid, Nacl (salt solution) and atmosphere. Mild steel plate of the same dimensions were exposed to the corrosive properties of these environments and monitored on quarterly of year basis. The results obtained were then used for this analysis on the rate of corrosion and its effects on mild steel.
Table 4.7 corrosion rate of plates in different condition
Medium
Initial weight (in gram) Metal Loss (in gram) CR (in mm/Yr)
Atmosphere 565 23.5 0.115
Nacl 565 45.1 0.22
0.1MHCL 565 60.4 0.293
4.2.4 Physical Changes Observed on the Coupons during the Experiment
The specimens exhibited different features in terms of colour, texture, surface appearance, type and size of the corrosion products on the metal. The physical
features observed in the different media are discussed.
Medium
Initial weight (in gram)
Remaining Weight (in gram) 3 Month
(2160 hr)
6 month (4320 hr)
9 month (6480 hr)
12 month (8640 hr)
Atmosphere 565 562.5 555.8 548.3 541.5
Nacl 565 554.2 538.6 525.6 519.1
86
I. Nacl (Salt Solution)
By the end of the first week the mild steel rod showed patches of grey and black on its surface. Between the third (3rd) to fourth (4th) week about 50 - 80% of the surface became rough, with a hard brownish corrosion product, which when washed off left the surface with more black patches than the grey patches. Towards the end of the experiment circular bumps were formed on the surface which when washed off exposed circular pits inside. The base of the pits was grey in colour. The remaining surface was black. Generally at the fourth (4th), the water appeared dark yellowish brown with brown particles at the bottom.
II Atmosphere
This also appears to have formed oxide films in the middle of the first month, which reduces the rate of corrosion. The corrosion rate and weight lost were very low , hence decreases as the time increases.
III. Hydrochloric Acid
The mild steel plate coupon showed severe uniform corrosion. At the end of the first (1st) month the mild steel plate had shinny smooth grey surfaces and the 0.1M hydrochloric acid turned to light green, up to the second (2nd) month with grey patches underneath the media. At the end of the third (3rd) month the colour of the 0.1M hydrochloric acid turned to brown yellow up to the end of the fifth (5th) month with heavy brown corrosion patches which settles underneath the media.
4.3 Result Analysis
The results of the experiment obviously show that corrosion occurred, because weight losses were
evident. But interestingly the rate of corrosion for the various specimens varied increasingly in the following trend: 0.1M hydrochloric acid, salt water and atmosphere. The specimen in hydrochloric acid experienced what is considered in engineering literature as chloride aggressiveness. The presence of halide ions breakdown any passive films available and can sometimes prevent passive films from forming on the mild steel plate. The corrosion rate observed for the specimen in the atmosphere was low; this was as a result of the components of the atmosphere, Constant processing of chemicals do not take place in the place where the mild steel plate was kept and so the emissions of various corrosion stimulating gases was reduced from the first three months, the corrosion rate was really slow then became rapid between the third and fourth month, this occurred when the passive films that were formed between the first and third month broke down and thus corrosion commenced, but the weight loss in general was small when compared to the specimens in the rest of the environments. The types of salts present in salt water (salt solution) media were critically not accounted for and the corrosion rate was not too intense. For the fresh water the corrosion was slightly high at the start of the experiment then continued at an approximate constant rate with a small increase at the last month of the experiment, the low amount of ions in the water was responsible for this behaviour since the available oxygen and the medium will form a corrosion cell and initiate the corrosion process until passive films were formed when the rate became constant.
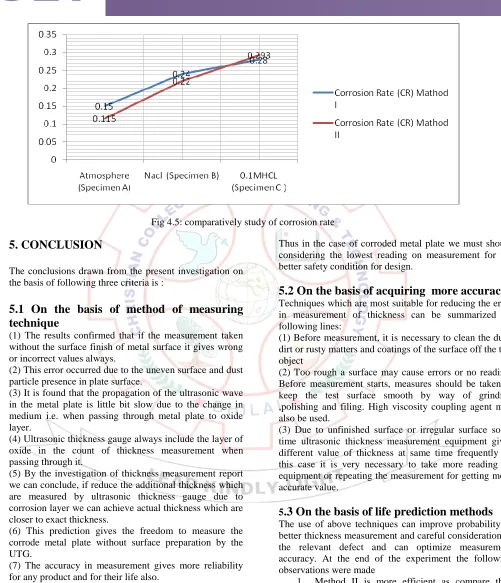
4.4 Comparison of result between two methods
Table 4.8 comparatively study of corrosion rate
Specimen Corrosion Rate (CR) Method I Method II
Atmosphere (Specimen A) 0.15 0.115
Nacl (Specimen B) 0.24 0.22
0.1MHCL (Specimen C ) 0.28 0.293
Weight loss determination has a number of attractive features that account for its sustained popularity:
1. Simple - No sophisticated instrumentation is required to obtain a result.
2. Direct - A direct measurement is obtained, with no theoretical assumptions or
87
Fig 4.5: comparatively study of corrosion rate
5. CONCLUSION
The conclusions drawn from the present investigation on the basis of following three criteria is :
5.1 On the basis of method of measuring
technique
(1) The results confirmed that if the measurement taken without the surface finish of metal surface it gives wrong or incorrect values always.
(2) This error occurred due to the uneven surface and dust particle presence in plate surface.
(3) It is found that the propagation of the ultrasonic wave in the metal plate is little bit slow due to the change in medium i.e. when passing through metal plate to oxide layer.
(4) Ultrasonic thickness gauge always include the layer of oxide in the count of thickness measurement when passing through it.
(5) By the investigation of thickness measurement report we can conclude, if reduce the additional thickness which are measured by ultrasonic thickness gauge due to corrosion layer we can achieve actual thickness which are closer to exact thickness.
(6) This prediction gives the freedom to measure the corrode metal plate without surface preparation by the UTG.
(7) The accuracy in measurement gives more reliability for any product and for their life also.
The results from this research indicate that the technology has the potential to be a useful tool in evaluating the thickness measurement of corrodes plates by reducing the factors which is involved in measurement error.
Thus in the case of corroded metal plate we must should considering the lowest reading on measurement for the better safety condition for design.
5.2 On the basis of acquiring more accuracy
Techniques which are most suitable for reducing the error in measurement of thickness can be summarized by following lines:(1) Before measurement, it is necessary to clean the dust, dirt or rusty matters and coatings of the surface off the test object
(2) Too rough a surface may cause errors or no reading. Before measurement starts, measures should be taken to keep the test surface smooth by way of grinding ,polishing and filing. High viscosity coupling agent may also be used.
(3) Due to unfinished surface or irregular surface some time ultrasonic thickness measurement equipment gives different value of thickness at same time frequently on this case it is very necessary to take more reading by equipment or repeating the measurement for getting more accurate value.
5
.3 On the basis of life prediction methods
The use of above techniques can improve probability of better thickness measurement and careful consideration of the relevant defect and can optimize measurement accuracy. At the end of the experiment the following observations were made1. Method II is more efficient as compare than method I and also easiest. Shown in table 4.8 2. Weight loss method is easy to perform and no
need to precious equipment.
88
4. In the absence of potential pollutants in the atmosphere, corrosion will proceed at a controllable rate.
5. Micro-organisms by their metabolic activities tend to provide corrosion stimulating ions especially in swampy areas and hence increase corrosion rate.
6. In the presence of an acid, corrosion can prove detrimental in a short period of time.
7. Corrosion rate in the acidic medium is faster than in salt water, atmospheric, fresh water and salt soil medium.
8. The rate of corrosion is proportional to the time of exposure.
The rate of corrosion of mild steel in the various media decreases in the following manner: 0.1M Hydrochloric acid, salt Solution and open environment.
REFERENCES
[1] Alexander nana kwesi, Determination of corrosion rate and remaining life of pressure Vessel using ultrasonic thickness testing technique, G.J. E.D.T.,Vol.3(2):43-50 (March-April, 2014)
[2] Chinwko Emmanuel Chuka, Investigation of the effect of corrosion on mild steel in five different environments, International Journal Of Scientific & Technology Research volume 3, issue 7, July 2014 [3] J. C. Drury, Ultrasonic Flaw Detection for
Technicians and Corrosion Monitoring and Thickness Measurement - international journal of NDT
[4] Theory and application of precision ultrasonic thickness gaging by Kenneth A. Fowler, Gerry M. Elfbaum, Karen A. Smith and Thomas J. Nelligan,- The Journal of the British Institute of Non-Destructive Testing.
[5] Feasibility of thickness mapping using ultrasonic guided waves by Pierre Belanger A thesis submitted to Imperial College London for the degree of Doctor of Philosophy Department of Mechanical Engineering, Imperial College London December 2009.
[6] Kang llLEE, Department of Physics, Kangwon National University, Chuncheon 200-701 (Received 24 November 2009, in final form January 2010) [7] Assessment of deteriorated corrugated steel culverts”
Van Thien Mai,Queen’s University Kingston, Ontario, Canada (January, 2013).
[8] Measuring oxide scale thickness on the inner surface of a boiler tube using advanced ultrasonic method Ahmed YAMANI Electrical Engineering Department, King Fahd University of Petroleum and Minerals.
[9] Investigation of the effect of corrosion on mild steel in five different environments by international journal of scientific & technology research volume 3, issue 7, July 2014
[10] Root cause analysis for the thickness measurement of corrode metal sheet by ultrasonic thickness gauge Sheetal kumar dewangan & k Ganpati Rao, Department of Mechanical Engineering, CCET Bhilai, Chhattisgarh, India.
[11] Role of Oxide Scale Thickness Measurements in Boiler Conditions Assessment” M. Alardhi, A. Almazrouee, S. Alsaleh, World Academy of Science, Engineering and Technology, Vol: 5 2011-09-26.