Feeding habits and trophic level of
Himantura gerrardi
(Elasmobranchii; Dasyatidae) in northern Oman Sea: effects
of sex and size class
Rastgoo A.R.
1; Fatemi S.M.R.
1; Valinassab T.
2; Mortazavi M.S.
3Received: August 2015 Accepted:October2015
Abstract
The feeding habits and trophic level of Himantura gerrardi were studied according to sex and size classes of 80 individuals obtained using bottom trawl between May and December 2014 from the Oman Sea. Collected specimens were divided into three size classes (small<38 cm, medium 38-58 cm and large>58 cm) based on disk width. Prey was identified in seven main zoological categories, where crustacean and polychaetes were the dominant in diets, indicating this species is a demersal dwelling species. No significant differences were observed between sexes, but size classes showed significant differences in their diets. Also, results showed a decrease in feeding overlap between size classes with an increase in disk width, suggesting that intraspecific competition reduced, which allows the coexistence of different size classes. Trophic level was positively correlated with the disk width, which was lower than 4.0 for both sexes and different size classes, placing it in an intermediate trophic level.
Keywords: Dasyatidae, Himantura gerrardi, Feeding habits, Trophic level, Oman Sea.
1-Department of Marine Biology, Tehran Science and Research Branch, Islamic Azad University, Tehran, Iran.
2-Iranian Fisheries Science Research Institute (IFSRI), Agricultural Research Education and Extension Organization (AREEO), P.O. Box: 14965/149. Tehran, Iran.
3-Persian Gulf and Oman Sea Ecological Center, Iranian Fisheries Science Research Institute (IFSRI), Agricultural Research Education and Extension Organization (AREEO), Bandar Abbas, Iran.
Corresponding author’s E-mail: t_valinassab@yahoo.com
138 Rastgoo et al., Feeding habits and trophic level of Himantura gerrardi (Elasmobranchii; … Introduction
The feeding habits of marine predators within the food web is critical to describe their ecological role within the ecosystem (Navarro et al., 2013). Also, the feeding habits of marine predators provide a comprehensive understanding of their ecological interactions such as feeding competition (O’Shea et al., 2013), predator-prey size relationships (Scharf et al., 2000), ontogenetic dietary shifts (Koen Alonso et al., 2001) and habitat selection (Heupel et al., 2007). In addition, feeding habit studies are necessary for conservation strategies, and ecosystem-based management through the estimation of trophic levels (Pauly and Christensen, 2000).
In marine environments, the trophic level (TL) represents the position of species within the food web (Pauly et al., 1998; Stergiou and Karpouzi, 2002). Most elasmobranch species are carnivores and tend to occupy higher TLs than other fishes. However, high TLs are not universal among this group
(Vaudo and Heithaus, 2011).
Batoidfishes usually occupy
intermediate TLs in their communities (TL<4.0) and are also present in the diet of large sharks (Bornatowski et al., 2014). Therefore, they can be considered mesopredators with an important role to create a link between top-down TLs (Vaudo and Heithaus, 2011) and have the impact to control lower TL organisms in the marine ecosystems (Ebert and Bizzarro, 2007).
Coastal environments in tropical regions represent a high diversity and abundance of rays (Last and Stevens, 1994). The Oman Sea and Strait of Hormuz are in the subtropical region, a place in the Northwestern Indian Ocean, lying between latitudes 24 and 27N and longitudes 5550 to 6125E. As expected, the highest abundance of species in these regions is rays, which have increased over the last two decades (Valinassab et al., 2006).
Among these groups, sharpnose
stingray, Himantura gerrardi (Gray, 1851) has a considerable total biomass, where it is one of the important members of the family Dasyatidae. This species also is widely distributed in the Indian Ocean from India to the south and east African coasts (Bianchi, 1985; Last and Compagno, 1999). This stingray inhabits demersal shallow waters on soft substrates, mostly found at depths of at least 60 m (Last and
Compagno, 1999). Despite the
abundance of this species in the Oman Sea and Strait of Hormuz, it is discarded by both traditional and industrial fishermen. So, information about feeding habits and trophic level of this species is very scarce. Also, in
comparison with other marine
ecosystems, information about the TL of the marine species inhabiting the Persian Gulf and Oman Sea is very scarce. For example, Vahabnezhad (2015) reported TL of 8 fish species using the analysis of their stomach contents in the Persian Gulf, which varied from 3.47 for Argyrops spinifer
to 4.61 for Saurida tumbil. Similarly, Rastgoo (2015) reported TL of 6 elasmobranch species in the Oman Sea, which varied from 3.25 for Pastinachus sephen to 4.50 for Torpedo sinuspersici. The objectives of the current study were to analyze the stomach contents of H. gerrardi in the Oman Sea and Strait of Hormuz and trophic level estimation of this species in relation to sex and different size classes.
Materials and methods
Samples were obtained during spring, summer, autumn and winter through four cruises of bottom trawl R/V
‘Ferdows1’ between May and
December 2014 from Strait of Hormuz and Oman Sea (from 56 07E 2702 N to 58 01 E 2513 N) (Fig. 1). Mesh size of cod end and headline of trawl net were 80 mm and 72 m, respectively.
Figure 1: Sampling stations along the Strait of Hormuz and Oman Sea.
Samples were collected between the sunrise and 14:00 hours from depths of 10 to 60 m. For all specimens, sex (based on the presence of claspers in males), weight (W) (nearest 10 g), disk length (DL) and width (DW) were recorded. Stomachs were removed and preserved in 5% formaldehyde for further examination in the laboratory. Stomach contents were identified to the
lowest possible taxon (Sterrer and Schoepfer-Sterrer, 1986; Bosch et al., 1994; Asadi and Dehghani, 1996; Carpenter, 1997), counted and weighed (nearest 0.1 g). Due to the lack of knowledge about maturity size in H. gerrardi in the Oman Sea, to reach the ontogenetic trends, collected specimens were divided into three size classes, small (size class I) (<38 cm),
140Rastgoo et al., Feeding habits and trophic level of Himantura gerrardi (Elasmobranchii; …
medium(size class II) (38–58 cm), and large (size class III) (>58 cm) based on disk width.
The length-weight relationship was determined using the equation W= aDWb, where W is weight (in g) and DW is the disk width (in cm). The importance of various prey taxa was assessed by calculating the index of relative importance (IRI) (Hyslop, 1980) as:
IRI= (%N+%W)*%FO
Where %N is the number of a given prey type as a percentage of the total number of prey; %W the weight of a given prey type as a percentage of the total weight of prey; and %FO is the percentage of frequency of occurrence of each prey type (Hyslop, 1980). The IRI values were standardized in percentage values according to Cortés (1997):
%IRI= (IRI/IRI)*100
The trophic level (TL) for both sex and sizes was determined by using the percentage of weight for each prey in the diet using the program TrophLab (Pauly et al., 2000). We used only identified items. TrophLab estimates the TL with standard error (±SE) considering the diet composition and the TL of the different prey present in the diet, according to percentage of weight (Pauly et al., 2000):
∑
Where DCij is the fraction of prey (j) in the diet of consumer i;TLj is the trophic level of prey (j); while G is the number of prey categories. The trophic level of
each prey taxa was extracted from the FishBase dataset (Froese and Pauly, 2000).
Because of the large number of zeros in the dataset, data were pooled into seven taxonomic categories. Feeding strategy of different size classes were described by plotting the prey-specific abundance of the main zoological prey groups against %FO (Amundsen et al., 1996). Prey-specific abundance was estimated as the number of prey I divided by the total number of prey in the stomachs that contained prey I, expressed as a percentage. The vertical axis represents the feeding
strategy (specialization or
generalization) of the predator. Points positioned in the upper part of the graph suggest specialist prey items, whereas points in the lower part indicate items that were only eaten occasionally. If no points are located in the upper right of the diagram and all points fall along or below the diagonal from the upper left to the lower right, the predator is thought to have a generalist diet and thus a broad niche width.
Pianka index with EcoSim 7.72 software and IRI of each prey was used to calculate niche overlap (Gotelli and Entsminger, 2005). Lower values suggest differences in diets or resource partitioning, while higher values suggest similar diets or strong resource competition. When values exceed 0.60,
niche overlap was considered
biologically significant (Zares and Rand, 1971).
Similarity matrix with the transformed estimated contribution values of food items, based on weight of main zoological prey groups was used to test variation between the diets of factors (sex and size classes). The test was then generated using the Bray–Curtis similarity coefficient. Diet similarity
was analysed with non-metric
multidimensional scaling analysis
(nMDS). One-way analysis of
similarity (ANOSIM) employed to investigate data. This test was used to verify similarities (distance) within defined factors and also calculates the statistic R, which varies between -1 and +1. The R value close to zero represents there are no differences between
factors, and R value close to 1 indicates that the factors were dissimilar between the levels of each factor. Also, similarity of percentages (SIMPER) was used to estimate the contribution of
each main zoological prey to
differences in diets. The analyses were performed using the software PRIMER v.5 (Clarke and Gorley, 2001).
Results
A total of 80 specimens of H. gerrardi
were collected from the Oman Sea and Strait of Hormuz. The length-weight relationships for all specimens are shown in Fig. 2.
Figure 2: Length-weight relationships for all specimen of H. gerrardi from Oman Sea.
In total, 19 different prey taxa were identified in all stomachs: eight different crustaceans, four teleosts, two echinoderms and one polychaete, bivalve, gastropod and cephalopod. In terms of %IRI, diets were dominated by crustaceans (%IRI=60.46), followed by polychaetes (%IRI=13.94). In contrast,
cephalopoda, gastropodaand,
echinodermata had lowest importance (%IRI <1; Table 2).
The samples were composed of 31 males and 49 females (χ2, p<0.05). Size distribution female and male of H. gerrardi sampled are shown in Fig. 3.
142 Rastgoo et al., Feeding habits and trophic level of Himantura gerrardi (Elasmobranchii; …
Figure 3: Size distribution based on sex of Himantura gerrardi sampled for stomach content analyses.
The range of DW was 18.5-76 cm (mean 38.7±16.7) for male and 18-80 cm (mean 41.81±14.1) for female. Of the total 80 stomachs examined, 71 (88.75%) stomachs contained prey (87.1% of male and 89.8% of female).
The ANOSIM did not find diet differences between males and females of H. gerrardi (R=0.038; p>0.05) (Fig.4). Both sexes mainly feed on crustaceans, followed by polychaetes (Table 1).
Figure 4: Non-metric multi-dimensional scaling for sex and size classes in Himantura gerrardi
based on stomach content in the Oman Sea.
The numbers of small, medium and large individuals were 31, 43 and 6, respectively (χ2
, p<0.05) and mean of DW (±SE) were 24.4±5.4 cm, 46.2±6.7 cm and 73.1±5.6 cm, respectively. Of the total 9 empty stomachs, 8 (88.8%) and 1 (11.1) belong to size classes I and III, respectively. In terms of %IRI, crustaceans were an important prey
category for all size classes (%IRIsmall=78.79; %IRImedium=51.97
and %IRIlarge=50.77). In contrast,
cephalopoda (%IRImedium=0.02),
gastropoda(%IRIsmall=0.48and
%IRIlarge=0.67) had lowest importance
for all size classes (Table 2).
Table 1: Values for dietary items and main zoological prey (in bold) based on sex of Himantura gerrardi in the Oman Sea were expressed by number (%N), weight (%W), percentages of occurrence (%FO), and index of relative importance (%IRI).
Food items Male (n= 31) Female (n= 49)
%N %W %FO %IRI %N %W %FO %IRI Teleostei 2.25 15.18 16.12 2.70 7.21 27.30 28.57 4.97 Acropomatidae 0.28 1.14 3.22 0.05 3.82 14.02 10.20 2.53
Haemulidae 0.21 6.79 2.04 0.19
Leiognatidae 0.21 0.73 2.04 0.02
Unidentified teleostei 1.97 14.04 12.90 2.65 2.97 5.76 18.36 2.23 Crustaceans 51.09 39.93 77.41 41.57 67.26 47.49 75.51 71.96 Crab 1.97 7.09 19.35 2.25 5.94 10.62 18.36 4.23 Portunidae 1.41 4.08 6.45 0.45 0.42 1.46 2.04 0.05 Xanthidae 0.84 2.29 6.45 0.25 1.06 1.93 4.08 0.17 Shrimp 34.46 12.71 51.61 31.24 43.31 25.46 63.26 60.60 Isopoda 1.69 0.21 6.45 0.15 3.60 1.20 18.36 1.23 Amphipoda 2.82 0.50 28.80 1.09 6.15 1.67 16.32 1.78 Squillidae 1.69 1.64 6.45 0.27 0.63 0.51 6.12 0.09 Unidentified crustacea 6.21 11.38 25.80 5.82 6.15 4.94 24.48 3.78 Polychaetes 29.37 12.71 45.16 24.38 9.55 5.82 32.65 6.99 Bivalvia 3.1 10.60 12.90 2.26 3.60 11.57 10.20 2.15
Gastropoda 0.63 0.34 4.08 0.05
Cephalopoda 0.21 0.73 2.04 0.02
Sepiidae 0.21 0.73 2.04 0.02
Echinodermata 0.56 1.78 6.45 0.09 Holothuroidea 0.28 1.71 3.22 0.08 Ophiuridae 0.28 0.07 3.22 0.01
Unidentified 13.55 19.77 67.74 28.96 11.46 6.51 55.10 13.80
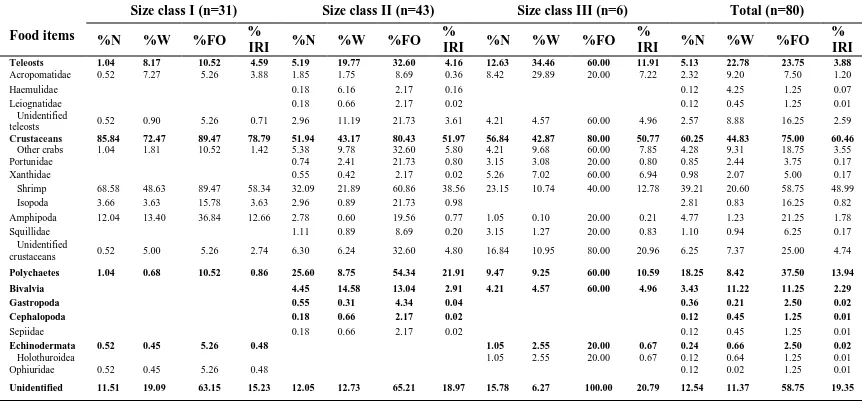
Table 2: Diet composition of Himantura gerrardi for different size classes and total in the Oman Sea expressed by percentage of number (%N), weight (%W), percentages of occurrence (%FO), and index of relative importance (%IRI).
Food items
Size class I (n=31) Size class II (n=43) Size class III (n=6) Total (n=80)
%N %W %FO %
IRI %N %W %FO
%
IRI %N %W %FO
%
IRI %N %W %FO
% IRI Teleosts 1.04 8.17 10.52 4.59 5.19 19.77 32.60 4.16 12.63 34.46 60.00 11.91 5.13 22.78 23.75 3.88
Acropomatidae 0.52 7.27 5.26 3.88 1.85 1.75 8.69 0.36 8.42 29.89 20.00 7.22 2.32 9.20 7.50 1.20
Haemulidae 0.18 6.16 2.17 0.16 0.12 4.25 1.25 0.07
Leiognatidae 0.18 0.66 2.17 0.02 0.12 0.45 1.25 0.01
Unidentified
teleosts 0.52 0.90 5.26 0.71 2.96 11.19 21.73 3.61 4.21 4.57 60.00 4.96 2.57 8.88 16.25 2.59
Crustaceans 85.84 72.47 89.47 78.79 51.94 43.17 80.43 51.97 56.84 42.87 80.00 50.77 60.25 44.83 75.00 60.46
Other crabs 1.04 1.81 10.52 1.42 5.38 9.78 32.60 5.80 4.21 9.68 60.00 7.85 4.28 9.31 18.75 3.55
Portunidae 0.74 2.41 21.73 0.80 3.15 3.08 20.00 0.80 0.85 2.44 3.75 0.17
Xanthidae 0.55 0.42 2.17 0.02 5.26 7.02 60.00 6.94 0.98 2.07 5.00 0.17
Shrimp 68.58 48.63 89.47 58.34 32.09 21.89 60.86 38.56 23.15 10.74 40.00 12.78 39.21 20.60 58.75 48.99
Isopoda 3.66 3.63 15.78 3.63 2.96 0.89 21.73 0.98 2.81 0.83 16.25 0.82
Amphipoda 12.04 13.40 36.84 12.66 2.78 0.60 19.56 0.77 1.05 0.10 20.00 0.21 4.77 1.23 21.25 1.78
Squillidae 1.11 0.89 8.69 0.20 3.15 1.27 20.00 0.83 1.10 0.94 6.25 0.17
Unidentified
crustaceans 0.52 5.00 5.26 2.74 6.30 6.24 32.60 4.80 16.84 10.95 80.00 20.96 6.25 7.37 25.00 4.74
Polychaetes 1.04 0.68 10.52 0.86 25.60 8.75 54.34 21.91 9.47 9.25 60.00 10.59 18.25 8.42 37.50 13.94
Bivalvia 4.45 14.58 13.04 2.91 4.21 4.57 60.00 4.96 3.43 11.22 11.25 2.29
Gastropoda 0.55 0.31 4.34 0.04 0.36 0.21 2.50 0.02
Cephalopoda 0.18 0.66 2.17 0.02 0.12 0.45 1.25 0.01
Sepiidae 0.18 0.66 2.17 0.02 0.12 0.45 1.25 0.01
Echinodermata 0.52 0.45 5.26 0.48 1.05 2.55 20.00 0.67 0.24 0.66 2.50 0.02
Holothuroidea 1.05 2.55 20.00 0.67 0.12 0.64 1.25 0.01
Ophiuridae 0.52 0.45 5.26 0.48 0.12 0.02 1.25 0.01
Unidentified 11.51 19.09 63.15 15.23 12.05 12.73 65.21 18.97 15.78 6.27 100.00 20.79 12.54 11.37 58.75 19.35
The ANOSIM found significant
differences in the diet composition among size classes (Rglobal=0.124;
p<0.05). Pair-wise tests from the ANOSIM indicated that the diet of size
144Rastgoo et al., Feeding habits and trophic level of Himantura gerrardi (Elasmobranchii; …
class I was dissimilar to size class III (R=0.749; p=0.001) (Fig. 4).
Feeding strategy plots verified that crustaceans were an important prey category for all size classes. There was a high degree of specialization on this
prey category by size class I. whereas a moderate level of specialization occurred by size class III on teleosts, polychaetas and bivalvia with a relatively narrow niche width (Fig.5).
Figure 5: Feeding strategy plots of Himantura gerrardi in different size classes: (a) size class I, (b) size class II and (c) size class III: [() Crustacea, (∆) Teleostei, )▲) Polychaeta, (+)Bivalvia, (○)Gastropoda, () Cephalopoda, and (×)Echinodermata].
The average Bray–Curtis dissimilarity in diet between size class I and III for
H. gerrardi was 95.51 and this difference was predominantly due to
crustaceans (44.41%), teleosts
(27.08%), polychaetes (12.96%) and bivalvia (10.01).
Pianka’s index showed that there was a degree of dietary resource overlap between sexes (O=0.801), whereas a reducing dietary resource overlap was observed among size
classes with an increase of DW (size class I and II= 0.842; size class I and III= 0.466; size class II and III=0.651), indicating that by increasing DW, intraspecific feeding competition is reduced, which allows the coexistence of two or more size classes.
Overall, the H. gerrardi occupied
anintermediate trophic level
(TL=3.69±0.59). The trophic level was similar among males and females with slight variation (male: TL=3.57±0.57,
female: TL=3.74±0.61), and size classes (small: TL=3.60±0.59; medium: TL=3.65±0.58; large: TL=3.80±0.63), and only a positive relationship between trophic level and DW was detected.
Discussion
According to the obtained results, H. gerrardi is a predator with a relatively wide trophic spectrum which feeds mainly on crustaceans, followed by polychaetes and teleosts. Other main zoological preys such as bivalvia, gastropoda and echinodermata were only found in several stomachs and contributed small proportions to the diet composition. Although the feeding habits of H. gerrardi has not been described in the Oman Sea, the preferential consumption of crustacean such as shrimp and crabs by this species has been reported by Compagno et al. (1989) in southern Africa. Also, to describe the diet of H. gerrardi, Manjaji
et al. (2009) mentioned that the diet is presumably based on crustaceans, bivalve and small fishes. Higher up, similarity in the crustacean-diet is shared with one species of stingray of the genus Himantura from Australia (O’Shea et al., 2013). Also other species in the family of Dasyatidae such as Pastinachus atrus, Taeniura lymma,
Neotrygon kuhlii and Urogymnus asperrimus had diets dominated by
polychaetes (O’Shea et al.,
2013).Therefore, this suggests that these two main zoological prey groups
are the most important dietary categories for this family.
The similar diet exhibited by males and females of H. gerrardi can be explained by the fact that both sexes showed similar body size (Barbini et al., 2010; Navarro et al., 2013). Our results agree with previous studies conducted on several ray species (White and Potter, 2004; Navia et al., 2007; Jacobsen and Bennett, 2012), confirming no evidence for differences in diet of males and females for elasmobranch species was detected. An analysis of similarity showed significant differences between the three size classes in their diet. Although results showed that crustaceans were important prey category in all classes, the individuals from size classes II and III had a wider trophic spectrum than size I, which according to Pianka index could help decrease intraspecific competition. Although disk width of mature individuals of H. gerrardi is not clearly determined in the Oman Sea, these measurements reported 47 and 54 cm for males and females, respectively (Manjaji et al., 2009). Therefore, it seems that the size class II included both mature and immature individuals, confirming feeding overlap with other size classes. These ontogenetic changes in feeding habits seem to be a common characteristic in elasmobranchs and have been reported in several species of rays and skates (Scharf et al., 2000; Brickle et al., 2003; White et al., 2004). The predominant proportions of crustaceans and the shares of many
146Rastgoo et al., Feeding habits and trophic level of Himantura gerrardi (Elasmobranchii; …
marine benthic fauna in the diet confirm that the H. gerrardi is a demesral dwelling species. Nevertheless, in comparison with the high diversity of marine benthic fauna found in the other studies from the Oman Sea (Behzadi et al., 2010), size class I had high presence of crustaceans especially shrimp in their diet, which could be due to specialization of the predator. Also the sample sizes for class III were only a few, but they could describe the general feature of the diet and feeding strategy. On the other hand, size class III had a relatively wide trophic spectrum and low percentage of empty stomachs found in larger specimens, which is in line with results reported by Lipej et al. (2013) from Adriatic Sea, suggesting it can be due to increase of swimming speed, movement patterns and enhanced ability to capture prey (Wetherbee and Cortes, 2004).
Most studies have been conducted to determine the trophic level based on the analysis of stomach contents, although new methods have been developed to determine the trophic level for marine species such as stable isotope. In marine ecosystems, trophic level varied from 2 fordetrivorus/herbivorous species to 5 for carnivorous/piscivorous species (Pauly et al., 1998). The relative moderate trophic level of H. gerrardi (3.5<TL<4.0) for both sex and size classes indicates that this species is a potentially important mesopredator within the Oman Sea food web. In addition, the results revealed that trophic level positively increases with
body size. Demersal rays showed a slightly lower trophic level than sharks in the Oman Sea, where the group of demersal rays in this region showed a trophic level between 3.25 to 3.69 and that of sharks varied from 4.06 to 4.50 (Rastgoo and Navarro, 2017) . Cortés (1999) calculated the trophic level for 149 elasmobranch species, which generally ranged between 3.10 and 4.70 and mentioned that sharks tend to be in the third level (TL>4.0), and with few exceptions, announced that the trophic levels of sharks are positively correlated with body size. Like sharks, skates also showed a positive relationship between body size and trophic level (Ebert and Bizzarro, 2007). The obtained differences in trophic levels between both sexes and size classes could be due to differences in size; larger fish tend to have higher TLs. Similar patterns were reported by Stergiou and Karpouzi (2002) for some teleost fishes in the Mediterranean Sea, which confirmed that the relative success of larger predators increases due ontogenetic changes in predatory capacities and tend to be much faster swimmers.
Although seasonal variations in elasmobranch diet have been reported for several species of ray (Muto et al., 2001; Wetherbee and Cortes, 2004; Braccini and Perez, 2005; San Martin et al., 2006), it is likely that H. gerrardi
would show changes in feeding habits. Therefore, while the current study provides a baseline description of the diets of this species, further data from a
larger sample across seasons, spatial and temporal variation are required to provide a precise estimation of the feeding habits and trophic level. Also, Jabado et al. (2015) reported little overlap in the diets of two shark species in the Persian Gulf, this is especially important that future studies should focus on trophic interactions and mechanisms of coexistence within and
among elasmobranch species to
understand their important ecological role in the ecosystem.
Acknowledgements
We are grateful to Iranian Fisheries Science Research Institute (IFSRI) for supporting this study and also captain Hadi Mohammad zadeh and crew of R/V Ferdow-1 for all their assistance to collect the samples.
References
Amundsen, P.A., Gabler, H.M. and Staldvik, F., 1996. A new approach to graphical analysis of feeding strategy from stomach contents data-modification of the Costello (1990) method. Journal of Fish Biology, 48,
607-614.
Asadi, H. and Dehghani, R., 1996.
Fishes of the Persian Gulf and Oman Sea, Iranian Fisheries Research Organization, Tehran: Aieneh Press. 226P.
Barbini, S.A., Scenna, L.B., Figueroa, D.E., Cousseau, M.B. and Diaz De Astarloa, J.M., 2010. Feeding habits of the Magellan skate: effects of sex, maturity stage, and body size
on diet. Hydrobiologia, 641, 275– 286.
Behzadi, S., Salarpouri, A., Darvishi, M., Daghooghi, B., Akbarzadeh, G., Seied Moradi, S., Ebrahimi, M., Saraji, F., Rameshi, H., Shogai, M., Aghajari, S. and Mohebi, P., 2010. Feasibility study on development of artificial reefs in
the Persian Gulf (Hormuzgan
province), Iranian Fisheries Research Organization (IFRO). 132P.
Bianchi, G., 1985. Field guide to the commercial marine and brackish-water species of Pakistan, FAO Library. 234P.
Bornatowski, H., Wosnick, N., Do Carmo, W. P. D., Corrêa, M. F. M. and Abilhoa, V., 2014. Feeding
comparisons of four batoids
(Elasmobranchii) in coastal waters of southern Brazil. Journal of the Marine Biological Association of the United Kingdom, 1-9.
Bosch, D.T., Dance, S.P., Moolenbeek, R.G. and Oliver, P.G., 1994. Seashells of eastern Arabia, Motivate publishing. 295P.
Braccini, J.M. and Perez, J.E., 2005.
Feeding habits of the sandskate
Psammobatis extenta (Garman, 1913): sources of variation in dietary
composition. Marine and
Freshwater Research, 56, 395-403.
Brickle, P., Laptikhovsky, V., Pompert, J. and Bishop, A., 2003.
Ontogenetic changes in the feeding habits and dietary overlap between three abundant rajids species on the Falkland Islands shelf. Journal of the
148Rastgoo et al., Feeding habits and trophic level of Himantura gerrardi (Elasmobranchii; …
Marine Biological Association of the United Kingdom, 83, 1119–1125.
Carpenter, K.E., 1997. Living marine resources of Kuwait, Eastern Saudi Arabia, Bahrain, Qatar, and the United Arab Emirates, Food and Agriculture Organization.324P.
Clarke, K.R. and Gorley, R.N., 2001.
PRIMER v5: User manual/tutorial, PRIMER-E, Plymouth UK.
Compagno, L.J.V., Ebert, D.A. and Smale, M.J., 1989. Guide to the sharks and rays of southern Africa, New Holland (Publ.) Ltd., London. 158P.
Cortés, E., 1997. A critical review of methods of studying fish feeding based on analysis of stomach
contents: application to
elasmobranch fishes. Canadian Journal of Fisheries and Aquatic Sciences, 54, 726-738.
Cortés, E., 1999. Standardized diet compositions and trophic levels of sharks. ICES Journal of Marine Science: Journal du Conseil, 56,
707-717.
Ebert, D.A. and Bizzarro, J.J., 2007.
Standardized diet compositions and
trophic levels of skates
(Chondrichthyes: Rajiformes:
Rajoidei). Environmental Biology of Fishes, 80, 221–237.
Froese, R. and Pauly, D., 2000.
Fishbase 2000, Concepts, design and data sources,, ICLARM, Los Banos, Laguna, Philippines. 344P.
Gotelli, N.J. and Entsminger, G.L., 2005. EcoSim: Null models software
for ecology, version 7.0. Burlington: Kesey-Bear, Acquired Intelligence.
Heupel, M.R., Carlson, J.K. and Simpfendorfer, C.A., 2007. Shark nursery areas: concepts, definition, characterization and assumptions.
Marine Ecology Progress Series,
337, 287–297.
Hyslop, E.J., 1980. Stomach contents analysis-a review of methods and their application. Journal of Fish Biology, 17, 411-429.
Jabado, R.W., Al Ghais, S.M., Hamza, W., Henderson, A.C. and Al Mesafri, A.A., 2015. Diet of two
commercially important shark
species in the United Arab Emirates: milk shark, Rhizoprionodon acutus
(Rüppell, 1837), and slit‐eye shark,
Loxodon macrorhinus (Müller and Henle, 1839). Journal of Applied Ichthyology, 31, 1-6.
Jacobsen, I. and Bennett, M., 2012.
Feeding ecology and dietary
comparisons among three sympatric
Neotrygon (Myliobatoidei:
Dasyatidae) species. Journal of Fish Biology, 80, 1580–1594.
Koen Alonso, M., Crespo, E.A., Garcia, N.A., Pedraza, S.N., Mariotti, P.A., Beron Vera, B. and Mora, N.J., 2001. Food habits of
Dipturus chilensis (Pisces: Rajidae) off Patagonia, Argentina. ICES Journal of Marine Science, 58, 288– 297.
Last, P.R. and Compagno, L.J.V., 1999. Dasyatididae. Stingrays. pp. 1479-1505. In K.E. Carpenter and V.H. Niem (eds.) FAO species
identification guide for fishery
purposes. The living marine
resources of the Western Central Pacific. Vol. 3. Batoid fishes, chimaeras and bony fishes part 1 (Elopidae to Linophrynidae). FAO, Rome.
Last, P.R. and Stevens, J.D., 1994.
Sharks and rays of Australia, CSIRO, Australia.512P.
Lipej, L., Mavrič, B., Paliska, D. and Capapé, C., 2013. Feeding habits of the pelagic stingray Pteroplatytrygon violacea (Chondrichthyes: Dasyatidae) in the Adriatic Sea.
Journal of the Marine Biological Association of the United Kingdom,
93, 285-290.
Manjaji, B.M., Fahmi and White, W.T., 2009. Himantura gerrardi, The IUCN Red List of Threatened Species. Version 2015.2.
Muto, E.Y., Soares, L.S.H. and Goitein, R., 2001. Food resource utilization of the skates Rioraja agassizii (Müller and Henle, 1841) and Psammobatis extenta (Garman, 1913) on the continental shelf off Ubatuba, South-eastern Brazil.
Revista Brasileira de Biologia, 61,
217-238.
Navarro, J., Coll, M., Preminger, M. and Palomera, I., 2013. Feeding ecology and trophic position of a
Mediterranean endemic ray:
consistency between sexes, maturity stages and seasons. Environmental Biology of Fishes, 96, 1315-1328.
Navia, A.F., Mejía-Falla, P.A. and Giraldo, A., 2007. Feeding ecology
of elasmobranch fishes in coastal waters of the Colombian Eastern Tropical Pacific. BMC Ecology, 7, 8.
O’shea, O.R., Thums, M., Van Keulen, M., Kempster, R. M. andMeekan, M.G., 2013. Dietary partitioning by five sympatric species of stingray (Dasyatidae) on coral reefs. Journal of Fish Biology,
82, 1805–1820.
Pauly, D. and Christensen, V., 2000.
Trophic levels of fishes. in Fish-Base 2000: Concepts, Design and Data Sources, R. Froese and R.D. Pauly, Eds., ICLARM, Manila, Pa, USA,
Pauly, D., Froese, R., Sa-A, P., Palomares, M.L., Christensen, V. and Rius, J., 2000. TrophLab in MS Access. (Downloaded: May 30,
2010, www.fishbase.org/
download/TrophLab2K.zip).
Pauly, D., Trites, A., Capuli, E. and Christensen, V., 1998. Diet composition and trophic levels of marine mammals. ICES Journal of Marine Science, 55, 467–481.
Rastgoo, A.R., 2015. Feeding habits and trophic level estimation of dominant batoid fishes in the Oman Sea, PhD thesis in Marine Ecology, Science and Research Branch,
Islamic Azad University,
Tehran.187P. (In Persian).
Rastgoo, A.R. and Navarro, J., 2017.
Trophic levels of teleost and elasmobranch species in the Persian Gulf and Oman Sea. Journal of Applied Ichthyology, 33, 403-408.
150Rastgoo et al., Feeding habits and trophic level of Himantura gerrardi (Elasmobranchii; … San Martin, M.J., Braccini, J.M.,
Tamini, L.L., Chiaramonte, G.E. and Perez, J.E., 2006. Temporal and sexual effects in the feeding ecology of the marbled sand skate
Psammobatis bergi (Marini, 1932).
Marine Biology, 151, 505–513.
Scharf, F.S., Juanes, F. and Rountree, R.A., 2000. Predator size: prey size relationships of marine fish predators: interspecific variation and effects of ontogeny and body size on trophic-niche breadth. Marine Ecology Progress Series, 208, 229– 248.
Stergiou, K.I. and Karpouzi, V.S., 2002. Feeding habits and trophic levels of Mediterranean fish.
Reviews in Fish Biology and Fisheries, 11, 217-254.
Sterrer, W. and Schoepfer-Sterrer, C., 1986. Marine fauna and flora of Bermuda: a systematic guide to the identification of marine organisms, Wiley and Sons, Inc.741P.
Vahabnezhad, A., 2015. Feeding habits and trophic levels of some demersal fish species in the Persian Gulf (Bushehr Province) using Ecopath model, PhD thesis in
Marine Ecology, Science and
Research Branch, Islamic Azad University, Tehran. 160P. (In Persian).
Valinassab, T., Daryanabard, R., Dehghani, R. and Pierce, G., 2006.
Abundance of demersal fish
resources in the Persian Gulf and Oman Sea. Journal of the Marine Biological Association of the United Kingdom, 86, 1455-1462.
Vaudo, J.J. and Heithaus, M.R., 2011. High-Trophic-Level Consumers: Elasmobranchs. Treatise on Estuarine and Coastal Science,
26, 203-225.
Wetherbee, M. and Cortes, E., 2004.
Food consumption and feeding habits. In Carrier J.C., Musick J.A. and Heithaus M.R. (eds) Biology of sharks and their relatives. Boca Raton, London, New York and Washington, DC: CRC Press. pp. 344-395.
White, W.T., Platell, M. and Potter, I., 2004. Comparisons between the diets of four abundant species of elasmobranchs in a subtropical
embayment: implications for
resource partitioning. Marine Biology, 144, 439–448.
White, W.T. and Potter, I.C., 2004.
Habitat partitioning among four elasmobranch species in nearshore, shallow waters of a subtropical embayment in Western Australia.
Marine Biology, 145, 1023–1032.
Zares, T.M. and Rand, A.S., 1971.
Competition in tropical stream fishes: support for the competitive exclusion principle. Ecology, 52,
336–342.


![Figure 5: Feeding strategy plots of Himantura gerrardi in different size classes: (a) size class I, (b) size class II and (c) size class III: [() Crustacea, (∆) Teleostei, )▲) Polychaeta, (+)Bivalvia, (○)Gastropoda, () Cephalopoda, and (×)Echinodermata]](https://thumb-us.123doks.com/thumbv2/123dok_us/8887685.1823379/8.595.77.495.189.483/himantura-different-crustacea-teleostei-polychaeta-gastropoda-cephalopoda-echinodermata.webp)
