VOLUME 40, ARTICLE 55, PAGES 1645
-
1670
PUBLISHED 28 JUNE 2019
https://www.demographic-research.org/Volumes/Vol40/55/ DOI: 10.4054/DemRes.2019.40.55
Research Article
The educational gradient of living alone:
A comparison among the working-age
population in Europe
Glenn Sandström
Lena Karlsson
© 2019 Glenn Sandström & Lena Karlsson.
This open-access work is published under the terms of the Creative Commons Attribution 3.0 Germany (CC BY 3.0 DE), which permits use, reproduction, and distribution in any medium, provided the original author(s) and source are given credit.
1 Introduction 1646
2 Data and method 1650
2.1 The variables 1651
2.2 Method 1651
3 Results 1652
3.1 Living arrangements in Europe 1652
3.2 Living alone in Europe by age group and gender 1654 3.3 Living alone in Europe by level of education and gender 1656
4 Conclusions 1660
References 1664
The educational gradient of living alone:
A comparison among the working-age population in Europe
Glenn Sandström1Lena Karlsson2
Abstract
BACKGROUNDIn recent decades, the proportion of individuals in Western countries living in a one-person household has increased. Previous research has mainly focused on the increase among the elderly and younger segments of the population, and there is a lack of research regarding the characteristics of individuals living alone among the working-age population.
OBJECTIVE
The aim of this study is to examine the educational gradient of living alone in the working-age population (aged 30–64 years) in a comparative perspective and to assess if the differences in the educational gradient are related to the level of gender equality in different European societies.
METHODS
Using data on 12 European countries from the Generations and Gender Surveys, the estimated probabilities of living alone for men and women with different levels of education were calculated using logistic regression models while controlling for parental status and differences in the age distribution across different populations.
RESULTS
In the more gender equal countries, we found a negative educational gradient of living alone, especially for men, with decreasing gender differences in the probability of living alone as education increases. In the less gender equal countries, women tend to live alone to a higher extent than men regardless of their educational level. In the least gender equal countries, we found a positive educational gradient of living alone most
1 Department of Historical, Philosophical and Religious Studies, Umeå University, Sweden; Stockholm
University Demography Unit (SUDA), Stockholm University, Sweden; Institute of Environmental Medicine (IMM), Epidemiology, Karolinska Institute, Sweden. Email:[email protected].
2 Department of Sociology, Umeå University, Sweden; Stockholm University Demography Unit (SUDA),
markedly among women. Here we found the lowest probability of living alone among those who had received only a primary education and the highest levels among men and women with university degrees. Thus, we found a shift in the educational gradient of living alone from a negative gradient in the most gender equal countries in Northern Europe to a positive gradient in the least gender equal countries in the South and in Eastern Europe.
CONTRIBUTIONS
This study highlights differences in living alone for men and women in the working-age population in Europe across different levels of education.
1. Introduction
This paper focuses on the association between education and living as a one-person household in the working-age (30–64 years) population in Europe. Previous research has mainly focused on the living arrangements among the elderly population (Gaymu et al. 2006; Gierveld, Dykstra, and Schenk 2012) or in young adulthood (Mandic 2008; Schwanitz and Mulder 2015), and less attention has been given to the characteristics of individuals living alone in the working-age population, especially from a comparative perspective.
Previous research has often highlighted the Nordic countries as having the highest rates of one-person households, particularly among the working-age population living in urban areas (Klinenberg 2012; Fokkema and Liefbroer 2008). In recent decades the increase in one-person households has primarily been in the working-age population in countries such as Sweden and the United Kingdom (Chandler et al. 2004). However, in some Northern European countries like the Nordic countries, which have already reached high levels of one-person households, the increase is perceived to be less intense or even shifting to increased levels of cohabitation. In countries in which the trend has recently started, it is predicted that there will be major increases in one-person households in the coming decades (Jamieson and Simpson 2013).
chances of partnering and family formation (Bellani, Esping-Andersen, and Nedoluzhko 2017; Demey et al. 2013). It is not fully known how living alone is distributed across educational groups, especially from a gender perspective. At present there are only scattered findings from, for example, the United Kingdom that show that women living alone in early midlife (35–44 years) tend to be more highly educated than their male counterparts (Demey et al. 2013). The consequences of different socioeconomic conditions between men and women in midlife are associated with partner history and parenthood, in which never-partnered men in late midlife (55–64 years) are more economically disadvantaged than women (Demey et al. 2013).
Regarding the causes for the trend of increased single living across European countries, Ron Lesthaeghe’s (Lesthaeghe 1995) theory of the Second Demographic Transition can be used as a framework in which similarities and differences between countries can be discussed. The theory of the Second Demographic Transition predicts changes in demographic behavior resulting from the spread of more individualistic norms that have resulted in weaker family ties. Typically, these ideational changes have resulted in more unstable partnerships, an increase in divorce and separation, lower fertility, more complex household structures, and an increase in single living (Lesthaeghe 1995). The Nordic countries are typically identified as forerunners in this trend towards weaker family ties and more individualistic behaviors, and they were the first countries to experience the shifts in behaviors associated with the Second Demographic Transition (Lesthaeghe 1995; Reher 1998). Following the theory of the Second Demographic Transition, the more highly educated segments of the population are assumed to be the forerunners of these individualistic values, especially concentrated among more highly educated women (Esping-Andersen 2016).
Nedoluzhko (2017) revealed an inverse U-shaped association between the level of gender egalitarianism, education, and the probability of lifelong singlehood. However, whether there are any indications of this U-shape pattern in the probability of living alone in the working-age population in Europe is, thus far, not known.
Given the gaps in knowledge concerning how the socioeconomic background of men and women in different European societies influences the probability of living alone, the aim of this study is to analyze the educational gradient of living alone in the working-age population in Europe. Following the works of Bellani, Esping-Andersen, and Nedoluzhko (2017), we suppose that the educational gradient differs between countries according to their respective level of gender equity, where the educational gradient for living alone should be positive in less gender equal countries, especially among women. In contrast, we suppose that the educational gradient of living alone should be negative in more gender equal countries, especially among women. These findings will add value to previous research on demographic behavior and changes in living arrangements by presenting differences in the socioeconomic composition of one-person households across different European societies.
In addition to the differences in living alone across European countries, it is important to apply a life course perspective on why men and women of different ages tend to live alone. From a life course perspective, living arrangements are often temporary stages associated with different life course events, such as leaving home, entering partnership, childbearing, and divorce. As such, living alone is related to specific stages of life and transitions across the life course, in which typical trajectories will vary in different societies. In Northern Europe, younger individuals typically enter an independent phase by transitioning into single living when they leave their parental homes; in some cases this becomes a persistent state, but in most cases this period of single living is temporary and followed by entering a partnership and family formation phase. Then, a substantial proportion returns to single living in mid-age following a separation, divorce, or death of their spouse (Demey et al. 2013). In Southern European countries, leaving home is often postponed due to economic constraints while, historically, leaving home often only takes place when entering a union to form a family (Reher 1998). In Eastern and Southern European countries, the elderly tend to live with adult children and other relatives to a much greater extent than what is typically found in Northern Europe (Brandt, Haberkern, and Szydlik 2009; Hank 2007; Isengard and Szydlik 2012).
likely to have never married, whereas women live alone to a greater extent following a divorce or the death of a spouse (Demey et al. 2013; McKie and Cunningham-Burley 2005). The pathways into living alone are also associated with different re-partnering risks between men and women, where men re-partner more frequently than women (Kreidl and Hubatková 2017; Brown et al. 2019; Demey et al. 2013). Previous research has also shown that men are more likely to live alone up to their fifties and sixties, but after this the gender pattern is reversed with more women living alone than men (Iacovou and Skew 2011; Jamieson, Wasoff, and Simpson 2009; Reher and Requena 2018). The fact that women of older ages live alone to a greater extent than men has been seen in almost all European countries (Iacovou and Skew 2011; Fokkema and Liefbroer 2008; Gierveld, Dykstra, and Schenk 2012) and can be explained by differences in spousal age gaps and life expectancy (Demey et al. 2013; Iacovou and Skew 2011; Fokkema and Liefbroer 2008). Further, the proportion of women living alone in later life have increased over time in most European countries, even in societies with traditionally strong family ties, like Spain (Reher and Requena 2017).
2. Data and method
The source material for this study comprises data from Wave 1 of the Generations and Gender Survey (GGS) collected between 2002 and 2013. In our analysis, we have selected the 12 European countries that have available data: Sweden, the Netherlands, France, Belgium, Germany, Poland, Hungary, Romania, Bulgaria, Estonia, Austria, and Italy. Even though the GGS included more countries, a couple of countries were excluded from the analysis based on (1) small sample size in the relevant age-span (e.g., fewer than 3,000 individuals) and/or (2) having an incompatible household scheme (Russia). For our purpose, there are some shortcomings in the GGS data. First, besides Sweden, the GGS lacks data from more countries representing the Nordic region, and only Italy represents the South/Mediterranean area, although it is a strength that the data represent a wide range of countries in Western, Central, and Eastern Europe. This makes it possible to gain a good picture of how the association between education and single living varies across all the main sub-regions of Europe that are usually defined based on various political, historical, or cultural criteria.
In order to analyze between-country differences in gender equality, we have organized the analysis of the countries according to their values on the World Economic Forum’s Global Gender Gap Index, ranging from highest (Sweden) to lowest (Italy) (Table 1).
Table 1: Number of cases, survey period, and Gender Gap Index for the included countries, individuals aged 30–64 years
Country N Survey period Gender Gap Index
Sweden 5,864 2012–2013 0.812 Germany 6,392 2005–2005 0.750 Netherlands 5,787 2002–2004 0.739 Belgium 4,752 2008–2010 0.722 Austria 3,167 2008–2009 0.706 Estonia 4,893 2004–2005 0.703 Bulgaria 7,881 2004–2004 0.702 France 6,491 2005–2005 0.701 Poland 12,527 2010–2011 0.691 Romania 7,743 2005–2005 0.681 Hungary 8,487 2004–2005 0.678 Italy 8,034 2003–2003 0.666
Source:Gender and Generations Survey Wave 1 (http://www.ggp-i.org/data/) and WEF – Global Gender Gap Report 2006–2010.
estimates of relative frequencies were weighted using the country-specific analytical weights provided in the GGS data to account for recruitment biases in certain groups (Simard and Franklin 2005). The estimated probabilities of living alone were calculated using logistic regression models, estimating odds ratios with 95% confidence intervals. In the case of the logistic regression analysis, we chose not to include weights in the analysis because the GGS data do not provide probability weights, which would be the appropriate method to apply in logistic regression. Also, the influence of weighting on parameter estimates in logistic regression is expected to be much less important than in prevalence calculations (Fokkema et al. 2016). This is confirmed by our analysis showing that the inclusion of analytical weights in the regression through the iweight
option in Stata essentially has no impact on the estimated proportions given by the logistic regression analysis (StataCorp 2017).
2.1 The variables
Living arrangements: In this paper we differentiate between living arrangements as ‘living alone,’ ‘living as a lone parent/single parent,’ ‘living with parents,’ ‘living as a couple,’ ‘living as a couple with children’ (hereafter referred to as ‘nuclear’), and ‘other.’ ‘Other’ living arrangements included individuals living with grandparents or great-grandparents or living with siblings. A similar categorization was used by Fokkema and Liefbroer (Fokkema and Liefbroer 2008).
Working age was categorized in five-year age categories as 30–34, 35–39, 40–44, 45–49, 50–54, 55–59, and 60–64 years. Unfortunately, the Austrian sample did not include respondents aged 50 years and older. Thus, some caution should be exercised when comparing Austria with the other countries.
For education, we used the International Standard Classification of Education as indicator of the respondent’s highest level of education, which was categorized as ‘low’ (ISCED 0–2), ‘middle’ (ISCED 3–4), or ‘high’ (ISCED 5–6).
2.2 Method
the form of estimated probabilities for different levels of education (Figures 2–4 in the results section).
Our main outcome refers to being the sole person living in the household, and thus we do not include single parents residing with children in the category of one-person households. However, we do control for the individual’s parental status in our regression analysis to get estimates of the probability to be a one-person household for individuals with different levels of education net of the differences in parental status. The distribution of all included variables for each country is shown in Table A-1 in the appendix with the addition of marital status that we choose to not control for in our models. The reason for excluding the marital status is that being married perfectly, or nearly perfectly, predicts the outcome in many of the included countries.
3. Results
3.1 Living arrangements in Europe
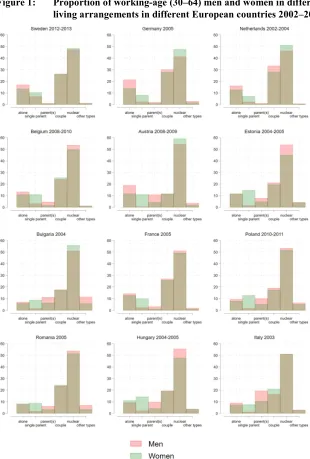
Figure 1: Proportion of working-age (30–64) men and women in different living arrangements in different European countries 2002–2013
In both Eastern and Southern Europe, levels of single living are considerably lower than in Northern European countries and, in most cases, living in the parental home is a more common living arrangement than living alone in an independent household. In this respect, Italy stands out in terms of a similar share of the population living in the parental home and as a couple with no children, making it the third most common living arrangement in the country.
In Eastern Europe, living alone is even less common, reaching around or even below 10% of the population aged 30–64 years in Romania, Bulgaria, Hungary, and Poland. Among all countries, living alone is the least common living arrangement in Bulgaria, which also has the highest proportion of those living in ‘other types’ of living arrangements. Generally, in these Eastern European countries, living as a single parent is more common than living alone, and a significantly higher proportion of single living parents are women. This higher proportion of single mothers in Bulgaria, Poland, Hungary, Italy, and Austria is combined with a higher proportion of males living in their parental homes. In all of the countries except Hungary, Romania, and Estonia, living alone is more frequent among men, and the difference between the genders is most pronounced in Germany, followed by Austria. In the case of Austria this pattern is the result of not including individuals aged 50–64 where living alone is more common among women.
3.2 Living alone in Europe by age group and gender
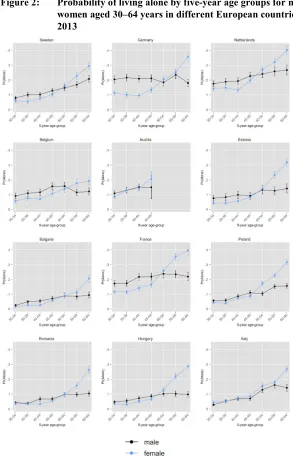
Figure 2: Probability of living alone by five-year age groups for men and women aged 30–64 years in different European countries from 2002– 2013
Generally, for countries that score low values in the gender gap index, the proportion of those living alone among the youngest age group is very low. Typical examples of this pattern in our sample are Bulgaria, Poland, Romania, and Italy. This is likely the result of a delayed age at which an individual leaves their parental home, as indicated by Figure 1, which shows the highest levels of coresidence with parents in Italy as well as in Bulgaria and Poland.
3.3 Living alone in Europe by level of education and gender
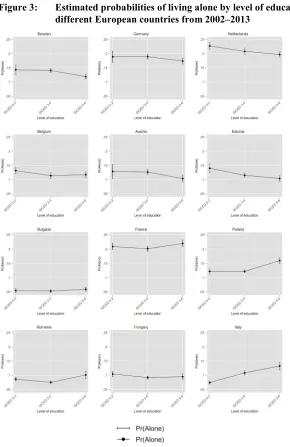
Figure 3: Estimated probabilities of living alone by level of education in different European countries from 2002–2013
Source: Gender and Generations Survey Wave 1 (http://www.ggp-i.org/data/).
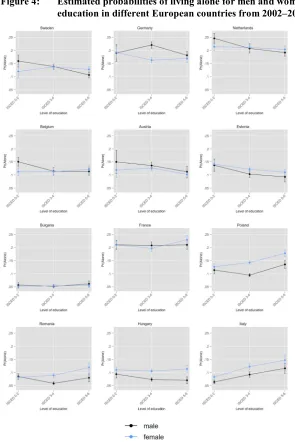
Figure 4: Estimated probabilities of living alone for men and women by level of education in different European countries from 2002–2013
Source: Gender and Generations Survey Wave 1 (http://www.ggp-i.org/data/).
In Figure 4, we control for differences in age distribution and parental status and present the estimated probabilities of living alone for men and women respectively, with different levels of education. Generally, the more gender equal countries – Sweden, Belgium, the Netherlands, and Austria – are characterized by a converging gender pattern according to level of education. In these countries, the greatest gender differences are found among individuals in the low education category, in which women show a significantly lower probability of living alone compared to men. The difference between low educated men and women is, however, only statistically significant in Belgium. The main reason for the difference between low educated men and women in these more gender equal countries is that single motherhood is more concentrated on the low educated group.
Continuing with the less gender equal countries, women generally have higher probabilities of living alone compared to their male counterparts, particularly in Poland, Romania, Hungary, and Italy. In Estonia, the educational difference in living alone by gender follows the more gender equal countries in terms of being negative. In Bulgaria and France, with medium levels of gender equality according to the gender gap index, there is no effect of education and both men and women exhibit similar probabilities of living alone across all levels of education. With the exception of Hungary, all of the countries that score at the lower end of the gender gap index – Poland, Romania, and Italy – exhibit a substantial positive educational gradient of living alone among women. In Italy, which scores the lowest values of gender equality, the positive gradient is clearly present for both highly educated men and women who are much more likely to live alone than the lowest educated.
4. Conclusions
Our study has revealed the association between education and living alone among the working-age population in 12 European countries. As expected, living alone is much more common in Northern and Western Europe than in Eastern and Southern Europe (Esping-Andersen 2016; Fokkema and Liefbroer 2008; Iacovou and Skew 2011; Kaufmann 1994; Sobotka and Toulemon 2008; Stella 2017). As found in previous research, the highest rates of living alone in the working-age population are found in the Northern European countries. Germany, Sweden, and the Netherlands stand out as having high unadjusted rates (Fokkema and Liefbroer 2008).
A general pattern is that living alone in the mid-aged groups between 30–50 years is substantially higher in the more gender equal Northern European countries than in less gender equal countries in Southern and Eastern Europe, both in descriptive rates and when we control for differences in the age structure and parental status. In this younger mid-aged group, the gender differences tend to be minor, and living alone is slightly lower among women than men, especially in the more gender equal countries with the exception of Germany, which exhibits larger gender disparities in this age-span. In the age span from 50–64 years the share of women living alone increases more rapidly than among men in all countries, but the shift to a surplus of women living alone tends to be somewhat more pronounced in the less gender equal countries.
Regarding the educational gradient of living alone, the pattern that stands out is a tendency for a small though, in several cases, significant negative association between education and the probability of living alone in the more gender equal countries in Northern Europe, such as in Sweden, the Netherlands, and Belgium. In less gender equal countries in Southern and Eastern Europe, we find a tendency for an opposite positive association in which living alone is more common in the more highly educated groups.
A significant and strongly positive educational gradient of living alone for both genders was found for the country that scored the lowest value on the gender gap index, namely Italy. It is clear that the positive educational gradient of living alone in less gender equal countries is driven to a greater extent by women than men, where we have a clearly significant positive gradient for women in Poland, Romania, and Italy.
In terms of gender differences, the high proportion of women in Eastern European countries above the age of 50 who live alone relative to men is a particularly interesting topic for further research. Women living alone in this age span are found to be more economically disadvantaged and more often childless than women living alone in earlier midlife, resulting in different levels of informal support and access to care later in life (Gierveld, Dykstra, and Schenk 2012; Hansen and Slagsvold 2016).
The results of this analysis fit with the suggestion that a demographic reversal has occurred in more gender equal countries, with a resurgence of the family (higher fertility, lower divorce rate, etc.) among more highly educated women (Esping-Andersen 2016). In such countries, a number of studies suggest that less educated women appear to be experiencing less favorable family outcomes than their highly educated counterparts (Esping-Andersen 2016). In our study, we find no evidence of a positive educational gradient of living alone among mid-aged women in the more gender egalitarian Northern European countries. When we include single parents in the category of one-person households, the gradient becomes clearly negative in the most gender equal countries. In comparison, a positive gradient is evident in the least gender equal countries, especially among women in countries such as Poland, Romania, and in Italy in particular, which score the lowest values in our sample on the Global Gender Gap Index.
The North–South disparities in family dynamics that have evolved since the turn of the millennium have inspired the U-shape hypothesis that postulates that the breakthrough in gender equality has had an initial negative effect on family formation and cohesion. However, over time, this negative effect has decreased and even disappeared to the extent that policy and labor market structures, as well as male attitudes to gender equality in the private sphere, are able to adapt to the new economic roles of women (Goldscheider, Bernhardt, and Lappegård 2015; Esping-Andersen and Billari 2015; Anderson and Kohler 2015; Arpino, Esping-Andersen, and Pessin 2015).
gender regime when gender egalitarian values have not yet achieved a ‘dominant normative status’ and women with higher human capital still experience difficulties combining family life with the desire to pursue a career. In comparison, in the more gender equal countries in Northern Europe, highly educated women experience less role conflicts, as both institutions and male norms are more in tune with a dual provider model. Here both men and women holding a lower educational level might be perceived as less attractive partners with uncertain prospects, especially seen among lower educated men in Northern and Western Europe (Oppenheimer 2003). Third, it is possible that in more gender equal countries where role conflicts are less strong in dual earner couples, marriage and a more traditional family life has been re-valued as a symbol of prestige and personal achievement among higher educated individuals in Northern and Western Europe (Cherlin 2004, 2010). However, it should be noted that it is primarily the positive educational gradient of living alone for women in the least gender equal that stands out clearly in our study. We do not see a clear negative gradient of living alone for women even in the most gender equal countries in the North when we exclude single parents. Because children more often reside with women after divorce and separation and living as a single parent is more common among women with low levels of education, the negative association between education and living alone in Northern Europe is attenuated for women who are not parents. However, it should be noted that when women who live as single parents are included in the one-person household category, the educational gradient becomes clearly negative for both genders in the most gender equal countries, and the positive gradient in the lest gender equal countries remain unaffected.
However, a limitation of this study is that we are only able to look at the associations between education and living alone among men and women in different societies in Europe at a specific point in time that covers the latter years of the first decade of the millennium. To fully understand how family dynamics are changing in this respect, we need to study living arrangements in different educational strata over longer periods of time and include more countries than the present study. This will allow comparisons regarding how the educational gradient of living alone is changing over time within different countries. It would also be very useful to expand the number of countries involved in the analysis in order to enhance the possibilities of drawing firm conclusions about how the level of gender equality relates to educational differentials in living arrangements across educational strata. What is particularly required is the inclusion of more countries that represent the Nordic and Southern European clusters, which are only represented by Sweden and Italy in our sample.
into living alone differ by gender, partnership histories, parenthood, and socioeconomic resources (Jamieson, Wasoff, and Simpson 2009; Iacovou and Skew 2011; Goldscheider, Bernhardt, and Lappegård 2015; Giuliano 2007; Gaymu et al. 2006). The heterogeneity among those living alone by gender, age, and educational level found in this cross-sectional study implies the need to use longitudinal data to increase understanding of pathways into single living as well as the consequences (social, economic, and health) for different groups of one-person households and how this relates to societal differences and the prevailing gender regime.
References
Anderson, T. and Kohler, H.P. (2015). Low fertility, socioeconomic development, and gender equity. Population and Development Review 41(3): 381–407.
doi:10.1111/j.1728-4457.2015.00065.x.
Arpino, B., Esping-Andersen, G., and Pessin, L. (2015). How do changes in gender role attitudes towards female employment influence fertility? A macro-level analysis.
European Sociological Review 31(3): 370–382.doi:10.1093/esr/jcv002.
Bellani, D., Esping-Andersen, G., and Nedoluzhko, L. (2017). Never partnered: A multilevel analysis of lifelong singlehood. Demographic Research 37(4): 53–
100.doi:10.4054/DemRes.2017.37.4.
Berkman, L.F., Zheng, Y.H., Glymour, M.M., Avendano, M., Börsch-Supan, A., and Sabbath, E.L. (2015). Mothering alone: Cross-national comparisons of later-life disability and health among women who were single mothers. Journal of Epidemiology and Community Health 69(9): 865–872. doi:10.1136/jech-2014-205149.
Boschini, A. and Sundström, M. (2018). Det ojämlika faderskapet [The unequal fatherhood].Ekonomisk Debatt 46(4): 33–42.
Brandt, M., Haberkern, K., and Szydlik, M. (2009). Intergenerational help and care in Europe.European Sociological Review 25(5): 585–601.doi:10.1093/esr/jcn076.
Brown, S.L., Lin, I.F., Hammersmith, A.M., and Wright, M.R. (2019). Repartnering following gray divorce: The roles of resources and constraints for women and men.Demography 56(2): 503–523.doi:10.1007/s13524-018-0752-x.
Brunner, E.J., Shipley, M.J., Ahmadi-Abhari, S., Valencia Hernandez, C., Abell, J.G., Singh-Manoux, A., Kawachi, I., and Kivimaki, M. (2018). Midlife contributors to socioeconomic differences in frailty during later life: A prospective cohort study. The Lancet Public Health 3(7): e313–e322. doi:10.1016/S2468-2667 (18)30079-3.
Chandler, J., Williams, M., Maconachie, M., Collett, T., and Dodgeon, B. (2004). Living alone: Its place in household formation and change. Sociological Research Online 9(3): 1–13.doi:10.5153/sro.971.
Cherlin, A.J. (2010). Demographic trends in the United States: A review of research in the 2000s.Journal of Marriage and Family 72(3): 403–419. doi:10.1111/j.1741-3737.2010.00710.x.
Demey, D., Berrington, A., Evandrou, M., and Falkingham, J. (2013). Pathways into living alone in mid-life: Diversity and policy implications. Advances in Life Course Research 18(3): 161–174.doi:10.1016/j.alcr.2013.02.001.
Esping-Andersen, G. (2016).Families in the 21st century. Stockholm: SNS Förlag.
Esping-Andersen, G. and Billari, F.C. (2015). Re-theorizing family demographics.
Population and Development Review 41(1): 1–31. doi:10.1111/j.1728-4457. 2015.00024.x.
Eurostat (2018). Mean age at first marriage by sex [electronic resource]. Luxembourg: Eurostat.http://ec.europa.eu/eurostat/web/products-datasets/-/tps00014.
Fokkema, T. and Liefbroer, A.C. (2008). Trends in living arrangements in Europe: Convergence or divergence? Demographic Research 19(36): 1351–1418.
doi:10.4054/DemRes.2008.19.36.
Fokkema, T., Kveder, A., Hiekel, N., Emery, T., and Liefbroer, A.C. (2016). Generations and Gender Programme Wave 1 data collection: An overview and assessment of sampling and fieldwork methods, weighting procedures, and cross-sectional representativeness. Demographic Research 34(18): 499–524.
doi:10.4054/DemRes.2016.34.18.
Gaymu, J. and Springer, S. (2012). How does living alone or with a partner influence life satisfaction among older men and women in Europe?Population 67(1): 43–
69.doi:10.3917/pope.1201.0043.
Gaymu, J., Delbes, C., Springer, S., Binet, A., Desesquelles, A., Kalogirou, S., and Ziegler, U. (2006). Determinants of the living arrangements of older people in Europe.European Journal of Population 22(3): 241–262. doi:10.1007/s10680-006-9004-7.
Gierveld, J.D., Dykstra, P.A., and Schenk, N. (2012). Living arrangements, intergenerational support types and older adult loneliness in Eastern and Western Europe. Demographic Research 27(7): 167–199. doi:10.4054/DemRes.2012. 27.7.
Giuliano, P. (2007). Living arrangements in Western Europe: Does cultural origin matter? Journal of the European Economic Association 5(5): 927–952.
Goldscheider, F., Bernhardt, E., and Lappegård, T. (2015). The gender revolution: A framework for understanding changing family and demographic behavior.
Population and Development Review 41(2): 207–239.doi:10.1111/j.1728-4457. 2015.00045.x.
Hank, K. (2007). Proximity and contacts between older parents and their children: A European comparison. Journal of Marriage and Family 69(1): 157–173.
doi:10.1111/j.1741-3737.2006.00351.x.
Hansen, T. and Slagsvold, B. (2016). Late-life loneliness in 11 European countries: Results from the generations and gender survey. Social Indicators Research
129(1): 445–464.doi:10.1007/s11205-015-1111-6.
Iacovou, M. and Skew, A.J. (2011). Household composition across the new Europe: Where do the new member states fit in? Demographic Research 25(14): 465–
489.doi:10.4054/DemRes.2011.25.14.
Isengard, B. and Szydlik, M. (2012). Living apart (or) together? Coresidence of elderly parents and their adult children in Europe. Research on Aging 34(4): 449–474.
doi:10.1177/0164027511428455.
Jamieson, L. and Simpson, R. (2013). Living alone: Globalization, identity and belonging. Basingstoke: Palgrave Macmillan.doi:10.1057/9781137318527.
Jamieson, L., Wasoff, F., and Simpson, R. (2009). Solo-living, demographic and family change: The need to know more about men.Sociological Research Online 14(2): 1–16.doi:10.5153/sro.1888.
Kaufmann, J.C. (1994). One-person household in Europe. Population 49(4–5): 935–
958.doi:10.2307/1533664.
Klinenberg, E. (2012). Going solo: The extraordinary rise and surprising appeal of living alone. New York: Penguin Press.
Kreidl, M. and Hubatková, B. (2017). Rising rates of cohabitation and the odds of repartnering: Does the gap between men and women disappear? Journal of Divorce and Remarriage 58(7): 487–506.doi:10.1080/10502556.2017.1343580.
Lesthaeghe, R. (2011). The ‘second demographic transition’: A conceptual map for the understanding of late modern demographic developments in fertility and family formation. Historical Social Research 36(2): 179–218. doi:10.12759/hsr.36.
2011.2.179-218.
Mandic, S. (2008). Home-leaving and its structural determinants in Western and Eastern Europe: An exploratory study. Housing Studies 23(4): 615–636.
doi:10.1080/02673030802112754.
McKie, L. and Cunningham-Burley, S. (2005). Families in society: Boundaries and relationships. Bristol: Policy Press.doi:10.2307/j.ctt9qgm6r.
Murie, A. and Musterd, S. (2004). Social exclusion and opportunity structures in European cities and neighbourhoods. Urban Studies 41(8): 1441–1459.
doi:10.1080/0042098042000226948.
Ongaro, F., Mazzuco, S., and Meggiolaro, S. (2009). Economic consequences of union dissolution in Italy: Findings from the European Community Household Panel.
European Journal of Population 25(1): 45–65.doi:10.1007/s10680-008-9157-7.
Oppenheimer, V.K. (2003). Cohabiting and marriage during young men’s career-development process.Demography 40(1): 127–149.doi:10.2307/3180815.
Reher, D. (1998). Family ties in Western Europe: Persistent contrasts.Population and Development Review 24(2): 203–234.doi:10.2307/2807972.
Reher, D. and Requena, M. (2017). Elderly women living alone in Spain: The importance of having children. European Journal of Ageing 14(3): 311–322.
doi:10.1007/s10433-017-0415-6.
Reher, D. and Requena, M. (2018). Living alone in later life: A global perspective.
Population and Development Review 44(3): 427–454.doi:10.1111/padr.12149.
Schwanitz, K. and Mulder, C.H. (2015). Living arrangements of young adults in Europe. Comparative Population Studies 40(4): 367–398.
doi:10.12765/CPoS-2015-14en.
Simard, M. and Franklin, S. (2005). Sample design guidelines. In: United Nations (ed.). Generations and Gender Programme: Survey instruments. New York: United Nations: 5–14.
StataCorp (2017).Stata user’s guide: Release 15. College Station: Stata Press.
Appendix
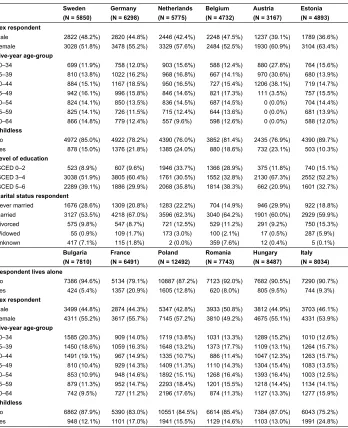
Table A-1: Descriptive statistics
Sweden Germany Netherlands Belgium Austria Estonia (N = 5850) (N = 6298) (N = 5775) (N = 4732) (N = 3167) (N = 4893) Sex respondent
Male 2822 (48.2%) 2820 (44.8%) 2446 (42.4%) 2248 (47.5%) 1237 (39.1%) 1789 (36.6%) Female 3028 (51.8%) 3478 (55.2%) 3329 (57.6%) 2484 (52.5%) 1930 (60.9%) 3104 (63.4%)
Five-year age-group
30–34 699 (11.9%) 758 (12.0%) 903 (15.6%) 588 (12.4%) 880 (27.8%) 764 (15.6%) 35–39 810 (13.8%) 1022 (16.2%) 968 (16.8%) 667 (14.1%) 970 (30.6%) 680 (13.9%) 40–44 884 (15.1%) 1167 (18.5%) 950 (16.5%) 727 (15.4%) 1206 (38.1%) 719 (14.7%) 45–49 942 (16.1%) 996 (15.8%) 846 (14.6%) 821 (17.3%) 111 (3.5%) 757 (15.5%) 50–54 824 (14.1%) 850 (13.5%) 836 (14.5%) 687 (14.5%) 0 (0.0%) 704 (14.4%) 55–59 825 (14.1%) 726 (11.5%) 715 (12.4%) 644 (13.6%) 0 (0.0%) 681 (13.9%) 60–64 866 (14.8%) 779 (12.4%) 557 (9.6%) 598 (12.6%) 0 (0.0%) 588 (12.0%)
Childless
No 4972 (85.0%) 4922 (78.2%) 4390 (76.0%) 3852 (81.4%) 2435 (76.9%) 4390 (89.7%) Yes 878 (15.0%) 1376 (21.8%) 1385 (24.0%) 880 (18.6%) 732 (23.1%) 503 (10.3%)
Level of education
ISCED 0–2 523 (8.9%) 607 (9.6%) 1946 (33.7%) 1366 (28.9%) 375 (11.8%) 740 (15.1%) ISCED 3–4 3038 (51.9%) 3805 (60.4%) 1761 (30.5%) 1552 (32.8%) 2130 (67.3%) 2552 (52.2%) ISCED 5–6 2289 (39.1%) 1886 (29.9%) 2068 (35.8%) 1814 (38.3%) 662 (20.9%) 1601 (32.7%)
Marital status respondent
Never married 1676 (28.6%) 1309 (20.8%) 1283 (22.2%) 704 (14.9%) 946 (29.9%) 922 (18.8%) Married 3127 (53.5%) 4218 (67.0%) 3596 (62.3%) 3040 (64.2%) 1901 (60.0%) 2929 (59.9%) Divorced 575 (9.8%) 547 (8.7%) 721 (12.5%) 529 (11.2%) 291 (9.2%) 750 (15.3%) Widowed 55 (0.9%) 109 (1.7%) 173 (3.0%) 100 (2.1%) 17 (0.5%) 287 (5.9%) Unknown 417 (7.1%) 115 (1.8%) 2 (0.0%) 359 (7.6%) 12 (0.4%) 5 (0.1%)
Bulgaria France Poland Romania Hungary Italy (N = 7810) (N = 6491) (N = 12492) (N = 7743) (N = 8487) (N = 8034) Respondent lives alone
No 7386 (94.6%) 5134 (79.1%) 10887 (87.2%) 7123 (92.0%) 7682 (90.5%) 7290 (90.7%) Yes 424 (5.4%) 1357 (20.9%) 1605 (12.8%) 620 (8.0%) 805 (9.5%) 744 (9.3%)
Sex respondent
Male 3499 (44.8%) 2874 (44.3%) 5347 (42.8%) 3933 (50.8%) 3812 (44.9%) 3703 (46.1%) Female 4311 (55.2%) 3617 (55.7%) 7145 (57.2%) 3810 (49.2%) 4675 (55.1%) 4331 (53.9%)
Five-year age-group
30–34 1585 (20.3%) 909 (14.0%) 1719 (13.8%) 1031 (13.3%) 1289 (15.2%) 1010 (12.6%) 35–39 1450 (18.6%) 1059 (16.3%) 1648 (13.2%) 1373 (17.7%) 1109 (13.1%) 1264 (15.7%) 40–44 1491 (19.1%) 967 (14.9%) 1335 (10.7%) 886 (11.4%) 1047 (12.3%) 1263 (15.7%) 45–49 810 (10.4%) 929 (14.3%) 1409 (11.3%) 1110 (14.3%) 1304 (15.4%) 1083 (13.5%) 50–54 853 (10.9%) 948 (14.6%) 1892 (15.1%) 1268 (16.4%) 1393 (16.4%) 1003 (12.5%) 55–59 879 (11.3%) 952 (14.7%) 2293 (18.4%) 1201 (15.5%) 1218 (14.4%) 1134 (14.1%) 60–64 742 (9.5%) 727 (11.2%) 2196 (17.6%) 874 (11.3%) 1127 (13.3%) 1277 (15.9%)
Childless
Table A-1: (Continued)
Bulgaria France Poland Romania Hungary Italy (N = 7810) (N = 6491) (N = 12492) (N = 7743) (N = 8487) (N = 8034) Level of education
ISCED 0–2 1768 (22.6%) 1876 (28.9%) 1641 (13.1%) 2541 (32.8%) 1832 (21.6%) 4243 (52.8%) ISCED 3–4 4226 (54.1%) 2781 (42.8%) 8361 (66.9%) 4365 (56.4%) 5197 (61.2%) 2866 (35.7%) ISCED 5–6 1816 (23.3%) 1834 (28.3%) 2490 (19.9%) 837 (10.8%) 1458 (17.2%) 925 (11.5%)
Marital status respondent
Never married 1107 (14.2%) 1520 (23.4%) 1654 (13.2%) 757 (9.8%) 888 (10.5%) 1530 (19.0%) Married 5800 (74.3%) 3765 (58.0%) 8815 (70.6%) 6044 (78.1%) 5878 (69.3%) 5956 (74.1%) Divorced 497 (6.4%) 1023 (15.8%) 1091 (8.7%) 477 (6.2%) 956 (11.3%) 187 (2.3%) Widowed 272 (3.5%) 183 (2.8%) 911 (7.3%) 460 (5.9%) 559 (6.6%) 302 (3.8%) Unknown 134 (1.7%) 0 (0.0%) 21 (0.2%) 5 (0.1%) 206 (2.4%) 59 (0.7%) Source:Gender and Generations Survey Wave 1 (http://www.ggp-i.org/data/).
Table A-2: Logistic regressions of probability to live alone in 12 European countries, individuals aged 30–65 years
Variables Sweden GermanyNetherlands Belgium Austria EstoniaBulgaria France Poland Romania HungaryItaly Sex respondent
Female 0.59 0.56 0.41*** 0.42* 0.14*** 0.36** 0.48 0.37***0.47** 0.80 0.43* 1.10
Five-year age-group
35–39 1.45 1.09 1.12 1.26 1.28 1.12 2.12** 1.02 1.05 0.89 1.18 2.01** 40–44 1.48 1.03 1.17 1.37 1.57* 1.36 2.41*** 1.45* 1.64* 1.76* 1.63* 2.77*** 45–49 2.17** 1.05 1.54* 2.05** 1.55 1.25 3.33*** 1.47* 2.22*** 1.77* 1.98** 2.87*** 50–54 2.76*** 0.86 1.70** 2.08** . 1.95* 4.43*** 1.69** 2.07*** 2.87*** 2.44*** 6.20*** 55–59 3.58*** 1.25 1.94** 1.35 . 1.84* 4.16*** 1.65** 3.37*** 2.82*** 2.46*** 8.55*** 60–64 5.32*** 0.83 2.06** 1.46 . 2.12* 4.80*** 1.47 3.49*** 3.11*** 2.34*** 7.11***
Childless
Yes 30.95*** 7.97*** 13.07*** 9.07*** 11.02*** 5.84*** 12.25*** 12.79***6.15*** 12.53*** 7.20*** 9.30***
Level of education
ISCED 3–4 0.79 1.25 0.75* 0.69* 0.87 0.71 0.90 0.98 0.80 0.63** 0.75 1.56** ISCED 5–6 0.52** 0.93 0.66** 0.68* 0.67 0.63* 1.10 1.00 1.24 0.93 0.71 2.09***
Education * Sex
ISCED 3–4 * female 1.55 0.62 1.31 1.46 1.31 1.15 1.15 0.91 1.48* 1.76** 1.25 1.09 ISCED 5–6 * female 2.12* 0.88 1.39 1.62* 1.16 1.13 0.99 1.18 1.31 1.77 1.46 1.06
Age-group * Sex
35–39 * female 0.64 0.78 0.96 1.12 1.59 0.90 0.90 0.98 0.86 1.00 0.75 0.57 40–44 * female 0.93 0.77 0.77 0.92 1.57 1.00 0.80 0.96 1.14 0.50 0.95 0.65 45–49 * female 0.95 1.20 1.17 1.04 3.71 1.71 1.41 1.26 1.01 0.87 1.11 0.78 50–54 * female 1.45 2.67*** 2.03* 1.45 . 2.23* 1.89 2.62***2.72*** 1.04 2.10* 0.86 55–59 * female 2.05* 2.57*** 2.60** 3.17** . 5.05*** 2.78* 5.09***2.51*** 1.99 4.62*** 0.77 60–64 * female 2.21* 7.33*** 4.12*** 3.33** . 7.22*** 5.71*** 7.26***4.14*** 3.83*** 7.57*** 1.97
Childless * Sex