98 | P a g e Website: www.mjbas.com
Petrophysical and Reservoir Studies of Aba-1 Well, Niger Delta, Nigeria
Adiela, U.P and Ayodele Moses
Article Received: 30 November 2017 Article Accepted: 27 January 20178 Article Published: 26 March 2018
1. INTRODUCTION
Reyment (1960 & 1965) described the stratigraphy of the different depositional basins in Nigeria and created a
large number of lithostratigraphic and biostratigraphic divisions. Murat (1970) presented a paleogeographic
description of the Cretaceous and Lower Tertiary in Southern Nigeria based on major depositional cycles resulting
from three main tectonic episodes. Carter, Barber and Tait (1963), Jones (1964), Adeleye and Dessavagie (1970),
Kogbe (1972), Adegoke et al., (1978), Petters (1978), Alix (1983), Popoff et al.(1983), Whiteman (1982),
Benkhelil and Guiraud (1980), Benkhelil (1982 & 1986), Allen (1963, 1964, 1965 & 1980) and others have
described the stratigraphy and paleogeography of individual or part of different sedimentary basins in the country.
Location of the study Area
The Niger Delta is a prograding depositional complex within the Cenozoic formation of Southern Nigeria. It is
situated between longitudes 30 and 90 E and latitudes 40 and 60 N (Fig. 1). It is a prolific oil province where one
petroleum system, the Tertiary Niger Delta (Akata-Agbada) petroleum system has been identified and is one of the A B S T R A C T
The quality of the reservoirs in terms of porosity, permeability decreases down the depth. Therefore, it can be concluded that the hydrocarbon
potential and productivity of the reservoir sands can be classified in decreasing order of arrangement as A, B and C. The reservoir A in well Bonn
007, 009, 013, 015, 017 and 019 is the best in terms of hydrocarbon production and hydrocarbon in such wells can easily migrate to the wellbore as
compared to other two reservoirs..
largest in the West African sub-region (Fig. 2). Reservoirs in the Niger-Delta exhibit a wide range of complexities
in their sedimentological and petrophysical characteristics. This research is aimed at evaluating the reservoir
potential of X-field
.
2.STRATIGRAPHYOF NIGERDELTA
The Akata Formation is the under compacted, over pressured, marine prodeltamegafacies of the Niger Delta
basin. It is composed mainly of marine shale with occasional turbidite sandstone and siltstone (Short and Stauble,
1967). The thickness ranges from 600m to over 6000m and depends on the shale diapirism. It is thought to be the
sources rock of the Niger delta complex. Abundance of planktonic foraminifera assemblage indicates deposition of
the Akata shale on a shallow marine environment (Whiteman 1982).
Figure 1.Stratigraphic section of the Niger Delta adopted from Doust, 1990
The Agbada Formation underlies the Benin formation and consists of interbeded fluviomarine sands, sandstones
and siltstone of various proportion and thickness representing cyclic sequence of off lap unit (Weber, 1971).
Texturally the sandstone vary from coarse to fine grained, poorly to very well sorted, unconsolidated to slightly
consolidated. Lignite streak and limonite coating occur with some shell fragment and glauconitic (Short and
Stauble, 1967). The shale are medium to dark grey, fairly consolidated and silty with localized glauconitc.
Shaliness increases downward and the formation passes gradually into the Akata formation
The Benin Formation is the Topmost unit, composed of fluviatile gravel and sands. It is described as the coastal
100
The deposit is predominantly continental in origin and consist of massive, highly porous, fresh water bearing
sandstones with little shale intercalation which increases toward the base of the formation.
3. METHODOLOGY
The different logs used for the research work are Gamma ray log, Resistivity logs, Compensated Bulk Density log
and Porosity log. The wireline logs were used in the interpretation and calculation of the various functions and
parameters of the reservoir sands as described below.
Gamma Ray logs Shale usually contains small quantity of radioactive elements such as uranium (U) potassium (k)
and thorium (TH). This produces gamma ray radiation from which the source can be detected by spectrometry. The
log thus, detects shale horizon and can provide an estimate of the clay content and other sedimentary rocks.
Amongst, the sediments, shales have by far the strongest radiation. That is why the log is called “Shale Log”.
Resistivity logs Resistivity is the specific resistance of a material to the flow of current (inverse of conductivity).
The resistivity of a formation depends on the electrical conductivity of the rock material within the formation, the
nature of formation water (fresh orsalt water), other fluids like oil or gas contained in it, the porosity and tortuosity
of the formation.
Generally, resistivity is high in porous rocks containing oil, gas or even fresh water because these fluids are
insulators. Oil and gas produce much higher kicks on the resistivity log and gas higher than that of oil kicks. Porous
rocks containing salt water (electrolyte) have low resistivity because it is conductive. Clay produces no kick on the
resistivity curve; the portion on the log with no resistivity kick is thus definitely shale and this is known as the shale
line
Density logs Density log makes used of artificial gamma ray from a radioactive source (e.g. “60Co and 137Cs) as a
continuous record of a formation bulk density. Bulk density is overall density of a rock including solid matrix and
fluid enclosed in the pores. Gamma photons collide elastically with electrons and are reduced in energy (Compton
Scattering). The number of collisions over any particular interval of time depends upon the abundance of electrons
present (electron density index) which in turns is the function of the formation.
Density is thus estimated by measuring the proportion of gamma radiation Compton Scattering. A deflection of
bulk density log to the right indicates high density compacted formation and deflections to the left indicates
low-density under-compacted formations. In hydrocarbon bearing reservoir sand, the bulk density reading is
usually higher in oil bearing zones and lower in gas bearing zones. Density is measured in grams per cubic
centimeter (g/cm3).
The compensated bulk density log has been used in this research to:
Determine the porosity values of sand bodies.
Draw the bed boundaries due to its good resolution.
Determine permeability from porosity and water saturation values.
Determine formation factor.
(a) Permeability (K)
Permeability is a measure of the ease with which a formation permits a fluid to flow through it. To be permeable a
rock must have interconnected porosity. Greater porosity usually corresponds to greater permeability but this is not
always in the case. The ability of a rock to transmit a single fluid when it is completely saturated with that fluid is
called absolute permeability while effective permeability refers to the ability of the rock to transmitted one fluid in
the presence of another fluid when the two fluids are immiscible.
4. RESULTS AND INTERPRETATION
The correlation was carried out based on the positions of the sands and shales on the well logs across the wells. The
gamma ray (GR) logs were the main logs used because they exhibit patterns that are easier to recognize and
correlate from well to well. The resistivity logs were then used to cross-check the correlation because individual
102
From the reservoir analysis, three reservoirs (A, B, C,) were observed and of which only reservoir A is correctable
across the six well. This implies that reservoir A is genetically equivalent laterally (in the same depositional
environment). But, the displacement of this reservoir in depth is probably as a result of synthetic fault.
5. PETROPHYSICAL RESULTS AND INTERPRETATION
Total of three hydrocarbon reservoirs were identified and evaluated. Reservoir A cuts across the six wells. (Bonn
007, Bonn 009, Bonn 013, Bonn 015, Bonn 017 and Bonn 019)
Reservoirs of well Aba -1 Both reservoirs A and C have hydrocarbon. In reservoir A, it is found at the interval of
5706 – 5831ft (1739-1777m) and has a gross (G) and net (N) thickness of sand, 125ft (38.1m) and 100.5ft (30.6m)
respectively, with N/G ratio of 0.80; water saturation (Sw) of 18% and hydrocarbon saturation (Sh) of 82%, porosity
((ø) and permeability (K) of 22% and 432md respectively while its transmissivity is 54000mdft (Table 4).
Therefore, the reservoir has good porosity and very good permeability.
In reservoir C, the hydrocarbon occurs at interval of 8376 – 8488ft (2553-2587m) and has a gross (G) and net (N)
thickness of sand, 112ft (34.1m) and 90ft (27.4m) respectively, with N/G ratio of 0.19; water saturation (Sw) of 19%
and hydrocarbon saturation (Sh) of 81%, porosity (ø), permeability (K) and transmissivity are 17%, 79.9md and
8949mdft respectively (Table 4). The reservoir C therefore, has both good porosity and permeability.
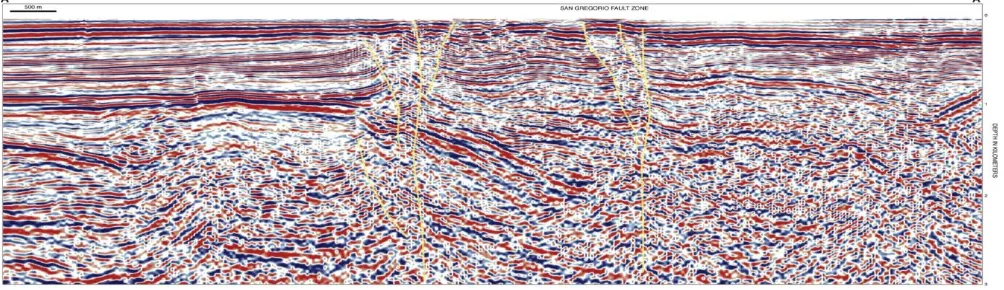
Figure 3: Seismic Trace of the study area
Reserviors of well Aba-2 Reservoir A occurs at the interval of 5579ft – 5699ft (1700-1737m) and has a gross (G)
and net (N) thickness of sand, 120ft (36.5m) and 109.5ft (33.4m) respectively, with N/G ratio of 0.9; water
saturation (Sw) of 19% and hydrocarbon saturation (Sh) of 81%, porosity (ø) and permeability (K) of 22% and
424.6md respectively. Its transmissivity is 50952mdft. Therefore, reservoir A has both very good porosity and
permeability. Reservoir B occurs at the interval of 5797 – 5887ft (1767-1794m) and has a gross (G) and net (N)
thickness of sand, 90ft (27.4m) and 81.5ft (24.8m) respectively, with N/G ratio of 0.9; water saturation (Sw) of 18%
and hydrocarbon saturation (Sh) of 82%, porosity (ø) and permeability (K) of 18% and 175.5md respectively. Its
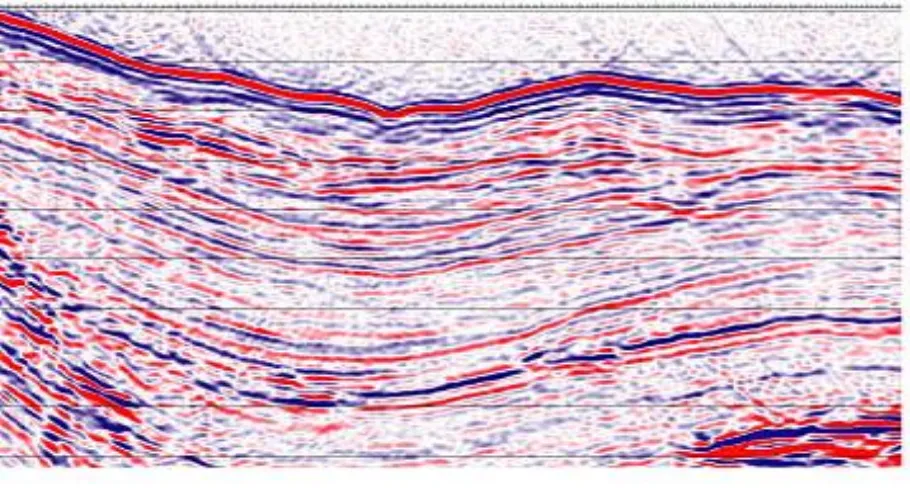
Figure 4; Seismic Trace of the study area
Porosity and Permeability
From the petrophysical values, both the porosity and permeability decreases down the depth Therefore, empirical
formulas can be generated to show the relationship between (1) depth and porosity, (2) depth and permeability.
These formulae can be derived from below:
Since the porosity varies inversely with depth (D) the relationship between porosity and depth can be written as
D
1
Let m represents the constant between depth and porosity.
Then, D =
m
---(16)
From the graph below, variables of depth (D) and porosity were taken and empirical formula between depth and
porosity can be derived in below:
In reservoir B, both porosity and permeability are very good. The hydrocarbon saturation ranges 86-70% while its
transmissivity is the second among the three reservoirs. Reservoir C has fair porosity and moderate permeability.
104
With these petrophysical values, the reservoirs of the study area can be said to be prolific in terms of hydrocarbon
production and they will produce water-free hydrocarbon due to the fact that all these reservoirs are homogenous
and at irreducible water saturation.
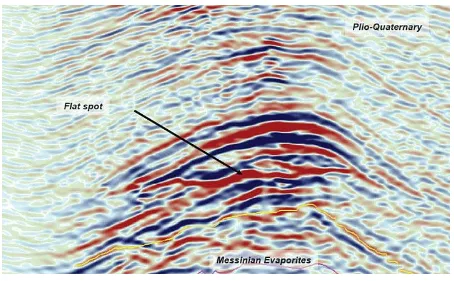
Figure 5: Seismic reflection attribute
The reservoirs bulk volume water (BVW) values calculated are close to constant, this indicates that the reservoir
are homogenous and at irreducible water saturation. Therefore, reservoirs can produce water – free hydrocarbon.
When a reservoir is at irreducible water saturation, water saturation (Sw) will not move because it is held on grains
by capillary pressure. The petrophysical parameters show a gradual decrease from the top to bottom of the wells,
reflecting increase in compaction with depth. The porosity, permeability and transmissivity also followed the same
trend.
The quality of the reservoirs in terms of porosity, permeability and transmissivity decreases down the depth.
Therefore, it can be concluded that the hydrocarbon potential and productivity of the reservoir sands can be
classified in decreasing order of arrangement as A, B and C. The reservoir A in well Bonn 007, 009, 013, 015, 017
and 019 is the best in terms of hydrocarbon production and hydrocarbon in such wells can easily migrate to the
wellbore as compared to other two reservoirs.
REFERENCES
[1] Adedokun, O. (1981). Petrology, provenance and depositional environments of the reservoir sandstone of
[2] Allix, P. (1983). Environments mesozoiques de la partie nordorientale du fosse de la Benoue, (Nigeria).
Stratigraphie–sedimentologies. Evolution geodynamique. Trav. Lab. Sci. Terr., St. Jerome, Marseille
France B21, p. 1-200.
[3] Allen, J. (1963). Sedimentation in the modern Delta of the River Niger, West Africa. Proc. 6th Internal Conf.
Sedimentologist. p. 26-34
[4] Allen, J. (1964). The Nigerian Continental Margin: Bottom Sediments, submarine morphology and geological
evolution Marine Geology, 1:289-332.
[5] Archie, G. (1950). Introduction to Petrophysics of Reservoir Rocks. America Association of Petroleum
Geologists Bulletin 34: 943-961.
[6] Avbovbo, A. (1978). Tertiary Lithostratigraphy of Niger Delta, American Association of Petroleum Geologists,