Volume 60, 2019, Pages 74–83
Proceedings of 11th International Conference on Bioinformatics and Computational Biology
The Polygraph: A Data Structure for Genome Alignment
and Variation Detection
M. Stanley Fujimoto
1, Cole A. Lyman
1, and Mark J. Clement
1Brigham Young University Provo, Utah, USA
Abstract
Comparing whole genomes and finding variation is an important and difficult bioinfor-matic task. We present the Polygraph, a data structure for reference-free, multiple whole genome alignment that can be used to identify genomic structural variation. This data structure is built from assembled genomes and preserves the genomic structure from the assembly. It avoids the “hairball” graph structure that can occur in other graph methods such as de Bruijn graphs. The Polygraph can easily be visualized and be used for identifica-tion of structural variants. We apply the Polygraph toEscherichia coliandSaccharomyces cerevisiae for finding Structural Variants.
1
Introduction
Sequence alignment is one of the most basic tools in bioinformatics. Algorithms for sequence comparison, however, are often limited to short sequences and cannot be applied to whole genome sequences due to computational complexity. Aligning only short sequences captures small, local mutations that occur while leaving large-scale mutations undetected. Complete and accurate whole genome alignment is necessary for understanding evolutionary histories of related organisms.
The genome of an organism can evolve in many ways. Small, local mutations include insertions and deletions (indels) and point substitutions. Large-scale genomic modifications include structural variants (SVs) such as large (>50 base pair) indels, inversions, duplications and rearrangements such as translocations. As genomes diverge evolutionarily, genomic regions that are ancestrally linked are called homologous. Genome alignment attempts to identify homologous regions amongst a set of genomes.
Current algorithms usually align using genome anchoring heuristics based on substring seeds. progressiveMauve and Mugsy are both reference-free genome alignment algorithms that use seed anchors [1,2]. progressiveMauve relies on local multiple alignments (LMAs) which are maximal unique matches (MUMs) [3] that allow for mismatches and occur in multiple genomes. Mugsy first performs pairwise genome alignment using nucmer [4]. The Harvest Suite’s Parsnp aligns genomes by identifying MUMs using a compressed suffix graph and is designed specifically for microbial genomes. Parsnp does not identify SVs, instead focusing only on identifying core-genome regions. Mugsy and progressiveMauve tend to be conservative in their alignments and miss SVs by preferring a consistent global alignment.
In this work, we present a method for positional homology multiple genome alignment [2] that extends our previous work [5]. Genome alignment is made possible by a graph data structure called the Polygraph (PG) which can house multiple genomes and is constructed in a reference-free manner. This data structure contains vertices where homologous regions of genomes are collapsed and edges can show shared recombination events amongst subsets of genomes. Storing multiple genomes in this format facilitates the discovery genomic features useful in comparative genomic analyses.
We demonstrate the efficacy of genome alignments produced by the PG in detecting inver-sions, translocations and indels. First, we align two yeast (Saccharomyces cerevisiae) genomes to verify previously annotated SVs [8] are identified by the PG. We compare these results to Mugsy, Mauve and the Harvest Suite’s Parsnp module. We then compute the PG for 5 Es-cherichia coliand demonstrate how it can be used to identify conserved regions amongst subsets of genomes. The Polygraph provides a method for storing multiple genomes as a graph that allows for the discovery of structural variants.
2
Methodology
Initially, the Polygraph is a data structure that represents a rough alignment of multiple genomes. All input genomes are anchored together into vertices of the graph by identifying regions of the genome that are assumed homologous. Merging homologous sequence together into vertices makes accessing homologous regions amongst genomes very easy. Initially, homol-ogy is identified by using a special set of k-mers (shared-unique k-mers). We call this initial alignment rough because only regions we are highly-confident are homologous are merged to-gether. Forming the initial Polygraph provides additional context for genomic sequence and further informs if we can collapse other regions of the input genomes together further simpli-fying the graph. Through this process, a graph is formed that contains different structures that can represent different types of polymorphisms. Particulars of the Polygraph are detailed below.
2.1
Preliminaries
A PolygraphP = (V, E, k) is a simple (no parallel edges), directed graph with vertices V and edgesE with parameter kthe k-mer size used during construction for a set of genomesG. A vertexv∈V represents homologous sequence from multiple genomes or sequence from a single genome by storing genomic coordinates as well as sequence orientation. The maximum in- and out-degree of a vertexv isn, the number of genomes present in the graph. A vertex ismerged if more than one genome is present in it otherwise it isunmerged. We use the following helper functions:
2. startP os(v, H) returns a vector of start positions for genomesH present inv
3. endP os(v, H) returns a vector of end positions for genomesH present inv
4. merged(H) returns true if all vertices inH are merged vertices
5. unmerged(H) returns true if all vertices inV are unmerged vertices
6. isChild(v, u) returns true ifuis an immediate successor vertex tov andv6=u
7. children(v) returns the{u|u∈V, isChild(v, u)}
8. grandChildren(v) returns {u|u, o∈V, isChild(v, o), isChild(o, u), u6=v}
9. isP arent(v, u) returns true ifuis an immediate predecessor to vandv6=u
10. parents(v) returns{u|u∈V, isP arent(v, u)}
11. count(s, H) returns the frequency of k-mersin genome H
12. occ(s, H) = max
h∈Hcount(s, h)
13. sharedU niqueCount(v, H) counts the number of shared-unique k-mers that make up the sequence represented in vertexv for genomeH
The set of edgesE is defined as
E={(u, v)|u, v∈V, u6=v, connected(u, v)} (1)
connected(u, v) =
T rue H ⊆genomesP resent(u)∩genomesP resent(v),
endP os(u, H)−startP os(v, H)−1 =k F alse otherwise
(2)
An edge represents the path that one or more genomes takes through the graph. For convenience in traversing the graph, we store identifiers for each genome that traverses an edge in an array.
2.2
Shared-Unique k-mers
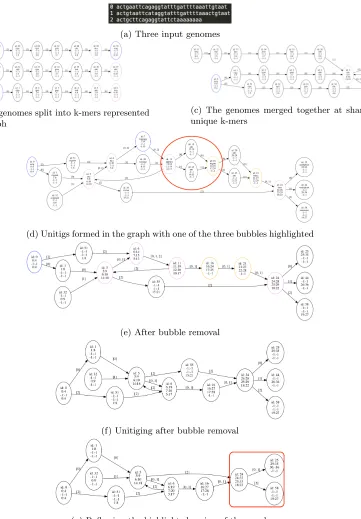
The first step in Polygraph construction is identifying shared-unique k-mers. Shared-unique k-mers are k-mers that occur only once within a subset of two or more of the input genomes. Shared-unique k-mers are assumed to be homologous. The set of shared-unique k-mersS is
S={s|occ(s, H) = 1, H ⊆G, cardinality(H)≥2} (3)
For example, given three genomesA, B and C, a k-mer x that occurs once in A and once inB but multiple times inC would be considered shared-unique for the genomesAandB but notC. K-mers that are not shared-unique are calledcommon.
(a) Three input genomes
(b) The genomes split into k-mers represented as a graph
(c) The genomes merged together at shared-unique k-mers
(d) Unitigs formed in the graph with one of the three bubbles highlighted
(e) After bubble removal
(f) Unitiging after bubble removal
(g) Reflowing the highlighted region of the graph
2.3
Bubble Removal
We simplify the graph by identifying and collapsing bubble structures in the graph. Bubbles in the Polygraph represent regions in genomes where polymorphisms such as single nucleotide variants (SNVs) and insertions and deletions (indels) have occurred. They also occur where there is no sequence divergence due to k-mers not meeting shared-unique properties for merging. Bubbles do not represent polymorphisms such as translocations and inversions. Thus, removing bubbles preserves translocations and inversions as graph structures. SNVs and indels can still be recovered by aligning the sequences that a vertex represents. Removing bubbles contracts successor vertices into a predecessor which results in a vertex that may no longer represent the same amount of sequence for each genome present.
A bubbleb in the Polygraph consists of a start vertexstart, and end vertexendand set of middle nodesM. The set of bubblesB is
B={b|end∈grandChildren(start),
M =children(start)∩parents(end)} (4)
To collapse a bubbleb, all sequence from vertices inM are absorbed intostart. All vertices inM are removed from a graphstartandendare connected by a new edge. The vertexstart may now contain sequences of heterogeneous lengths. After bubbles are collapsed, unitiging is performed to compress the graph.
2.4
Removing Weak Vertices
After merging genomes together using shared-unique k-mers and removing bubbles, we further simplify the graph by removing weak vertices. Weak vertices, are merged vertices which may have been randomly merged due to genomes sharing shared-unique k-mers that are not actually homologous. We calculate vertex support to identify weak vertices in the graph. Support for vertexv whereH is the set of all genomes present inv is calculated by
support(v) = min
h∈HsharedU niqueCount(v, h) (5)
Weak vertices are removed by creating a new vertex for each genome inH and creating the appropriate edges.
2.5
Reflowing
The Polygraph attempts to maximize the amount of homologous sequence contained within merged vertices. To further identify homologous sequence that may not have been found through the initial search for shared-unique k-mers and bubble collapsing, we reflow the Polygraph. Re-flowing attempts to move sequence that is contained in common vertices and have as much of it “flow” into a neighboring merged vertex to increase identified homologous sequence. In practice, we accomplish this by generating separate Polygraphs for subgraphs of the original PG replacing the subgraph with the newly generated PG. This process identifies more homolo-gous sequences because an increased number of shared-unique k-mers will be found when only considering the genomic sequence found in the subgraph.
The set of subgraphs, R, suitable for reflowing are identified by a single merged vertex m and set of unmerged verticesN such that
neighbors(m, N) = (
T rue N ⊆children(m)∪parents(m)
F alse otherwise (7)
Each subgraphr∈Ris then sent through the PG algorithm producing a new subgraph. Vertices inrare replaced by the newly created subgraph.
3
Results
The Polygraph, Mugsy and progressiveMauve were tested on three data sets. First, two yeast Saccharomyces cerevisiae strains: EC1118 Genoscope 2009 and the reference genome S288C were used to see if annotated SVs could be identified. Next, we applied the polygraph to five Escherichia coligenomes and visualized the alignment to demonstrate the PG aligning multiple genomes.
In all cases, we formed a Polygraph for genomes using k = 90 and the minimum unitig support for weak vertex removal was set to 540base pairs (bps). For the yeast data set, PG construction took 26m30s on an Intel Xeon E5-2650v4 @2.20GHz. Mugsy’s and progressive-Mauve’s runtimes were fast at1m02sand2m05s, respectively, but both failed to identify verified SVs that the PG found. We examine three notable structural variations discovered by Novo et al. in chromosomes VI, XIV and XV [8].
3.1
Yeast Structural Variants
Novo et al. have documented several structural variations that occur between EC1118 and the reference [8]. They make special note of three large-scale rearrangements that occur in chromosomes VI, XIV and XV. Genomes were downloaded fromyeastgenome.org. We apply the Polygraph, Mugsy and progressiveMauve to these genomes to identify structural variants. We also attempted to use Parsnp even though it is designed specifically for microbial genomes but were not able to produce comparable results to the other algorithms when applied to a eukaryotic genome.
3.1.1 Chromosome VI
Novo et al. identified three SVs in EC1118 chromosome VI. First, a 38 kilobase (kb) novel insertion in the left arm telomere. Second, a 12kb translocation from chromosome VIII situated between the 38kb novel insertion and the left telomere. Lastly, a 23kb deletion in the left arm with 5kb of the deletion translocated to chromosome X.
Using the Polygraph we were able to successfully identify the 38kb insertion and 12kb translocation. Specifically, we found the 38kb insertion to be 38,836bps and located at EC1118:VI (FN393068.1) 0-38,836. The 12kb translocation was a bit shorter at 11,046bps originating from Ref:VIII 53,9634-55,6754 and inserted into EC1118:VI (FN393068.1) 38,747-49,793and was visualized in Figure2ausing Mauve Viewer with MAFFT [6] to pro-duce gapped alignments. A graph visualization of the graph component that contains this SV can be seen in Figure 3. Both progressiveMauve and Mugsy capture the large 38kb insertion but both miss the 12kb translocation (progressiveMauve shown in Figure2b).
(a) Polygraph
(b) progressiveMauve
Figure 2: (a) The Polygraph identifies an inverted translocation from chromosome VIII high-lighted in red and an inversion in magenta that (b) progressiveMauve does not identify. Visu-alized using Muave Viewer.
Figure 3: A portion of the Polygraph for yeast chromosome VI. Vertices store genomic coor-dinates as well as orientation of sequences. Edges of the graph contain a list of all genomes that traverse that edge to facilitate graph traversal algorithms. Coordinates with−1 indicate a genome is not present.
in EC1118:X at the location the 5kb Ref:VI translocation should be. The 5kb transloca-tion came from Ref:XIV 9,739-14,941 and was inserted into EC1118:X (FN393076.1) at 18,6768-19,1969. Neither Mugsy nor progressiveMauve identified this translocation.
We investigated the translocation further by mapping all gene sequences from the reference
to EC1118 with BWA [7]. In the 5kb region where the translocation occurred, we found that there were six genes that mapped: three from Ref:VI and three from Ref:XIV forming three putative homologous gene parings that map to the same position in EC1118:X (Figure4). All six mapped genes had only a handful of polymorphisms compared to the EC1118 sequence.
We then compared the 5kb regions from the genomes through multiple sequence alignment (MSA). They were extracted from:
• EC1118:X186,768-191,969
• Ref:VI7,829-13,038
• Ref:XIV9,739-14,941
MSA was computed using MAFFT [6]. The most notable difference revealed through the MSA was a three base homopolymer thymine deletion in EC1118:X and Ref:XIV. In total, there were five base positions indicating that the Ref:XIV region is more similar to EC1118:X than Ref:VI is.
While this finding contradicts Novo et al.’s statement that the translocation originates from chromosome VI we find sufficient evidence that further investigation on the origins of the translocation is warranted. Additionally, this analysis would not be possible using Mugsy or progressiveMauve as they did not identify it.
3.1.2 Chromosome XIV
This SV is a 17kb novel insertion into Ref:XIV. We found an 18.6kb insertion from EC1118:XIV (FN393084.1) 0-18,654 at the expected location Ref:XIV 558,235. Both progressiveMauve (18,656bps) and Mugsy (18,133bps) identify this insertion as well.
3.1.3 Chromosome XV
This SV is a 65kb replacement of the last 9.7kb in the right arm of Ref:XV. We identified this insertion from EC1118:XV (FN394216.1)1,045,161-1,110,477replacing Ref:XV (NC 001147) 1,081,537-1,091,291.
progressiveMauve misidentifies the 9.7kb deletion as a 18.5kb deletion and finds a 6.7kb translocation from Ref:XVI 14,105-18,180 into EC1118:XV 1,036,531-1,040,665 (FN394216.1).
Mugsy identifies the 65kb insertion but misidentifies the 9.7kb deletion. Where the 9.7kb deletion should be, it finds 8 translocations from chromosomes V (FN393065.1), VI (FN393069.1), XII (FN393079.1), XIII (FN393081.1).
3.2
Multiple Genome Alignment
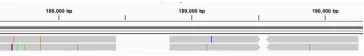
Figure 5: Multiple genome alignment of fiveE. coli genomes with three different homologous regions highlighted in red, magenta and cyan in the Mauve Viewer.
4
Discussion
The Polygraph is able to identify numerous structural variants between the two yeast genomes beyond what Novo et al. as well as progressiveMauve and Mugsy were able to identify. Ad-ditionally, the resulting graph is small and traversal algorithms can easily be applied. Visual inspection of the PG is simple with yeast-sized genomes and is also human-decipherable. Deeper analysis is easily accomplished as precise genomic coordinates are displayed for each vertex in the graph indicating putative homologous regions.
Of the three structural variants that were indicated by Novo et al., we were able to identify two without caveat with better results compared to Mugsy and progressiveMauve. The main drawback to this fine-grained analysis is runtime. The Polygraph takes significantly more time to run compared to the other software packages. Because the PG is a new algorithm that employs some parallelism there are still many areas where our code efficiency could be increased.
5
Conclusion
In this work we have demonstrated the utility of the Polygraph, a new data structure de-signed for whole genome comparison and analysis. We have demonstrated the construction and refinement algorithms that can simplify a graph representing two genomes enough to be human-understandable when visualized. We also demonstrated the utility of the Polygraph by applying it to the yeast genome for identifying SVs. We also demonstrated results of the PG when applied to more than two genomes. While superior results are observed, runtime is much longer than similar packages and requires additional work.
References
[1] Samuel V Angiuoli and Steven L Salzberg. Mugsy: fast multiple alignment of closely related whole genomes.Bioinformatics, 27(3):334–342, 2010.
[2] Aaron E Darling, Bob Mau, and Nicole T Perna. progressivemauve: multiple genome alignment with gene gain, loss and rearrangement. PloS one, 5(6):e11147, 2010.
[3] Arthur L Delcher, Simon Kasif, Robert D Fleischmann, Jeremy Peterson, Owen White, and Steven L Salzberg. Alignment of whole genomes. Nucleic acids research, 27(11):2369–2376, 1999. [4] Arthur L Delcher, Adam Phillippy, Jane Carlton, and Steven L Salzberg. Fast algorithms for
large-scale genome alignment and comparison. Nucleic acids research, 30(11):2478–2483, 2002. [5] M Stanley Fujimoto, Cole Lyman, Anton Suvorov, Paul Bodily, Quinn Snell, Keith Crandall,
Seth Bybee, and Mark Clement. Genome polymorphism detection through relaxed de bruijn graph construction. InBioinformatics and Bioengineering (BIBE), 2017 IEEE 17th International Conference on, pages 212–216. IEEE, 2017.
[6] Kazutaka Katoh and Daron M Standley. Mafft multiple sequence alignment software version 7: improvements in performance and usability.Molecular biology and evolution, 30(4):772–780, 2013. [7] Heng Li and Richard Durbin. Fast and accurate short read alignment with burrows–wheeler
transform. Bioinformatics, 25(14):1754–1760, 2009.
[8] Maite Novo, Fr´ed´eric Bigey, Emmanuelle Beyne, Virginie Galeote, Fr´ed´erick Gavory, Sandrine Mallet, Brigitte Cambon, Jean-Luc Legras, Patrick Wincker, Serge Casaregola, et al. Eukaryote-to-eukaryote gene transfer events revealed by the genome sequence of the wine yeast saccharomyces cerevisiae ec1118.Proceedings of the National Academy of Sciences, pages pnas–0904673106, 2009. [9] James T Robinson, Helga Thorvaldsd´ottir, Wendy Winckler, Mitchell Guttman, Eric S Lander, Gad Getz, and Jill P Mesirov. Integrative genomics viewer. Nature biotechnology, 29(1):24, 2011. [10] Todd J Treangen, Brian D Ondov, Sergey Koren, and Adam M Phillippy. The harvest suite for rapid core-genome alignment and visualization of thousands of intraspecific microbial genomes.