Volume 60, 2019, Pages 65–73
Proceedings of 11th International Conference on Bioinformatics and Computational Biology
Understand Effective Coverage by Mapped Reads using
Genome Repeat Complexity
Shanshan Gao
1, Quang Tran
2,3, and Vinhthuy Phan
3,‡1 Google Inc., Mountain View, CA 94043, USA 2
Roche Sequencing Solutions, Belmont, CA 94002, USA
3
Department of Computer Science, University of Memphis, Memphis, TN 38152, USA
‡
Corresponding author: [email protected]
Abstract
Sequencing depth, which refers to the expected coverage of nucleotides by reads, is com-puted based on the assumption that reads are synthesized uniformly across chromosomes. In reality, read coverage across genomes is not uniform. Although a coverage of 10x, for example, means a nucleotide is covered 10 timeson average, in certain parts of a genome, nucleotides are covered much more or much less. One factor that influences coverage is the ability of a read aligner to align reads to genomes. If a part of a genome is complex, e.g. having many repeats, aligners might have troubles aligning reads to that region, resulting in low coverage.
We introduce a systematic approach to predict the effective coverage of genomes by short-read aligners. The effective coverage of a chromosome is defined as the actual amount of bases covered by reads. We show that the quantity is highly correlated with repeat complexityof genomes. Specifically, we show that the more repeats a genome has, the less it is covered by short reads. We demonstrated this strong correlation with five popular short-read aligners in three species: Homo sapiens,Zea mays, andGlycine max. Additionally, we show that compared to other measure of sequence complexity, repeat complexity is most appropriate. This works makes it possible to predict effective coverage of genomes at a given sequencing depth.
1
Introduction
Advances in next-generation sequencing (NGS) technologies have fostered an active develop-ment of computational methods to align short reads to reference genomes [5,2,15,7,9,12,21,
18]. The alignment of short reads to reference genomes plays a critical role in many important computational problems that utilize NGS data and reference genomes such as genome assem-bly, genotyping, and measuring gene expression. In aligning short reads to genomes, in many problems such as assembly, a primary goal is to cover as much of the genome of interest by mapped reads as possible. Since the distribution of reads is not uniform [10, 14], many reads are often required to cover most of the genome.
by 10 mapped reads. But in reality, it is possible that certain regions of a genome are not covered by mapped reads at all. As such, researchers often prefer to design experiments with high sequencing depth, which increases experimental cost. It is, therefore, of interest to have a systematic approach to understand and predict effective coverage of genomes for a given sequencing depth. In this paper, we demonstrate that it is possible to reason able effective coverage of genomes by mapped reads of a given sequencing depth by correlating aligners’ performance with genome complexity.
Complexity of genomes has been studied intensively since the difficulty of sequencing genomes generally much depends on the complexity of the genomes. Lempel and Ziv [8, 25] formulated the notionLZ-complexity and related it to how much sequences can be compressed. Becheret al. [3] introduced theI-complexity, which is defined in terms of discrete logs of longest common prefixes of consecutive sorted suffixes. The authors showed that theI-complexity was close to theLZ-complexity.
In the effort of studying the relation between short-read performance and genome complex-ity, Phanet al. [17,22,23] demonstrated how different notions of genome complexity correlated with precision and recall of many short-read aligners. This work showed that the rate of dis-tinct substrings correlated very significantly to aligners’ precision and recall. In this paper, we will demonstrate that a notion of complexity, known asrepeat complexity, correlates very well with theeffective coverageof genomes by mapped reads. The abundance of repeats in genomes makes it difficult to identify exact positions of short reads in repetitive regions and hence map them to correct places. Thus, conceptually, the more repeats a genome has, the harder aligners can cover it with mapped reads. We used a simple definition ofrepeat complexity, Rk, defined
as the number of repeats of lengthkdivided by the total number substrings of lengthk. Using 5 popular short-read aligners, we found that when k is similar to read length, Rk correlated
strongly with effective chromosomal coverage. This result makes it possible to predict the genome effective coverage at a given sequencing depth.
2
Methods
2.1
LZ
-complexity and
I
-complexity
TheLZ-complexity [8,25] measures the degree of randomness in sequences and as such it can be used to compress sequences effectively. TheLZ-complexity is defined as the number of different patterns in a sequence when it is scanned from left to right; we used the version introduced by Lempel and Ziv in 1978 [25]. For example, the sequence ACTACGTT has complexity 6 because there are 6 different patterns (A, C, T, AC, G, TT) when the sequence is scanned from left to right. The manner of left-to-right scanningdoes not rewind, which means, for example, ACT is a substring but it is not considered as one of the different patterns accounted by the complexity measure. We normalized theLZ-complexity by dividing it by the maximum number of patterns a sequence of given length could possibly get.
for it. It is defined as follows:
I(g) =
|g| X
i=1
log4(LCP[i] + 1)−log4(LCP[i] + 2)
where LCP is the array storing the lengths of the longest common prefixes of consecutive sorted suffixes of the sequenceg. TheLZ-complexity andI-complexity are close to each other. It was shown [3] that for a DNA sequences, LZ8(s)≤I(s)≤LZ(s)(log4|s|+ 1).
BothLZ-complexity andI-complexity to some extent measure the abundance of repeats in sequences because the number of different substrings of a sequence is inversely proportional to the number of repeats of the sequence. We chose these measures as part of our investigation since the abundance of repeats in DNA sequences is arguably directly proportional to their biological complexity [13] and is known to affect the performance of short-read aligners. These complexity measures areconstantin the sense that the complexity of a sequence is always the same. This works fine for text compression since the degree of compressibility does not rely on external parameters.
2.2
Length-sensitive repeat
R
kcomplexity
Given a numberk, we defineRk as follows:
Rk(g) =
P
f(x)>1,|x|=kf(x)
|g| −k+ 1
wheref(x) is the number of occurrences ofxing. Rkmeasures the rates of repeats, respectively,
of lengthk. Rk is related to the function C(k, r) proposed by Whiteford et al.[24]. C(k, r) is
the count ofk-mers repeating exactlyrtimes. Therefore,Rk =Pr>1r·C(k, r).
Rk can be computed in linear time and space using suffix and LCP arrays, based on the
following lemma.
Lemma 1. P
f(x)>1,|x|=kf(x) =
P
[i,j]∈Ik(j−i+ 2), where Ik is the set of intervals [i, j]’s, wherei≤j, such that
1. LCP[u]≥k fori≤u≤j
2. LCP[i−1]< kunless i= 1
3. LCP[j+ 1]< kunless j=|g|
Proof. Ak-repeat is a substringxof lengthk, withf(x)>1. Since the suffix arrayS is sorted lexicographically, S forms consecutive runs of k-repeats, which are k-prefixes of the suffixes stored implicitly byS. More specifically, each interval [i, j]∈Ik corresponds to all occurrences
of exactly onek-repeat. The number of occurrences for eachk-repeat is exactlyj−i+ 2. The setIk can be computed in linear time by scanning through theLCP array once, from
beginning to end. Note that the index of LCP runs from 1 to|g|, andLCP[1] = 0.
2.3
Correlating
LZ
,
I
,
R
kwith effective coverage
Species Run
Zea mays SRR801164
Glycine max SRR596509 Homo sapiens ERR251193
Table 1: Short read datasets (SRA)
reads would cover the genome under the assumption that reads are uniformly distributed. A sequencing depth is typically much larger than 1 (e.g. 50x) , whereas effective coverage by mapped reads is at most 1.
To investigate how sequence complexity affects performance of alignment, we correlate two variables: (1) the I, LZ, and Rk measures and (2) the effective coverage on the genomic
sequences. The coverage is computed by using real reads to capture the true underlying distri-bution of reads in chromosomes.
Linear correlation between two variables is quantified in the Pearson correlation coefficient
R, whose value is between -1 and 1. IfR= 0, there is no correlation between the two variables. IfRis 1 (or -1), the two variables are maximally positively (or negatively) correlated. Generally,
R≥0.75 is considered a high correlation. Although a high correlation does not necessarily imply causation, it can be used to predict outcomes of one variable based on values of the other.
3
Experimental settings
3.1
Data
Obtained from public databases, this dataset consists of 54 genomic sequences, which are 24 chromosomes ofhomo sapiens(humans), 20 chromosomes ofglycine max(soybean), and 10 chro-mosomes ofzea mays(corn). Three pair-end read datasets were selected from the DNAnexus Sequence Read Archive (see Table1).
3.2
Short-read aligners
We considered several algorithmic approaches with publicly available software packages [19, 5,
2, 15, 7, 9, 12, 21, 18, 11]. After a preliminary evaluation, we eliminated aligners that were not designed to handle longer reads, had technical problems with large datasets or could not finish within a reasonable amount of time. Therefore, we were left with five aligners: bowtie2 [7], bwasw [9], cushaw2 [12], seqalto [15], and smalt [18].
4
Results
4.1
High correlation
R
kand effective coverage
We correlated aligners’ performance on genomic sequences and their complexity as measured byRk. We setk to 100 because investigated reads had length 100. This negative correlation
suggests that the more repeats of length 100 a genome has, the more difficult it is for an aligner to align reads of length 100 to the genome.
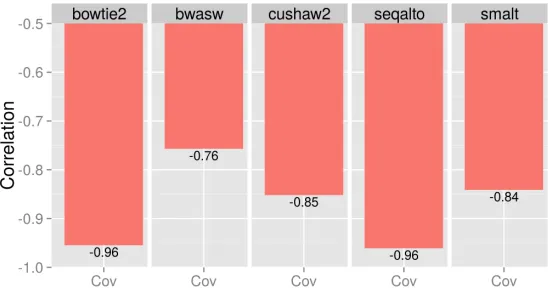
Figure 1: Correlation betweenR100 and chromosomal effective coverage. Strong to
moderately strong negative correlations were observed for all five aligners.
More generally, Figure1 shows the linear correlation between sequence complexity as mea-sured byR100and effective coverage of all aligners. R100 correlated strongly with the effective
coverage, the correlation was between about -0.76 and -0.96.
Table 2 summarizes the aligners’ coverage averaged across sequences with reads of length 100. The effective coverage performance is relatively high, over 0.8 with little change in variance. In particular, Smalt and cushaw2 were the overall best performers.
bowtie2 bwasw cushaw2 seqalto smalt
Cov 0.909, 4e-3 0.867, 5e-3 0.913, 3e-3 0.898, 8e-3 0.923, 3e-3
Table 2: Average and variance of aligners’ coverage (Cov).
4.2
R
kcorrelates better than
LZ
and
I
As we discovered thatR100correlated strongly to alignment performance when read length was
100, we investigated further to determine the best measure of complexity that would yield the highest correlation to effective coverage at each read length. We hypothesized that the best measure of complexity would have to account for repeats of length similar to read length. To test this hypothesis, we computed correlation between effective coverage of all aligners andRk
measured, respectively, byR25, R50, R75, R100, R125, R150. In addition toRk, we also considered
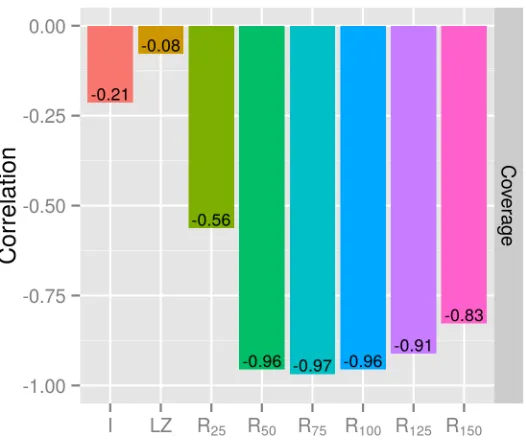
Figure 2: Correlation of performance of bowtie2 and different measures of complexity. The best measure isR75 for read length equal to 100.
Compared toRk, we found theI-complexity to be an inferior measure of complexity for the
purpose of studying short-read alignment performance. As shown in Figure2, theI-complexity yielded a very low correlation with coverage, r ≈ −0.21. For other aligners, we observed similarly low-to-moderation correlation between theI-complexity and performance. Compared toRk, the correlation was much lower.
Furthermore, we found the LZ-complexity to have really low correlation with the effective coverage. This low negative correlation was observed with all aligners.
4.3
Repeat complexity of chromosomes of Homo sapiens, Zea mays
and Glycine max
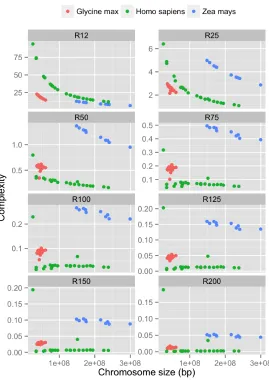
We investigated complexity profiles of different species, in particular the changes in complexity as chromosomes get larger. The result is summarized in Figure3. The figure shows complexity values of chromosomes of the three species in dataset 2, for severalRk’s withkbetween 12 and
200. Several observations can be made.
First, repeat complexity of chromosomes of different species tend to have distinct signatures. Among chromosomes with similar sizes, those belonging to the same species have much more similar complexity, compared to those belonging to different species. A possible explanation is that repetitive patterns across chromosomes of the same species are more biologically related, compared to chromosomes of other species. For chromosomes of similar size, those of Homo sapiensappear to have much lower complexity than those ofZea mays andGlycine max.
Figure 3: Repeat complexity of chromosomes ofHomo sapiens,Zea maysand Glycine max. Each point represents a complexity value (y-axis) of a chromosome with a specific length (x-axis).
share essentially the same repeat patterns. We suspect there is a biological explanation for this [16,13,1].
Although it appears that the larger chromosomes of the same species tend to have lower complexity (e.g. R12, R25andR50), there is an exception withHomo sapiens. InHomo sapiens,
5
Conclusions
We found a strong correlation between genome effective coverage and repeat complexity. This strong correlation suggests that we can build regression models to predict accurately effective coverage by mapped reads for each short-read aligner. The ability to predict effective coverage of genomes given a sequencing depth might help researchers design their experiments in a cost-effective manner. Although our results were done with short reads, the approach should be extendeable to experiments that utilize long reads. Similarly, because repeat complexity can be defined for specific parts of chromosomes, not just whole chromosomes, the approach should also be applicable to experiments that utilize target sequencing.
In practice, the right choice of an alignment software depends not only on alignment per-formance, but also running time, usage of memory, freeness of bugs, and ease of use. Even considering performance, tweaking parameters can change performance characteristics very much. In addition, an overview of various strategies for mapping reads to repeats as well as considerations of sequencing bias were given in [4,20]. Lam et al. [6] also reported the accuracy and completeness of whole-genome sequencing platforms upon variant calling. The scope of this work focuses ondefault performance of aligners, as we believe they are indicative of different algorithmic approaches and how these different approaches are affected by the complexity of genomes.
6
Acknowledgements
This work is partially supported by NSF grant CCF-1320297.
References
[1] Richard H Adams, Heath Blackmon, Jacobo Reyes-Velasco, Drew R Schield, Daren C Card, Audra L Andrew, Nyimah Waynewood, and Todd A Castoe. Microsatellite landscape evolutionary dynamics across 450 million years of vertebrate genome evolution. Genome, 59(5):295–310, 2016. [2] Can Alkan, Jeffrey M Kidd, Tomas Marques-Bonet, Gozde Aksay, Francesca Antonacci, et al. Per-sonalized copy number and segmental duplication maps using next-generation sequencing.Nature genetics, 41(10):1061–1067, 2009.
[3] Ver´onica Becher and Pablo Heiber. A linearly computable measure of string complexity.Theoretical Computer Science, 438:62–73, 2012.
[4] Steven W Criscione, Yue Zhang, William Thompson, John M Sedivy, and Nicola Neretti. Tran-scriptional landscape of repetitive elements in normal and cancer human cells. BMC genomics, 15(1):583, 2014.
[5] Matei David, M Dzamba, D Lister, L Ilie, and Michael Brudno. Shrimp2: sensitive yet practical short read mapping. Bioinformatics, 27(7):1011–1012, 2011.
[6] Hugo YK Lam, Michael J Clark, Rui Chen, Rong Chen, Georges Natsoulis, Maeve O’huallachain, Frederick E Dewey, Lukas Habegger, Euan A Ashley, Mark B Gerstein, et al. Performance com-parison of whole-genome sequencing platforms. Nature biotechnology, 30(1):78, 2012.
[7] Ben Langmead and Steven L Salzberg. Fast gapped-read alignment with bowtie 2.Nature Methods, 9(4):357–359, 2012.
[8] A Lempel and J Ziv. On the complexity of finite sequences. Information Theory, IEEE Transac-tions on, 22(1):75–81, 1976.
[10] Jun Li, Hui Jiang, and Wing Hung Wong. Modeling non-uniformity in short-read rates in rna-seq data. Genome biology, 11(5):R50, 2010.
[11] Ruiqiang Li, Yingrui Li, Karsten Kristiansen, and Jun Wang. Soap: short oligonucleotide align-ment program.Bioinformatics, 24(5):713–714, 2008.
[12] Yongchao Liu and Bertil Schmidt. Long read alignment based on maximal exact match seeds. Bioinformatics, 28(18):i318–i324, 2012.
[13] Michael Lynch and John S. Conery. The origins of genome complexity. Science, 302(5649):1401– 1404, 2003.
[14] Paul Medvedev, Eric Scott, Boyko Kakaradov, and Pavel Pevzner. Error correction of high-throughput sequencing datasets with non-uniform coverage. Bioinformatics, 27(13):i137–i141, 2011.
[15] John C Mu, Hui Jiang, Amirhossein Kiani, Marghoob Mohiyuddin, Narges Bani Asadi, and Wing H Wong. Fast and accurate read alignment for resequencing. Bioinformatics, 28(18):2366– 2373, 2012.
[16] Giulia IM Pasquesi, Richard H Adams, Daren C Card, Drew R Schield, Andrew B Corbin, Blair W Perry, Jacobo Reyes-Velasco, Robert P Ruggiero, Michael W Vandewege, Jonathan A Shortt, et al. Squamate reptiles challenge paradigms of genomic repeat element evolution set by birds and mammals.Nature communications, 9(1):2774, 2018.
[17] Vinhthuy Phan, Shanshan Gao, Quang Tran, and Nam S. Vo. How genome complexity can explain the hardness of aligning reads to genomes. InProceedings of the 4th International Conference on Computational Advances in Bio and Medical Sciences (ICCABS), 2014.
[18] H Ponstingl and Z Ning. Smalt—a new mapper for dna sequencing reads. F1000 Posters, 1:313, 2010.
[19] Guillaume Rizk and Dominique Lavenier. Gassst: global alignment short sequence search tool. Bioinformatics, 26(20):2534–2540, 2010.
[20] Michael G Ross, Carsten Russ, Maura Costello, Andrew Hollinger, Niall J Lennon, Ryan Hegarty, Chad Nusbaum, and David B Jaffe. Characterizing and measuring bias in sequence data.Genome biology, 14(5):R51, 2013.
[21] E Siragusa, D Weese, and K Reinert. Fast and accurate read mapping with approximate seeds and multiple backtracking. Nucl Acids Res, 41(7):e78, 2013.
[22] Quang Tran, Shanshan Gao, Nam S Vo, and Vinhthuy Phan. A linear model for predicting performance of short-read aligners using genome complexity. BMC bioinformatics, 16(15):P17, 2015.
[23] Quang Tran, Shanshan Gao, Nam S Vo, and Vinhthuy Phan. Repeat complexity of genomes as a means to predict the performance of short-read aligners. InProceedings of the 8th International Conference on Bioinformatics and Computational Biology (BiCOB), 2016.
[24] Nava E Whiteford, Niall J Haslam, Gerald Weber, Adam Prugel-Bennett, Jonathan W Essex, Cameron Neylon, et al. Visualizing the repeat structure of genomic sequences.Complex Systems, 17(4):381–398, 2008.