Anti-diabetic effects of blackberry (Rubus Fruticosus) extract on normal
and STZ induced diabetic rats
Manijeh Motevalian1,2*, Seyed Mostafa Javadpour2
1 Razi Drug Research Center, Iran University of Medical Sciences, Tehran, Iran
2 Department of Pharmacology, School of Medicine, Iran University of Medical Sciences, Tehran, Iran
Please cite this article as:
Motevalian M, Javadpour SM. The effects of anti-diabetic blackberry (Rubus Fruticosus) extract in normal and STZ induced diabetic rats. Iranian J Pharmacol Ther. 2017 (November);15: 1-10.
ABSTRACT
Possible effects of blackberry leaf aqueous extract on blood glucose and other serum components in normal and STZ –induced diabetic rats were investigated. Blackberry leaves extracts were prepared by maceration method and gavaged for 28 consecutive days to the animals. Rats with blood glucose level greater than 200 mg/dl, after injection of 70 mg/kg STZ, were enrolled in the study. Blood glucose levels in rats, at zero time, 1 and 3 hours after gavages, and each week was measured. In the 14th and 28th days, serum components, and on the last day, the weight of liver, kidney and heart were measured. Within four weeks, blood glucose levels in the group receiving the extract had a significant decreasing trend. In the group receiving the extract, serum lipid parameters and liver function tests, dropped from second to fourth week, compared with positive control group, was significant. This study showed that oral administration of aqueous extract of Blackberry leaves can have the blood sugar-lowering effects and reduction of serum lipids and liver function tests.
Conflicts of Interest: Declared None
Funding: None
Keywords Blackberry extract, Diabetes,
Serum lipid, Liver function tests
Corresponding to: Manijeh Motevalian, Razi Drug Research Center, Department of Pharmacology, School of Medicine, Iran University of Medical Sciences, Tehran, Iran
Email:
motevalian.m@iums.ac.ir
Received: 6 Mar 2017 Revised: 10 Apr 2017, Accepted: 19 Jun 2017
INTRODUCTION
Diabetes mellitus is a chronic and common disease with increasing prevalence and a heterogeneous collection of various metabolic disorders that their common feature is increased blood sugar, resulting in disturbances in the secretion or function of the insulin hormone. During the past 10 to 20 years, numerous clinical and experimental researches on medicinal plants have been conducted that in more than 600 species of them has been observed a significant effect in lowering blood glucose in animal models[1]. In traditional medicine of Iran, blackberry leaf (Rubus Fruticosus) has been used as antipyretic, analgesic, anti-inflammatory in the urinary tracts, and anti-diabetic agent [2]. Considering the effects of the berries listed in the traditional texts, in this study, the effects of oral raspberry
leaf extract on serum glucose and other components in animal models of diabetes, were studied.
METHODS AND MATERIALS
Collection of plants: Fresh leaves of the blackberry plants were picked in early spring 1389, the region of Damavand in Tehran province. After confirmation of genus and species of plants by the Botany Department of Tehran University of Medical Sciences, it was dried in the open air and light.
Preparation of extract: 300 grams of fine powder of the blackberry leaves were mixed with 3000 cc water; the mixture was passed through the filter paper after stirring and gentle heating for 72 hours [3,4]. While taking the extract, IRANIAN JOURNAL OF PHARMACOLOGY &THERAPEUTICS
Copyright © 2017 by Iran University of Medical Sciences
Iranian J Pharmacol Ther. 2017 (November);15:1-10.
2 Motevalian et al.
drinking water, was used as solvent.
Animals: 40 white male Wistar rats, weighing 200± 40g, at 2 ± 22 ° C, humidity 60-45 percent, the 12-hour cycle of light – darkness, and while freely enough, had access to food and water, were kept in cages.
Induced diabetes: induction of diabetes 70mg/kg of STREPTOZOCIN [5], produced in Sigma-Aldrich company, was dissolved in sodium citrate buffer (Concentration of 7.5 mg/ml; 0.05 M) with PH=4.5, and was injected intraperitoneally [6]. After 14 days, 32 Rat, with blood glucose greater than mg / kg 200 (with at least 8 hours fasting) were considered diabetic, and were enrolled [7].
Groups: rats were randomly divided into 5 groups (n=8): a) Negative control group: Not diabetic groups received with 0.5 cc of water per day;
b) Positive control group: the diabetic group received 0.5 cc water daily;
c) Group of recipient 100 mg/kg/day blackberry leaf aqueous extract;
d) Group of recipient 300 mg/kg/day blackberry leaf aqueous extract;
e) Group of recipient 300 mg/kg/day Glibenclamide. This study was conducted over 4 weeks. Glucose was measured (by Glucometer called “Glucocard01 TM’’, the production of ARKRAY company in Japan) in the period of short-term (within 3 hours after gavages) and long-term (4 weeks), the serum levels of HbA1c (Colorimetric Methods), TG, Cholesterol, HDL, LDL, ALT, AST, ALP, and CPK
was measured in the second and fourth weeks (by Enzymatic Colorimetric Method). Body weight of animals every week, and finally, after killing the animals at day 28, the weight of the liver, kidneys and the heart was measured.
Results of the investigation are expressed as “mean ± standard deviation’’. After determining the distribution of data using Independent sample Kolmogorov-Smirnov test and equality of variances by Leven test with the help of SPSS software, for the parameters that had normal distribution was used Repeated measurement test and Paired t-test, and One-way ANOVA test and Student t-test, for Comparison groups together (after confirming the existence of differences, to compare the two results, Tukey HSD post hoc test was used). To compare the parameters that didn’t have normal distribution was used Friedman and Willcoxon test; and Kruskal-Wallis and Mann-Whitney U tests, For comparison groups together (with Games-Howell’s post hoc test). For all analysis, a significant level of P-value ≤0.05 was considered.
RESULTS
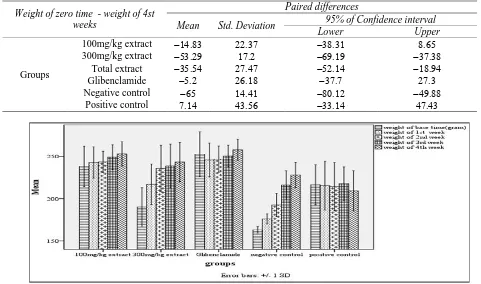
Body weight: increased in both groups receiving the extract; the difference there was in the group receiving 100 mg/kg of extracts, was significant only with the negative control and positive, and the recipient 300 mg/kg of extracts, only with the negative control group (P≤0.05).
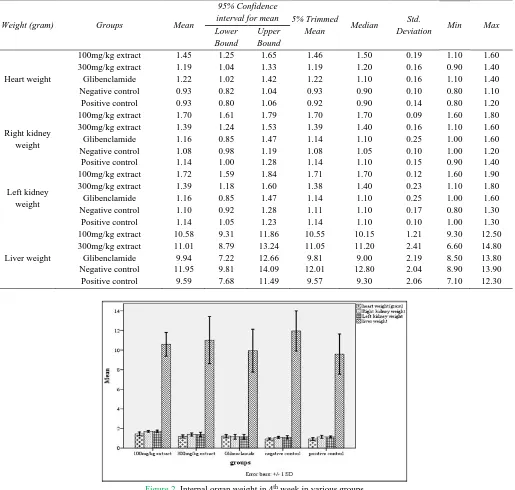
Weight of internal organs: However, the average liver weight in the negative control group was more than other groups, but overall, the average liver weight difference,
Table 1. Effect of blackberry leaf aqueous extract on body weight within 4 weeks
Weight of zero time - weight of 4st weeks
Paired differences
Mean Std. Deviation 95% of Confidence interval
Lower Upper
Groups
100mg/kg extract 300mg/kg extract
Total extract Glibenclamide Negative control
Positive control
Figure 1. Mean ± standard deviation of weight by group separations
between the groups, was not significant (P>0.05).
Heart weight in the group receiving the extract was significantly more than negative and positive control group (P≤0.05). Among the groups receiving the extract, the heart weight in the 100 mg/kg extract significantly was higher than the 300 mg /kg and Glibenclamide group.
Average weight of both the left and right kidney, in the extract group, was more than the other groups. In the group receiving the extract, the weight of both left and right in 100mg/kg to extract was significantly higher than 300 mg/kg group.
Serum components: in fourth week, average HbA1c levels increased in all groups except the positive control and 300 mg/kg extract group; But the CPK dropped in the fourth week, compared with the second week in all groups except the group receiving 300mg / kg extract (P>0.05). However, only 105% increases in HbA1c in Glibenclamide group, and 60 percent reduction in CPK in the positive control group, were significant (P≤0.05). Overall, changes in HbA1c over two weeks in the extract group, was significant only compared with the positive control group (P≤0.05). CPK level changes in the group receiving 100mg / kg of extract
Table 2. Internal organ weight descriptive data in all groups
Weight (gram) Groups Mean
95% Confidence
interval for mean 5% Trimmed
Mean Median
Std.
Deviation Min Max
Lower Bound Upper Bound Heart weight 100mg/kg extract 300mg/kg extract Glibenclamide Negative control Positive control 1.45 1.19 1.22 0.93 0.93 1.25 1.04 1.02 0.82 0.80 1.65 1.33 1.42 1.04 1.06 1.46 1.19 1.22 0.93 0.92 1.50 1.20 1.10 0.90 0.90 0.19 0.16 0.16 0.10 0.14 1.10 0.90 1.10 0.80 0.80 1.60 1.40 1.40 1.10 1.20 Right kidney weight 100mg/kg extract 300mg/kg extract Glibenclamide Negative control Positive control 1.70 1.39 1.16 1.08 1.14 1.61 1.24 0.85 0.98 1.00 1.79 1.53 1.47 1.19 1.28 1.70 1.39 1.14 1.08 1.14 1.70 1.40 1.10 1.05 1.10 0.09 0.16 0.25 0.10 0.15 1.60 1.10 1.00 1.00 0.90 1.80 1.60 1.60 1.20 1.40 Left kidney weight 100mg/kg extract 300mg/kg extract Glibenclamide Negative control Positive control 1.72 1.39 1.16 1.10 1.14 1.59 1.18 0.85 0.92 1.05 1.84 1.60 1.47 1.28 1.23 1.71 1.38 1.14 1.11 1.14 1.70 1.40 1.10 1.10 1.10 0.12 0.23 0.25 0.17 0.10 1.60 1.10 1.00 0.80 1.00 1.90 1.80 1.60 1.30 1.30 Liver weight 100mg/kg extract 300mg/kg extract Glibenclamide Negative control Positive control 10.58 11.01 9.94 11.95 9.59 9.31 8.79 7.22 9.81 7.68 11.86 13.24 12.66 14.09 11.49 10.55 11.05 9.81 12.01 9.57 10.15 11.20 9.00 12.80 9.30 1.21 2.41 2.19 2.04 2.06 9.30 6.60 8.50 8.90 7.10 12.50 14.80 13.80 13.90 12.30
Figure 2. Internal organ weight in 4th week in various groups
4 Motevalian et al.
(15/18 per cent reduction) and in the group receiving 300 mg/kg of extract (75/30 percent increase) in two weeks, was significant compared with only the negative control group (P≤0.05).
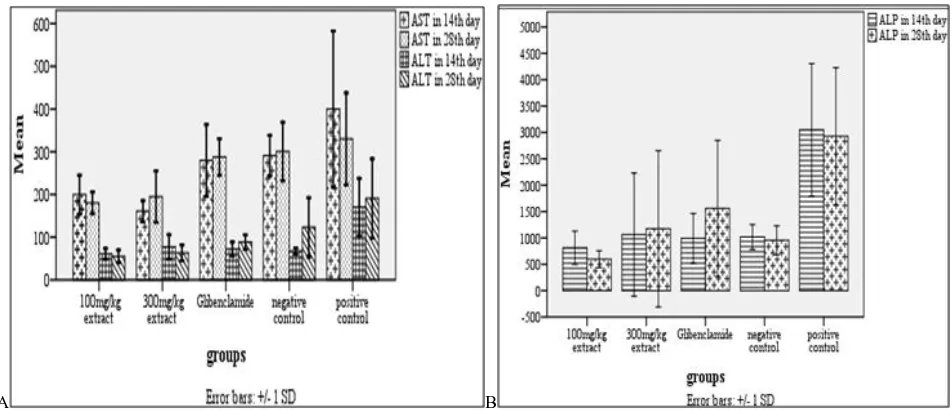
Liver function tests: within two weeks, the average AST level in the extract group was less than Glibenclamide group, the negative control and especially positive control (P≤0.05). The average level of ALT in extract group was less than the other groups, but only in comparison with the positive control group, the difference was significant (P≤0.05). Average ALP level in the group receiving the extract, was less than Glibenclamide group, negative control and especially positive control group.
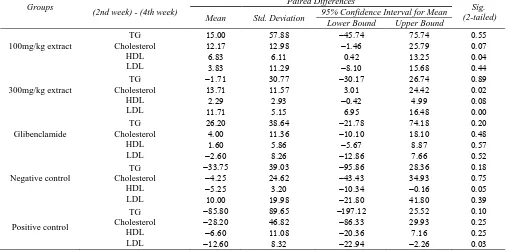
Lipid components: During the second to fourth weeks: not seen significant differences in any of the groups, and no between groups about TG changes. Overall, average level of
TG in the group receiving the extract was lower than other groups but was significant only in comparison with the positive control. Meanwhile, the average TG in the group receiving 100 mg/kg of extract was more than the group receiving 300 mg/kg of extract (P>0.05). Changes in cholesterol, 12.95 per cent reduction in the group receiving 100 mg/kg of extract, and 16.24 per cent reduction in the group receiving 300 mg/kg of extract, were significant, but differences between any groups was not significant. During two weeks, the average cholesterol level in group receiving extract was less than the other groups, and on the other hand it was more in the group receiving 100 mg/kg of extract than in the group receiving 300 mg/kg of extract and Glibenclamide group (P>0.05). The level of HDL, decreased 22.59 percent in the group receiving the 100mg/kg extract (P≤0.05), 8.17 percent in the group receiving 300 mg/kg
A B
Figure 3. Effect of blackberry leaf aqueous extract on HbA1c (panel A) and CPK (panel B) during 2 weeks
A B
Figure 4. Effect of blackberry leaf aqueous extract on AST and ALT (panel A) and ALP (panel B) during 2 weeks
extract (P>0.05) and increased 25.67 percent in negative control group (P≤0.05); but there was no significant difference between the two extract groups from the changes point of view. Average level of HDL in the group receiving 100 mg/kg of extract was less than the group receiving 300 mg/kg of extract, and overall, in the extract group was lesser than positive control group, (P≤0.05) but more than the negative control and Glibenclamide groups (P>0.05). The level of LDL in extract group was less than negative control (P≤0.05) and positive control group (P>0.05) however more than Glibenclamide groups (P>0.05); average LDL level in the group receiving 100 mg/kg of extract was more than the group receiving 300 mg/kg extract (P≤0.05).
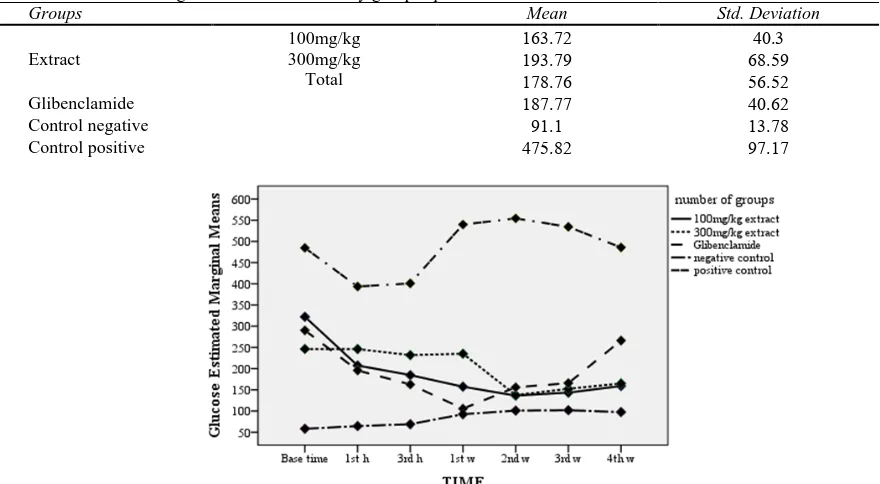
Blood glucose: Average blood glucose in the group
receiving 100 mg/kg of extract was more than the group receiving 300 mg/kg of extract at zero time, and on the contrary, in Next courses, especially in third hour and first week, less than the group receiving 300 mg/kg of extract (P>0.05). Within four weeks blood sugar levels, was significant downswing in the group receiving 100 mg/kg of extract, which only was considerable to than negative control and positive control groups (P≤0.05). Generally, within 4weeks, the average of blood sugar in the group receiving 100 mg/kg of extract, was less than the group receiving 300 mg/kg of extract, Glibenclamide (P>0.05) and the positive control groups (P≤0.05) and more than the negative control group (P>0.05). blood sugar levels, was significant downswing, except when the distance between zero time to
Table 3. Effect of blackberry leaf aqueous extract on AST, ALT and ALP during 2 weeks
Groups (2nd week) - (4th week) Mean Std. Deviation
95% Confidence Interval for
Mean Sig. (2-tailed)
Lower Bound Upper Bound
100mg/kg extract AST
ALT ALP
300mg/kg extract AST
ALT ALP Glibenclamide AST ALT ALP Negative control AST ALT ALP Positive control AST ALT ALP
Table 4. Serum lipid changes in various groups during 2 weeks.
Groups
(2nd week) - (4th week)
Paired Differences
Sig. (2-tailed)
Mean Std. Deviation 95% Confidence Interval for Mean
Lower Bound Upper Bound
100mg/kg extract TG Cholesterol HDL LDL 300mg/kg extract TG Cholesterol HDL LDL Glibenclamide TG Cholesterol HDL LDL Negative control TG Cholesterol HDL LDL Positive control TG Cholesterol HDL LDL
6 Motevalian et al.
1st h, in the group receiving 300 mg/kg of extract, too (P≤0.05); which changes in this group was significant only in comparison with the negative and positive control groups (P≤0.05). Generally, within 4weeks, the average of blood sugar in the group receiving 300 mg/kg of extract, was more than the group receiving 100 mg/kg of extract, Glibenclamide (P>0.05) and the negative control groups (P≤0.05) and less than the positive control group (P≤0.05). Within four weeks, blood sugar levels, was significant downswing in the extract group; and generally, the average of blood sugar was more than Glibenclamide (P>0.05) and the negative control groups (P≤0.05) and less than the positive control group (P≤0.05).
DISCUSSION
Diabetes mellitus is a high-risk disease, associated with increased risk of cardiovascular condition. Hyperglycemia induced by STZ is considered as a useful model for studying
the activity of glucose-lowering agents. Research results have shown that intraperitoneal injection of streptozocin (STZ) equal to 70 mg/ kg, can induced diabetes in rats. STZ, selectively, destroys pancreatic β cells; by damage to the pancreatic beta cell membranes, DNA fragmentation, and the reaction to some enzymes (such as glucokinase activity) Increase levels of glucose and cause insulin-dependent diabetes mellitus in animals. Also, STZ increase mRNA expression of enzymes related to liver glucose - 6 – phosphatase and thereby increase the blood glucose [8]. Glibenclamide is a drug belonging to the class of sulfonylurea, which is used to treat type 2 diabetes. It by closing the ATP sensitive potassium channels and depolarizing membrane of pancreatic islet beta cells, cause opening of calcium channels, which Ca2+ entry into cells and increased secretion of insulin. It is known that Glibenclamide is independent from the closure of potassium channels, through their binding to specific receptors in beta
Figure 5. Effect of blackberry leaf aqueous extract on serum lipids during 2 weeks
Table 5. Mean of Blood glucose within 4 weeks by group separation
Groups Mean Std. Deviation
Extract
100mg/kg 300mg/kg
Total
Glibenclamide
negative
Control
positive
Control
Figure 6. Downswing of blood glucose in extract groups within first 3h and during 4 weeks
cells, increases insulin exocytosis. Glibenclamide compared with other anti-diabetic compounds, often are used as a standard drug to compare and estimate the anti-diabetic effect of various compounds [9].
Results of this study obtained in both short and long term period
Short-term administration of aqueous extract of raspberry leaves (3h): During the first three hours after administration of the extract, blood glucose levels in both groups receiving the extract significantly reduced; which these changes compared with the negative and positive controls, unlike Glibenclamide groups was significant. The results are compatible with the study of Hassan Jouad et al [4].
Long-term administration of aqueous extract of raspberry (4 weeks):
a)Body weight: administration of the extract, during the 4 weeks, steady and significant was increase in body weight of Rat, the amount of 57/18 percent, in the group receiving
the extract. Weight loss observed in the positive control group, probably due to the inability to produce and store fat, the body's inability to use glucose due to lack of insulin, which ultimately lead to impotence and loss of body weight.
b)The weight of internal organs: heart weights in the group receiving the extract significantly more than negative and positive controls groups; Average liver weight was no significant difference between groups. Average weight of both the left and right kidney, in the extract groups was significantly more than the other groups. In the group receiving the extract, the weight of both left and right in the group receiving 100mg / kg of extract was significantly more than the group receiving 100mg / kg of extract. There is direct and significant relationship between blood sugar and kidney size. In other words, with the increase in blood sugar, kidney size and body weight increases. Therefore, it can be concluded, diabetes can increase kidney weight [10]; but why in the extract groups, especially group receiving lower-dose of extract, the weight is more, needs to study
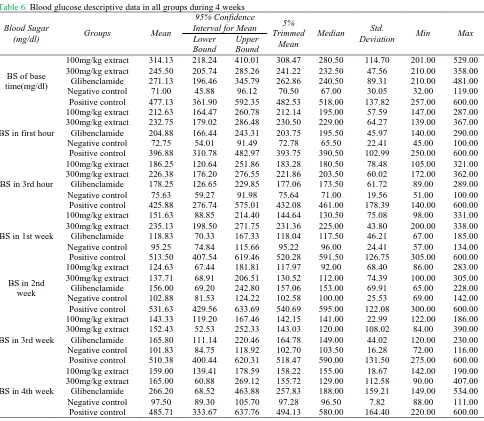
Table 6. Blood glucose descriptive data in all groups during 4 weeks
Blood Sugar
(mg/dl) Groups Mean
95% Confidence
Interval for Mean 5%
Trimmed Mean
Median Std.
Deviation Min Max
Lower Bound
Upper Bound
BS of base time(mg/dl) 100mg/kg extract 300mg/kg extract Glibenclamide Negative control Positive control 314.13 245.50 271.13 71.00 477.13 218.24 205.74 196.46 45.88 361.90 410.01 285.26 345.79 96.12 592.35 308.47 241.22 262.86 70.50 482.53 280.50 232.50 240.50 67.00 518.00 114.70 47.56 89.31 30.05 137.82 201.00 210.00 210.00 32.00 257.00 529.00 358.00 481.00 119.00 600.00
BS in first hour
100mg/kg extract 300mg/kg extract Glibenclamide Negative control Positive control 212.63 232.75 204.88 72.75 396.88 164.47 179.02 166.44 54.01 310.78 260.78 286.48 243.31 91.49 482.97 212.14 230.50 203.75 72.78 393.75 195.00 229.00 195.50 65.50 390.50 57.59 64.27 45.97 22.41 102.99 147.00 139.00 140.00 45.00 250.00 287.00 367.00 290.00 100.00 600.00
BS in 3rd hour
100mg/kg extract 300mg/kg extract Glibenclamide Negative control Positive control 186.25 226.38 178.25 75.63 425.88 120.64 176.20 126.65 59.27 276.74 251.86 276.55 229.85 91.98 575.01 183.28 221.86 177.06 75.64 432.08 180.50 203.50 173.50 71.00 461.00 78.48 60.02 61.72 19.56 178.39 105.00 172.00 89.00 51.00 140.00 321.00 362.00 289.00 100.00 600.00
BS in 1st week
100mg/kg extract 300mg/kg extract Glibenclamide Negative control Positive control 151.63 235.13 118.83 95.25 513.50 88.85 198.50 70.33 74.84 407.54 214.40 271.75 167.33 115.66 619.46 144.64 231.36 118.04 95.22 520.28 130.50 225.00 117.50 96.00 591.50 75.08 43.80 46.21 24.41 126.75 98.00 200.00 67.00 57.00 305.00 331.00 338.00 185.00 134.00 600.00
BS in 2nd week 100mg/kg extract 300mg/kg extract Glibenclamide Negative control Positive control 124.63 137.71 156.00 102.88 531.63 67.44 68.91 69.20 81.53 429.56 181.81 206.51 242.80 124.22 633.69 117.97 130.52 157.06 102.58 540.69 92.00 112.00 153.00 100.00 595.00 68.40 74.39 69.91 25.53 122.08 86.00 100.00 65.00 69.00 300.00 283.00 305.00 228.00 142.00 600.00
BS in 3rd week
100mg/kg extract 300mg/kg extract Glibenclamide Negative control Positive control 143.33 152.43 165.80 101.83 510.38 119.20 52.53 111.14 84.75 400.44 167.46 252.33 220.46 118.92 620.31 142.15 143.03 164.78 102.70 518.47 141.00 120.00 149.00 103.50 590.00 22.99 108.02 44.02 16.28 131.50 122.00 84.00 120.00 72.00 275.00 186.00 390.00 230.00 116.00 600.00
BS in 4th week
100mg/kg extract 300mg/kg extract Glibenclamide Negative control Positive control 159.00 165.00 266.20 97.50 485.71 139.41 60.88 68.52 89.30 333.67 178.59 269.12 463.88 105.70 637.76 158.22 155.72 257.83 97.28 494.13 155.00 129.00 188.00 96.50 580.00 18.67 112.58 159.21 7.82 164.40 142.00 90.00 149.00 88.00 220.00 190.00 407.00 534.00 111.00 600.00
8 Motevalian et al.
more and with higher sample size.
c)Serum components: There is a direct and documented relationship between blood sugar and HbA1c level. However, blood glucose of the group receiving extract declined on during the study, but because of half-life of this compound, which is between 90 to 120 days, (equal to red blood cells old), maybe some level of HbA1c is still remaining high, after correction of blood sugar; Therefore, in this study, the relationship mentioned above, except the group receiving 300 mg/kg of extract, wasn’t found. Significant reduction of CPK in the positive control group may be secondary to decreased muscle mass, due to its weight loss. Three component levels of AST, ALT and ALP, significantly were less than the control group positive.
Liver is one of the organs that are damaged in diabetes. Enzymes ALT, AST and ALP are abundant in the liver and are used in the assessment of liver disorders; Increase in the activity of these enzymes, is reflected liver damage [11]. Any condition that increases the metabolic activity or necrosis in liver tissue (especially diabetes [12]) may increase levels of enzymes in the blood. Also, the amount of these enzymes in the blood increases, causing damage to muscle and liver cells in patients with diabetes [13].
damaging effects of STZ, not only in the beta cells of pancreatic islets in Rat has been identified, but other organs like the liver [14] are involved, followed by production of free radicals, membrane lipid peroxidation in liver cells, and probably dysfunction of mitochondria [15]. Because the liver, the main site of detoxification of drugs in the body, and the use of "frequent" STZ in pancreatic cancer patients, can "sometimes" induce hepatotoxicity [16], most likely, the changes in the liver test, not only due to the toxic effects of this drug, but has been created due to complications from diabetes. The Increase of protein catabolism associated with gluconeogenesis and urea formation in diabetes are probably responsible for the increase in blood transaminase [17]. On the other hand, insulin is suppressing gene production of the gluconeogenic enzymes, and the ALT is a gluconeogenic enzyme, during diabetes that insulin signaling is impaired, ALT production is increased; This situation, even can unrelated with the liver damage [18]. Blackberry leaf aqueous extract probably are reducing liver enzyme levels in plasma by reducing the amount of damage in liver cells, and decreased glucose, cholesterol and triglyceride levels, and prevention of incidence of fatty liver [19]. According to this research, blackberry leaf aqueous extract is effective in preventing liver damage caused by diabetes; although more biochemical and pharmacological researches is needed, using it to treatment of diabetes.
Fat components: based on previous findings, the state of diabetes mellitus induced by streptozocin in rats is associated with significant and undesirable changes in serum lipid and lipoprotein levels. some tissues, especially the liver, has an important role in to uptake the blood free fatty acid, oxidation, its metabolic conversion to other materials, increased cholesterol and phospholipids synthesis and secretion of lipoproteins into the blood stream [20]. The
Increase in serum cholesterol and triglyceride levels in diabetic rats by streptozocin has been reported in another study that is consistent with the findings of the present study. On the other hand, in diabetes mellitus induced by streptozocin, the increase blood glucose levels can indirectly increase the amount of cholesterol, HDL and decrease triglyceride levels and LDL levels [21]; This results, partly explain the unfavorable changes in serum lipid levels in diabetic rats in this study. Blackberry plant, contains many polyphenolic compounds, which has been shown in previous studies, administration of these compounds (e.g. flavonoids) to diabetic animals, are reduced serum cholesterol and triglycerides [22]. Raspberry plants contain anthocyanins, which studies have shown that this compound, accompanied by other antioxidant compounds, can induce liver enzymes [23] and lipoprotein lipase enzyme activity returned to its normal state of being (shown, function of this enzyme decrease in type 1 diabetes induced in animal models and human [4]) As a result, it will reduce blood triglyceride levels, which can be justified partly results of this study.
In the group receiving 100 mg/kg of extract, the average blood sugar levels within 3 hours and during the first week was more, but during four weeks less than the group Glibenclamide (P>0.05). The average blood glucose over 3h and 1st week (P≤0.05) and during the four weeks (P>0.05) was more than negative control, and within three hours, 1st week and within four weeks more than the positive control(P≤0.05). Blood glucose levels in this group, in the first weeks after taking the extract, became less than 200 mg/dl, that the findings were consistent the results of study of Hassan Jouad and et al (who stated, the blood sugar became normal After the first week administration 100 mg/kg blackberry extract). In the receiving 300mg / kg of extract, the average blood glucose over 3h and 1st weeks, and during four weeks was more than Glibenclamide group (P>0.05); during the first 3h, 1st week (P≤0.05) and during the four weeks (P>0.05) more than negative control group, and within three hours, during the 1st week and four weeks less than the positive control group (P≤0.05); blood sugar levels in this group became less than 200 mg/dl in the second week after taking the extract.
Prior to the study of Hassan Jouad et al in 2002, no study was presented about the effects of lowering blood sugar in blackberry plants (Rubus Fruticosus). In that study, was determined administration of blackberry leaf extract in normal rats, had a great power of blood sugar reduction, because during the first hours of taking the extract, counter-regulatory mechanism was not return the blood sugar levels to normal values; Also, said that taking blackberry leaf extracts is not stimulating insulin secretion and increased its serum levels. According to the results, perhaps, dominant effects of aqueous extract of blackberry leaves on blood glucose, due to its extra pancreatic function on glucose metabolism [24]. Preliminary phytochemical analysis by Paris and Nothis method (1969) on the blackberry leaf extract has been done, which has been proven existence of flavonoids, antioxidants, polyphenols (e.g. allagic acid,
tannins, and anthocyanins), omega -3 (alpha-linolenic acid) and linoleic acid, copper, zinc, vitamin A and E and C. This plant has highest capacity to absorb free radicals [(ORAC value) oxygen radical absorbance capacity] among the fruits. (A free radical absorption capacity of this plant is about 5,347 per 100 grams of the herb.) [25]. Autoimmune destruction of pancreatic beta cells, is leading to decreased insulin production in type 1 diabetes, and free radical production in patients with diabetes attacks in unsaturated fatty acids of the biological membranes and reduce its mobility [26]. It is reported that foods containing antioxidants, plays an important role in preventing diabetes and cardiovascular disease, so that many compounds with antioxidant have anti-diabetic role, too [27]. According to, diabetes mellitus is associated with increased oxidative stress, that is reason of some blood biochemical changes in diabetes mellitus, especially in insulin-dependent type [28]; the blood glucose lowering effect was observed resulting from the consumption of edible blackberry extracts is justified by strong antioxidants, particularly flavonoids. These compounds inhibits free radical, therefore has a protective effect on pancreatic beta cells, that due to this, prevent to cell damages, accelerate the repair of damaged beta cells, and stimulate them to secrete insulin [29]. Also, these compounds can be increased activity of liver glucokinase and hexokinase. Flavonoids can inhibit the absorption of glucose in the intestine, specifically is done by the operation of glucose transporter2 (GLUT2) [30]. The consequence of this activity is the decrease in serum glucose. High amounts of fiber in blackberry extract may inhibit the absorption of carbohydrates from the intestine, can cause the decrease blood sugar; Of course, in this study, were not measured the amount of fiber in the extract, but changes in the bowel habit of rats (e.g. loosening), which may result from lack of food absorption.
In the group receiving Glibenclamide, blood sugar levels reduced from zero time to the 1st week, and then in the sequel course of study has upswing, it can be said that all pancreatic beta cells in rats hasn’t been destroyed with STZ injection, (because, Glibenclamide reduce blood sugar via the stimulation of insulin secretion.); and on the other hand, the results of this study is consistent with previous findings, which said "the effect of chronic administration of Glibenclamide (14 days vs. 3 days) is reduced, and long-term effectiveness of Glibenclamide reduces the cellular level", to some extent [30].
CONFLICT OF INTEREST
The authors declare that this research does not have any conflict of interest with anyone or any institute.
REFERENCES
1. Marles RJ, Farnsworth NR. Antidiabetic plants and their active
constituents. Phytomedicine 1995;12:137-165.
2. Zargari A. Therapeutic plants. 4th ed. Tehran: Tehran University press;
1989.
3. Shariat Samsam SH. Extract methods of efficacious elemant of medical
planet and its assessment; Isfahan: Many 1992.
4. Jouad H, Maghrani M, Eddouks M. Hypoglycaemic effect of Rubus
fructicosis L. and Globularia alypum L. in normal and streptozotocin-induced diabetic rats. J Ethnopharmacol 2002;81351- 356.
5. Eydi A, Eydi M, Ziapour H. Hypoglycemic effect of Phaseolus
vulgaris in normal and STZ induced diabetic rats. JSIAU 2006;62:13-19.
6. Animal models for diabetic complications consortium protocol:
low-dose streptozotocin induction protocol (mouse); 2004.
http://www.amdcc.org/shared/showfile.aspx?docty peid=3&docid=19. Accessed November 15, 2007.
7. Mokhtary M, Sharifi E, Sabzevari Fard A. Study of hypoglycemic and
hypolipidemic effect of alcoholic extract of P. dactilifera in male diabetic rats. JKUMS 2007;12:9.
8. Szkudelski T. The Mechanism of Alloxan and Streptozotocin Action
in-Cells of the Rats Pancreas. Physiol Res 2001;50:536-456.
9. Eliasson L, Renstrom E, Ammala C, Berggren PO, Bertorello AM,
Bokvist K, et al. PKC –dependent stimulation of exocytosis by sulphonylureas in pancreatic beta-cells. Science 1996;271:813-5.
10. Golalipour MJ, Mohammad Gharravi A, Ghafari S, Azarhoush R,
Afshar M. Effect of URTICA DIOICAon renal histologic alterations in streptozotocin diabetic Rats. Iran J Diabet Lipid 2010;9(3):218-226.
11. Burger C, Fischer DR, Cordenuzzi DA, Batschauer APB, Filho VC,
Soares ARS. Acute and subacute toxicity of the hydroalcoholic extract from Wedelia paludosa (Acmela brasiliensis) (Asteraceae) in mice. J Pharm Sci 2005;8:370–3.
12. Larcan A, Lambert H, Laprevote-Heully MC, Delorme N. Light and
electron microscopic study of hepatic lesions in the course of hyperlactatemia in diabetic patients. Diabetes Metab 1979;5:103–12.
13. Vozarova B, Stefan N, Lindsay RS, Saremi A, Pratley RE, Bogardus C,
et al. High alanine aminotransferase is associated with decreased hepatic insulin sensitivity and predicts the development of type 2 diabetes. Diabetes 2002;51:1889–1895.
14. Kume E, Fujimura H, Matsuki N, Ito M, Aruga C, Toriumi W, et al. Hepatic changes in the acute phase of streptozotocin (SZ)- induced diabetes in mice. Exp Toxic Pathol 2004;55:467–80.
15. Ahn T, Yun CH, Oh DB. Tissue-specific effect of ascorbic acid
supplementation on the expression of cytochrome P450 2E1 and oxidative stress in streptozotocin-induced diabetic rats. Toxicol Lett 2006;166: 27–36.
16. Hardman JG, Limbird LE. Goodman and Gilman’s The
Pharmacological Basis of Therapeutics, 10th ed. New York: McGraw-Hill; p. 1399; 2001.
17. Prakasam A, Sethupathy S, Viswanathan Pugalendi K. Influence of
casearia esculenta root extract on Protein metabolism and marker enzymes in Streptozotocin-induced diabetic rats. Pol J Pharmacol 2004;56:587–93.
18. Vozarova B, Stefan N, Lindsay RS, Saremi A, Pratley RE, Bogardus C,
et al. High Alanine Aminotransferase Is Associated With Decreased Hepatic Insulin Sensitivity and Predicts the Development of Type 2 Diabetes. Diabetes 2002;51:1889–95.
19. Marchesini G, Bugianesi E, Forlani G, Cerrelli F, Lenzi M, Manini R,
et al. Nonalcoholic fatty liver, steatohepatitis, and the metabolic syndrome. Hepatology 2003;37(4):917–923.
20. Yanardag R, Bolkent S, Ozsoy-Sacan O, Karabulut- Bulan O. The
effect of chard (Beta vulgaris L. var. cicla) extract on the kidney tissue, serum urea, and creatinine levels of diabetic rats. Phytotherapy Res 2002;16:758-61.
21. Pushparaj PN, Low HK, Manikandan J, Tan BK, Tan CH.
Anti-diabetic effects of Cichorium intybus in streptozotocin-induced diabetic rats. J Ethnopharmacol 2007;111:430-4.
22. Vessal M, Hemmati M, Vasei M. Antidiabetic effects of quercetin in streptozocin-induced diabetic rats. Comp Biochem Physiol C Toxicol Pharmacol 2003;135:357-364.
23. Milbury PE, Graf B, Curran-Celentano JM, Blumberg J. Bilberry
(Vaccinium myrtillus) anthocyanins modulate heme oxygenase-1 and glutathione S-transferase-pi expression in ARPE-19 cells. Invest Ophthalmol Vis Sci 2007;48:2343-9.
24. Pushparaj PN, Low HK, Manikandan J, Tan BK, Tan CH.
Anti-diabetic effects of Cichorium intybus in streptozotocin-induced diabetic rats. J Ethnopharmacol 2007;111:430-4.
10 Motevalian et al.
25. Gudej J, Tomczyk M. Determination of flavonoids, tannins and ellagic
acid in leaves from Rubus L. species. Arch Pharmacal Res 2004;27(11):1114–1119.
26. Rifai N, Bochorik PS, Albers JJ. Lipids, lipoproteins and
apolipoproteins. In: Burtis C.A, Ashwood E.R (Eds.), Tietz Textbook of Clinical Chemistry, 3nd ed. Philadelphia: W.B Saunders Company 1999:809-61.
27. Livingstone C, Lyall H, Gould GW. Hypothalamic GLUT 4
expression: a glucose-and insulin-sensing LiXM.
ProtectiveeffectofLyciumbarbarumpolysaccharidesonstreptozocin inducedoxidativestressinrats. Int J Biol Macromol 2007;40:461-5.
28. Tiwari AK, Rao JM. Diabetes mellitus and multiple therapeutic of
phytochemical: Present status and future prospects. Curr Sci 2002;283: 30-38.
29. Ragavan B, Krishnakumari S. Antidiabetic effect of T. Aejuna bark
extraction alloxan induced diabetic rats. Ind J Clin Biochem 2006;21(2):123–128.
30. Ball AJ, Flatt PR, McClenaghan NH. Desensitization of sulphonylurea-
and nutrient- induced insulin secretion following prolonged treatment with glybenclamide. Eur J Pharmacol 2000;408: 27-33.