_____________________________________________________________________________________________________ *Corresponding author: Email: y.lessoy@yahoo.fr;
Low Occurrence of Mycotoxins in Traditional Peanut
Butter is Associated with Risk for Consumers
Zamblé Abel Boli
1, Lessoy Thierry Zoué
2*, Marina Koussemon
1and Rose Koffi-Nevry
11Laboratory of Biotechnology and Food Microbiology, Department of Food Science and Technology
(UFR-STA), University Nangui Abrogoua, 02 BP 801, Abidjan 02, Côte d’Ivoire.
2
Laboratory of Biotechnology, Department of Biosciences, University Felix Houphouët-Boigny, 22 BP 582, Abidjan 22, Côte d’Ivoire.
Authors’ contributions
This work was carried out in collaboration between all authors. Authors ZAB and LTZ designed the study, performed the statistical analysis, wrote the protocol and wrote the first draft of the manuscript. Authors MK and RKN managed the analyses of the study. Author LTZ managed the literature searches. All authors read and approved the final manuscript.
Article Information
DOI: 10.9734/EJNFS/2017/36475
Received 29th August 2017 Accepted 26th September 2017 Published 23rd October 2017
ABSTRACT
Aims: The aim of this study was to conduct a quantitative risk assessment linked to Aflatoxin B1 and Ochratoxin A exposure through peanut butter consumption by population of Abidjan District (Côte d’Ivoire).
Study Design: Sampling of peanut butter from markets, analysis of peanut butters samples, consumption survey and quantitative risk assessment.
Place and Duration of Study: University of Nangui Abrogoua, Abidjan (March to August 2014) and University of Ghent, Faculty of Bioscience Engineering, Belgium (September to December 2016).
Methodology: 45 composite samples of peanut butter from 225 total samples were analyzed by HPLC to determine the AFB1 and OTA contents. 450 households were randomly selected and a questionnaire was used to assess the uses of peanut butter, the quantities used for sauce making and the frequency of peanut butter sauce consumption. A probabilistic quantitative risk assessment based on Monte Carlo simulation was carried out to determine the exposure associated with the AFB1 and OTA occurrence.
Results: The values of AFB1 and OTA contents were in the range of 1.522-1.641 ppb. Peanut butter is mainly used for preparation of sauces (84.20 ± 9.38%) and more than half of the
consumers of peanut butter sauce are children (59 to 78 %). The serving size is about 750 g considering a frequency of 2 times consumption per week (55%). For the upper bond scenario, the exposure value for AFB1 was 2.193 ng/kg bw/day while that of OTA was 2.012 ng/kg bw/day for the 99.0th percentile of consumers. Overall, 10.1-15.6% of the population might be exposed to AFB1 chronic toxicity.
Conclusion: This study highlighted a relatively high exposure to AFB1 in peanut butter sauce. Therefore there is a need to implement strategies based on Good Agricultural and Good Hygiene Practices for AFB1 and OTA mitigation along the peanut butter chain in Ivory Coast.
Keywords: Aflatoxin B1; ochratoxin A; peanut butter; consumption survey; risk assessment.
1. INTRODUCTION
Groundnut or peanut (Arachis hypogaea) is an oleaginous plant belonging to the family of Fabaceae which includes the majority of leguminous seeds. The world production of groundnuts is estimated at 45 million tons with an average productivity of 1.8 ton per hectare in 2013. The main producers are China and India; both are providing more than 60% of the production. Senegal and Sudan are the main producers in Africa with 25% of the production [1].
In West Africa, these dicotyledonous plants serve as the major source of livelihood in terms of nutrients (lipids, proteins) and income generation and they are processed into oil, paste or butter, flour and various derivatives such as snacks and cakes [2]. The traditional processing peanut chain in West Africa and particularly in Ivory Coast is characterized by four main steps: harvesting, stripping, sun-drying, sorting and roasting. Along this short food chain compared to industrial ones, the main hazards are mycotoxins especially Aflatoxin B1 (AFB1) and Ochratoxin A (OTA) produced by toxigenic fungi Aspergillus, Penicillium and Fusarium [3,4]. Indeed, groundnuts are growing from the soil which is the primary reservoir for many toxigenic fungi [5]. Thus, groundnuts could support aflatoxigenic and ochratoxigenic mould growth and OTA and AFB1 production due to many biotic (insects, nematodes) and abiotic (moisture, activity water, temperature) factors in the field and also during storage or transportation [3,6]. Aflatoxin B1 (AFB1), the most toxic of the aflatoxins, is a potent liver carcinogen while OTA is known for confirmed nephrotoxic effect and suspected carcinogenicity [7,8]. In the European Union, maximum limits (MLs) of 2 and 8 ppb for AFB1 in peanuts intended for direct human consumption were adopted. As for Ochratoxin A, the maximum limits set by the European Union are 3 and 5 ppb
for cereals [9]. Toxicological reference values have been defined for AFB1 and OTA as follow: Provisional Maximum Tolerable Daily Intake (PMTDI) of 1 ng/kg bw/day was considered for AFB1 and Provisional Tolerable Daily Intake (PTDI) of 17.1 ng/kg bw/day for OTA [10,11]. Furthermore, the physico-chemical properties of AFB1 and OTA revealed that they are quite stable during heat processing operations leading to their presence in peanuts products as peanut butter that is traditionally made by grinding or crushing dried and roasted groundnuts [12,13]. In fact, many recent reports have revealed a co-occurrence of AFB1 and OTA in peanut products [13–15]. This co-occurrence may result in some cases to synergistic action in humans and animals based on toxicological effects of AFB1 and OTA [16].
Except for some qualitative studies on urine biomarkers of AFB1 and OTA in humans linked to the consumption of raw and processed peanut in Ivory Coast [15], there is a lack of extensive mycotoxins risk assessment of processed peanut as peanut butter that is purchased in retail markets and mixed with different ingredients for cooking in order to make sauce that accompany starchy foods. This study was therefore undertaken to implement a quantitative risk assessment linked to AFB1 and OTA exposure through peanut butter sauce consumption by Ivorian population. The results of this study could serve as starting point for providing sustainable solutions in order to reduce or alleviate mycotoxins health related problems in Ivory Coast. Indeed, It’s important recalling that the final uses of risk assessment outputs are: the
characterization of the most important factors influencing the risk of hazards identified in the food chain, the identification of strategies for risk mitigation and the
2. MATERIALS AND METHODS
2.1 Samples Collection and HPLC
Analysis
In order to establish mycotoxins (AFB1 and OTA) exposure being linked to the consumption of peanut butter in the District of Abidjan (Ivory Coast), 225 samples were aseptically collected (sterile sampling material) from 9 main markets and transported in icebox (1-4°C) to the National Laboratory of Animal and Agricultural for AFB1 and OTA determination. For this, 45 composite samples were used to determine the AFB1 and OTA contents by using HPLC method after extraction and purification through immunoaffinity column as described in previous published work [13]. The HPLC operating conditions are described in the Table 1.
2.2 Consumption Survey
450 households (50 per commune) were randomly selected for the consumption survey. This investigation was carried out by using a questionnaire in order to collect the following information: number of people living in the households, categories of consumers based on age and gender, uses of peanut butter, quantities of peanut butter bought on markets for the preparation of sauces and frequency of peanut butter sauce consumption. The respondents were housewives.
2.3 Risk Assessment
2.3.1 Exposure assessment
A probabilistic model based on Monte Carlo simulation was carried out to determine the
exposure associated with the mycotoxins (AFB1 and OTA) in peanut butter. A modular process risk model (MPRM) was used to define the distribution of inputs and outputs (Table 2). Three simulations (5000 iterations) were performed with the add-in @risk software for Microsoft Excel version 7 (Palisade Corporation, USA).
2.3.2 Risk characterization
The calculated exposure values were compared with tolerable daily intakes (TDIs). For AFB1 a Provisional Maximum Tolerable Daily Intake (PMTDI) of 1 ng/kg bw/day was considered for adults and for children without hepatitis B [10]. For OTA, a Provisional Tolerable Daily Intake (PTDI) of 17.1 ng/kg bw/day set by the European Food Safety Authority [11] was used in this study. Additionally, the Bench Mark Dose Lower limit for 10% increased cancer risk (BMDL10) was combined with the AFB1 or OTA exposure to estimate the Margin of Exposure (MOE) used to quantify the increase of cancer risk. For AFB1 the value of BMDL10 was 170 ng/kg bw/day [10] while that of OTA was chosen at 16.1 μg/kg bw/day or 16100 ng/kg bw/day [17,18].
2.4 Statistical Analysis
All analyses were carried out in triplicates and data expressed as means ± standard deviation. One way analysis of variance (ANOVA) and Duncan’s multiple range test (DMRT) were carried out to assess significant differences between means (p<0.05)using STATISTICA 7.1 (StatSoft). The add-in @risk® for Microsoft Excel version 7 (Palisade Corporation, USA) was used for the probabilistic risk assessment modeling.
Table 1. Operating conditions for HPLC analysis of Aflatoxin B1 and Ochratoxin A in peanut butter samples
Chromatograph Operating conditions
AFB1 OTA
Column Shim-pack CLCG-ODS C18,
(4 µm, 150 mm x 4,6 mm)
Shim-pack CLCG-ODS C18, (4 µm, 150 mm x 4,6 mm)
Mobile phase MetOH/ACN (50:50; v/v) AcetOH/H2O/ACN (1/50/49; v/v/v)
Flow 0,5 mL/min 0,5 mL/min
Column temperature 40°C 40°C
Injected volume 20 μL 100 μL
Detector (λex: 365 nm; λem: 435 nm) (λex: 330 nm ; λem : 460 nm)
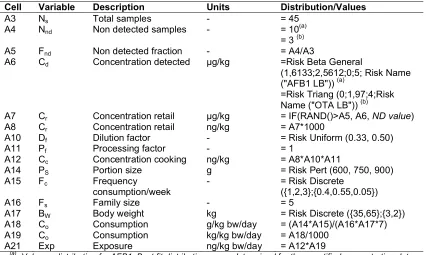
Table 2. Variables of modular process risk model for Aflatoxin B1 and Ochratoxin A exposure
Cell Variable Description Units Distribution/Values
A3 Ns Total samples - = 45
A4 Nnd Non detected samples - = 10
(a)
= 3 (b)
A5 Fnd Non detected fraction - = A4/A3
A6 Cd Concentration detected μg/kg =Risk Beta General
(1,6133;2,5612;0;5; Risk Name ("AFB1 LB")) (a)
=Risk Triang (0;1,97;4;Risk Name ("OTA LB")) (b)
A7 Cr Concentration retail μg/kg = IF(RAND()>A5, A6, ND value)
A8 Cr Concentration retail ng/kg = A7*1000
A10 Df Dilution factor - = Risk Uniform (0.33, 0.50)
A11 Pf Processing factor - = 1
A12 Cc Concentration cooking ng/kg = A8*A10*A11
A14 PS Portion size g = Risk Pert (600, 750, 900)
A15 Fc Frequency
consumption/week
- = Risk Discrete
({1,2,3};{0.4,0.55,0.05})
A16 Fs Family size - = 5
A17 BW Body weight kg = Risk Discrete ({35,65};{3,2})
A18 Co Consumption g/kg bw/day = (A14*A15)/(A16*A17*7)
A19 Co Consumption kg/kg bw/day = A18/1000
A21 Exp Exposure ng/kg bw/day = A12*A19
(a)
: Value or distribution for AFB1. Best fit distributions were determined for the quantified concentration data using the Chi-square statistics (mean, skewness, 50, 90 and 95 percentiles)
(b)
: Value or distribution for OTA. Best fit distributions were determined for the quantified concentration data using the Chi-square statistics (mean, skewness, 50, 90 and 95 percentiles)
ND value: Non detected value = 0 for lower bound; = LOD/2 for medium bound; = LOD for upper bound [17]. The distribution for dilution factor, portion size, frequency consumption, family size and body weight was based on
survey results
3. RESULTS AND DISCUSSION 3.1 Occurrence of AFB1 and OTA
The chromatogram of AFB1 and OTA after extraction is depicted in Fig. 1. The results of HPLC analysis of AFB1 and OTA in peanut butter samples are presented in Table 3. The maximum value for AFB1 was 4.38 ppb while that of OTA was 3.78 ppb. The mean value of AFB1 was in the range of 1.522-1.524 ppb and that of OTA was in the range of 1.638-1.641 ppb with no significant difference (p˃0.05). The presence of AFB1 and OTA in analyzed peanut butter samples may be linked to the intrinsic characteristics of groundnuts that favor fungal growth and also the poor drying and storage methods along the traditional processing chain [4]. Indeed, groundnuts are pulled up at harvest (4-5 months after planting). At this stage peanut contains 25 to 50% moisture and contamination with Aspergillus and Penicillium moulds is associated with drought stress and insect damages. Drought stress can also cause pod
splitting in the soil, leaving the kernels exposed to the soil microflora [5]. After harvesting and stripping, the collected groundnuts pods are shelled and then sun-dried. Contamination by toxigenic moulds will occur at this steps if the recommended moisture level (10% or less) is not achieved within a short period of time. Indeed, Aspergillus and Penicillium can easily grow and produce AFB1 and OTA at Aw ˃ 0.85 [19]. However, the mean value for AFB1 was low compared to the limit of 2 ppb set by the European Union. The non-detected analytical results were replaced by zero or the limit of detection (LOD) to produce an upper and lower boundary [10].
3.2 Consumption Survey
used for the preparation of sauces in the households (84.20 ± 9.38) to be followed by cakes (8.06 ± 2.23), caramels (7.14 ± 3.79) and others (0.60 ± 0.11). For sauce making, women mixed peanut butter and water generating a dilution factor of 0.33 to 0.5. The domestic temperatures used for cooking (80-100°C) have no reduction effect on AFB1 and OTA concentrations as underlined by some authors [20]. The different categories of consumers are presented in Fig. 2. More than half of the consumers of peanut butter sauce are children
(59 to 78 %) followed by adults (7 to 31 %) and infants (5 to 15 %). After cooking, the serving size is 600 g for minimum, 750 g for the most likely and 900 g of sauce for the maximum, considering a frequency of 1 consumption per week (40%), 2 times consumption per week (55%) and 3 times consumption per week (5%) by a family of 5 members (3 children and 2 adults). It was assumed that the consumption was equally shared among the family members [21]. The considered body weight was 35 kg for children and 65 kg for adults.
Fig. 1. Chromatogram of Aflatoxin B1 and Ochratoxin A extracted from peanut butter samples
Table 3. Aflatoxin B1 and Ochratoxin A contents in peanut butter samples based on upper and lower boundary (LB and UB) scenarios
Communes AFB1 (ppb), LOD = 0.01 ppb OTA (ppb) LOD = 0.05 ppb
LB UB LB UB
Abobo
1.93 1.93 1.98 1.98
1.64 1.64 2.32 2.32
1.94 1.94 2.02 2.02
2.48 2.48 2.45 2.45
2.11 2.11 1.88 1.88
Adjamé
1.90 1.90 2.13 2.13
2.08 2.08 2.09 2.09
3.02 3.02 3.78 3.78
1.15 1.15 2.17 2.17
0.00 0.01 0.98 0.98
Attécoubé
4.38 4.38 1.23 1.23
3.02 3.02 2.09 2.09
0.00 0.01 2.37 2.37
3.45 3.45 1.97 1.97
1.60 1.60 2.94 2.94
Cocody
1.68 1.68 1.99 1.99
1.98 1.98 0.00 0.05
1.22 1.22 1.83 1.83
3.47 3.47 1.92 1.92
1.20 1.20 2.01 2.01
Koumassi
1.14 1.14 1.97 1.97
0.00 0.01 2.34 2.34
0.00 0.01 1.16 1.16
3.51 3.51 2.17 2.17
0.00 0.01 1.96 1.96
Marcory
1.94 1.94 2.47 2.47
0.00 0.01 1.13 1.13
3.11 3.11 2.06 2.06
0.00 0.01 1.17 1.17
0.00 0.01 1.97 1.97
Port-bouet
1.16 1.16 0.88 0.88
1.54 1.54 1.01 1.01
0.64 0.64 0.24 0.24
2.06 2.06 0.45 0.45
0.00 0.01 0.07 0.07
Treichville
0.00 0.01 0.61 0.61
0.31 0.31 1.17 1.17
0.07 0.07 0.00 0.05
0.47 0.47 2.02 2.02
0.30 0.30 0.00 0.05
Yopougon
1.66 1.66 1.04 1.04
3.02 3.02 1.33 1.33
1.19 1.19 2.20 2.20
2.16 2.16 2.15 2.15
2.97 2.97 1.98 1.98
n 45 45 45 45
Min 0.000 0.010 0.000 0.050
Max 4.38 4.38 3.78 3.78
Mean ± SD 1.52 ± 1.24a 1.52 ± 1.24a 1.64 ± 0.83a 1.64± 0.82a
Table 4. Consumption uses of peanut butter in the investigated households
Communes Uses (%)
Sauces Caramels Cakes Other
Abobo 86.70±4.20c 7.80±3.54b 5.50±1.73b 0.00±0a
Adjamé 92.70±6.15c 1.30±1.07a 3.40±1.96b 2.60±2.06c
Attécoubé 89.30±2.96c 5.20±1.31ab 5.50±2.51b 0.00±0.00a
Cocody 72.60±3.14ab 12.80±2.50c 13.50±0.87c 1.10±0.26b
Koumassi 79.10±5.43b 9.20±1.71bc 11.70±4.94c 0.00±0.00a
Marcory 89.50±5.41c 6.40±4.47ab 4.10±0.98b 0.00±0.00a
Port-Bouët 67.30±1.39a 9.20±2.71bc 23.50±3.89d 0.00±0.00a
Treichville 87.50±1.80c 7.20±2.71b 5.30±1.84b 0.00±0.00a
Yopougon 93.10±1.01c 5.20±1.11ab 0.00±0.00a 1.70±0.36bc
Average 84.20±9.38 7.14±3.79 8.06±2.23 0.60±0.11
Means in column with different superscripts are significantly (p<0.05) different
3.3 Risk Assessment
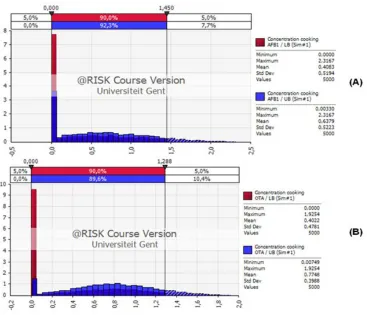
The distribution of consumption data (Fig. 3) revealed that the population consumed 0.315-1.363 g peanut butter sauce/kg body weight/day with 90% of probability. Fig. 4 shows the probabilistic distributions of concentration (AFB1 and OTA), for lower boundary (LB) and upper boundary (UB) by using @Risk software. For the scenario of lower boundary (non detected values = 0), the concentration of AFB1 in peanut butter sauce ranged between 0 and 1.450 ppb for 90% of probability. For OTA at lower boundary, the concentration ranged between 0 and 1.288 ppb for 90% of probability.
The values of exposure to AFB1 and OTA in peanut butter sauce for the 2 scenarios (LB, UB) are presented in the Table 5. Considering the
high level of consumers population (99.0th percentile) the exposure values for AFB1 were 2.072 and 2.193 ng/kg bw/day for lower bound and upper bound, respectively. Compared to the AFB1 exposures values, those of OTA were slightly lower (1.832 and 2.012 ng/kg bw/day) for the 99.0th percentile of consumer’s population. The calculated exposure values for AFB1 in this study were lower than aflatoxins exposure in Ghana (9.9-99.2 ng/kg bw/day) measured from peanut consumption. Nevertheless, these values were higher than the estimated AFB1 exposure (0.63-0.66ng/kg bw/day) for urban Lebanese adults [22]. The main sources of uncertainty in the exposure distribution values are: the non detected values for the concentration (left censored values) and the number of repetition for the tested samples by using the HPLC method.
Fig. 4. Concentration data distribution of Aflatoxin B1 (A) and Ochratoxin A (B) in peanut butter sauce
The use of PMTDI value of AFB1 (1 ng/kg bw/day) as reference, indicated that 10.1-15.6% of the population might be exposed to a chronic toxicity due to AFB1 by peanut butter consumption. For OTA, there is no risk of chronic toxicity for all the population consuming peanut butter sauce by using the PTDI of 17.1 ng/kg bw/day as reference value. In order to evaluate the carcinogenic effects due to chronic toxicity, the values of margin of exposure (MOE) were calculated (Table 6). The MOE values varied from 77 to 3195 for AFB1 while those related to OTA varied from 8001 to 203539. The calculated MOEs for AFB1 were all below 10,000 and those of OTA were above 10,000 except for P99. According to EFSA [23], a MOE larger than 10,000 based on the BMDL10 could be considered as low health concern [24]. In our study, the consumption of peanut butter by Ivorian population should be considered as a public health concern with regard to AFB1 contamination. Indeed, many studies have demonstrated the association between the ingestion of aflatoxin-contaminated foods and the
risk of hepatocellular carcinoma (HCC) [25]. It’s important recalling that 4.6–28.2% of all global HCC cases may be attributable to AFB1 exposure. Moreover, for individuals exposed to chronic hepatitis B virus (HBV) and AFB1 together, cancer risk is increasing 30 times greater [26]. Only the high percentiles (P99) for OTA give rather low MOE values, indicating a potential health concern. Moreover, the magnitude of the MOE can be used by risk managers for priority setting and for advising the exposures to be reduced to as low as reasonably achievable [27]. In addition, the co-occurrence of AFB1 and OTA may explain a synergistic action exposing the consumers (children and adults) to serious health problems on a regularly basis of consumption of sauces made by using peanut butter. In order to reduce the risk due to exposure of AFB1 and OTA, a food safety management system (FSMS) of the peanut butter must be implemented. For this, the
developed FSMS must focus on Good
Table 5.Dietary exposure (ng/kg bw/day) of Aflatoxin B1 and Ochratoxin A associated with the consumption of peanut butter sauce
Exposure AFB1 (ng/kg bw/day) Exposure OTA (ng/kg bw/day) AFB1 % PMTDI OTA % PTDI Lower bound (LB)
Mean 0.331 33.1 0.341 1.99
P50 0.053 5.32 0.079 0.46
P75 0.536 53.6 0.581 3.39
P90 1.001 100.1 1.001 5.85 P95 1.376 137.6 1.291 7.54 P99 2.072 207.2 1.832 10.71
Upper bound (UB)
Mean 0.510 51.0 0.638 3.73
P50 0.379 37.9 0.546 3.19
P75 0.764 76.4 0.879 5.14
P90 1.242 124.2 1.280 7.48 P95 1.600 160.0 1.537 8.98 P99 2.193 219.3 2.012 11.76
PMTDI: Provisional maximal tolerable daily intake = 1 ng/kg bw/day for AFB1 PTDI: Provisional tolerable daily intake = 17.1 ng/kg bw/day for OTA
The values in bold are greater than PMTDI or PTDI
Table 6. Margin of exposure (MOE) estimation based on dietary exposure to Aflatoxin B1
and Ochratoxin A in peanut butter sauce MOE AFB1 MOE OTA Lower bound (LB)
Mean 513 47214
P50 3195 203539
P75 317 27710
P90 169 16083
P95 123 12470
P99 82 8788 Upper bound (UB)
Mean 333 25235
P50 448 29487
P75 222 18316
P90 136 12578
P95 106 10474
P99 77 8001
The values in bold are below 10,000 based on BMDL10
MOE: Margin of exposure
groundnuts, use of appropriate fertilizers and pesticides, crop rotation, irrigation management, early harvesting, proper sun-drying and storage [28,29]. At the country level, authorities must enforce regulation on mycotoxins in commodities and react to new challenges such as climate change to develop technologies for AFB1 and OTA control.
4. CONCLUSION
The results of this study highlighted a relatively high exposure to AFB1 in peanut butter compared to the tolerable daily intake. Thus, the
regular consumption of peanut butter by the Ivorian population constitutes a public health problem due the carcinogenic and nephrotoxic effects of AFB1 and OTA respectively. Therefore there is a need to implement strategies for mitigation of AFB1 and OTA occurrence along the peanut butter chain in Ivory Coast. These strategies should consist of applying GAP/GMP/GHP at farm level and HACCP at industrial level to ensure a sustainable food safety management system. To be effective in the long term, AFB1 and OTA reduction in the food chain must be directed at (i) educating families, farmers, stakeholders along the value chain as well as governments about the health risks associated with mycotoxins; (ii) investing in local capacity to support further activities both to reduce mycotoxins in agricultural products and to monitor mycotoxin levels in crops.
ACKNOWLEDGEMENTS
Authors would like to thank the VLIR-UOS and the promoters of the ITP Food Safety 2016 at Ghent University, Belgium.
COMPETING INTERESTS
Authors have declared that no competing interests exist.
REFERENCES
Kane A, Tidiane Ba A. L’arachide au Sénégal: Etat des lieux, contraintes et perspectives pour la relance de la filière. OCL. 2014;21(2):D205.
Available:http://www.ocl-journal.org/10.1051/ocl/2013039
2. Waliyar F, Umeh VC, Traore A, Osiru M, Ntare BR, Diarra B, Kodio O, Vijay Krishna Kumar K, Sudini H. Prevalence and distribution of aflatoxin contamination in groundnut (Arachis hypogaea L.) in Mali, West Africa. Crop Prot. 2015;70:1–7. Available:http://www.sciencedirect.com/sci ence/article/pii/S0261219414003792 3. Zinedine A, Brera C, Elakhdari S, Catano
C, Debegnach F, Angelini S, De Santis B, Faid M, Benlemlih M, Minardi V, Miraglia M. Natural occurrence of mycotoxins in cereals and spices commercialized in Morocco. Food Control. 2006;17(11):868– 74.
Available:http://linkinghub.elsevier.com/retr ieve/pii/S0956713505001416
4. Bryden WL. Mycotoxin contamination of the feed supply chain: Implications for animal productivity and feed security. Anim Feed Sci Technol. 2012;173(1–2):134–58. Available:http://linkinghub.elsevier.com/retr ieve/pii/S0377840111005037
5. Atayde DD, Reis TA, Godoy IJ, Zorzete P, Reis GM, Corrêa B. Mycobiota and aflatoxins in a peanut variety grown in different regions in the state of São Paulo, Brazil. Crop Prot. 2012;33:7–12.
Available:http://linkinghub.elsevier.com/retr ieve/pii/S0261219411003693
6. Molinié A, Faucet V, Castegnaro M, Pfohl-Leszkowicz A. Analysis of some breakfast cereals on the French market for their contents of ochratoxin A, citrinin and fumonisin B1: Development of a method for simultaneous extraction of ochratoxin A and citrinin. Food Chem. 2005;92(3):391– 400.
Available:http://linkinghub.elsevier.com/retr ieve/pii/S0308814604005138
7. Khlangwiset P, Wu F. Costs and efficacy of public health interventions to reduce aflatoxin-induced human disease. Food Addit Contam Part A Chem Anal Control Expo Risk Assess. 2010;27(7):998–1014. Available:http://www.ncbi.nlm.nih.gov/pub med/20419532
8. Food WHO. Evaluation of certain food additives and contaminants. World Health Organ. 2013;1–75.
Available:http://www.ncbi.nlm.nih.gov/pub med/24779311
9. The Commission of the European
Communities. Commission Regulation (EU) No 165/2010 of 26 February 2010 amending Regulation (EC) No 1881/2006 setting maximum levels for certain contaminants in foodstuffs as regards aflatoxins. Off J Eur Union. 2010;L 50/ 8(2009):5.
10. Opinion of the scientific panel on contaminants in the food chain [CONTAM] related to the potential increase of consumer health risk by a possible increase of the existing maximum levels for aflatoxins in almonds, hazelnuts and pistachios and derived products. EFSA J. 2007;5(3):446.
Available:http://doi.wiley.com/10.2903/j.efs a.2007.446
11. Zinedine A. Ochratoxin A in Moroccan foods: occurrence and legislation. Toxins. 2010;2(5):1121–33.
Available:http://www.ncbi.nlm.nih.gov/pub med/22069630
12. Ezekiel CN, Sulyok M, Warth B, Odebode AC, Krska R. Natural occurrence of mycotoxins in peanut cake from Nigeria. Food Control. 2012;27(2):338–42.
Available:http://linkinghub.elsevier.com/retr ieve/pii/S0956713512001727
13. Boli Z, Zoue L, Koffi-Nevry R, Koussemon M. fungal contamination and mycotoxins’ occurrence in peanut butters marketed in abidjan district (Côte d’ivoire). Food Environ Saf J. 2016;13(3).
Available:http://www.fia.usv.ro/fiajournal/in dex.php/FENS/article/view/110
14. Darwish WS, Ikenaka Y, Nakayama SMM, Ishizuka M. An overview on mycotoxin contamination of foods in Africa. J Vet Med Sci. 2014;76(6):789–97.
Available:http://www.ncbi.nlm.nih.gov/pub med/24572628
15. Kouadio JH, Lattanzio VMT, Ouattara D, Kouakou B, Visconti A. Assessment of mycotoxin exposure in Côte d’ivoire (Ivory Coast) through multi-biomarker analysis and possible correlation with food consumption patterns. Toxicol Int. 2014; 21(3):248–57.
Available:http://www.ncbi.nlm.nih.gov/pub med/25948962
foods and feeds and their in vitro combined toxicological effects. Toxins. 2016;8(4):94. Available:http://www.ncbi.nlm.nih.gov/pub med/27023609
17. Management of left-censored data in dietary exposure assessment of chemical substances. EFSA J. 2010;8(3):1557. Available:http://doi.wiley.com/10.2903/j.efs a.2010.1557
18. Woo C, El-Nezami H. Maternal-fetal cancer risk assessment of ochratoxin a during pregnancy. Toxins. 2016;8(4):87. Available:http://www.ncbi.nlm.nih.gov/pub med/27023600
19. Ribeiro JMM, Cavaglieri LR, Fraga ME, Direito GM, Dalcero AM, Rosa CAR. Influence of water activity, temperature and time on mycotoxins production on barley rootlets. Lett Appl Microbiol. 2006;42(2): 179–84.
Available:http://www.ncbi.nlm.nih.gov/pub med/16441385
20. Kabak B, Dobson ADW, Var I. Strategies to prevent mycotoxin contamination of food and animal feed: A review. Crit Rev Food Sci Nutr. 2006;46(8):593–619.
Available:http://www.tandfonline.com/doi/a bs/10.1080/10408390500436185
21. Yogendrarajah P, Jacxsens L, Lachat C, Walpita CN, Kolsteren P, De Saeger S, De Meulenaer B. Public health risk associated with the co-occurrence of mycotoxins in spices consumed in Sri Lanka. Food Chem Toxicol. 2014;74:240–8.
Available:http://www.ncbi.nlm.nih.gov/pub med/25455891
22. Ding X, Wu L, Li P, Zhang Z, Zhou H, Bai Y, Chen X, Jiang J. Risk assessment on dietary exposure to aflatoxin B1 in post-harvest peanuts in the yangtze river ecological region. Toxins. 2015;7(10): 4157–74.
23. Opinion of the Scientific Committee on a request from EFSA related to A
Harmonised Approach for Risk
Assessment of Substances Which are both
Genotoxic and Carcinogenic. EFSA J. 2005;3(10):282.
Available:http://doi.wiley.com/10.2903/j.efs a.2005.282
24. Shephard GS. Risk assessment of aflatoxins in food in Africa. Food Addit Contam Part A. 2008;25(10):1246–56. Available:http://www.ncbi.nlm.nih.gov/pub med/18608489
25. Saad-Hussein A, Taha MM, Beshir S, Shahy EM, Shaheen W, Elhamshary M. Carcinogenic effects of aflatoxin B1 among wheat handlers. Int J Occup Environ Health. 2014;20(3):215–9.
Available:http://www.ncbi.nlm.nih.gov/pub med/25000109
26. Liu Y, Wu F. Global burden of aflatoxin-induced hepatocellular carcinoma: A risk assessment. Environ Health Perspect. 2010;118(6):818–24.
Available:http://ehp.niehs.nih.gov/0901388 27. Benford D, Leblanc JC, Setzer RW.
Application of the margin of exposure (MoE) approach to substances in food that are genotoxic and carcinogenic. Food Chem Toxicol. 2010;48:S34–41.
Available:http://www.ncbi.nlm.nih.gov/pub med/20113853
28. Cleveland TE, Dowd PF, Desjardins AE, Bhatnagar D, Cotty PJ. United States department of agriculture-agricultural research service research on pre-harvest
prevention of mycotoxins and
mycotoxigenic fungi in US crops. Pest Manag Sci. 2003;59(6–7):629–42.
Available:http://www.ncbi.nlm.nih.gov/pub med/12846313
29. Chen ZY, Brown RL, Damann KE, Cleveland TE. Identification of maize kernel endosperm proteins associated with resistance to aflatoxin contamination by Aspergillus flavus. Phytopathology. 2007;97(9):1094–103.
Available:http://www.ncbi.nlm.nih.gov/pub med/18944174
© 2017 Boli et al.; This is an Open Access article distributed under the terms of the Creative Commons Attribution License
(http://creativecommons.org/licenses/by/4.0), which permits unrestricted use, distribution, and reproduction in any medium,