Research Journal
Volume 9, No. 25, March 2015, pages 27–33
DOI: 10.12913/22998624/1921 Research Article
Received: 2015.02.05 Accepted: 2015.02.14 Published: 2015.03.01
OPTIMIZATION OF PROCESS PARAMETERS FOR ENHANCED MECHANICAL
PROPERTIES OF POLYPROPYLENE TERNARY NANOCOMPOSITES
Oladipupo Olaosebikan Ogunleye1, Taofeeq Olalekan Salawudeen1, Muyibi A. Suleyman2, Yusof Faridah2
1 Department of Chemical Engineering, Faculty of Engineering and Technology, Ladoke Akintola University of
Technology, P.M.B. 4000, Ogbomoso, Nigeria, e-mail: [email protected]
2 Department of Biotechnology Engineering, Kulliyyah of Engineering,International Islamic University
Malaysia, Jalan Gombak, Kuala Lumpur, Malaysia
ABSTRACT
Preparation of Polypropylene ternary nanocomposites (PPTN) was accomplished by blending multiwall carbon nanotube (MWCNT) in polypropylene/clay binary sys
-tem using a melt intercalation method. The effects of MWCNT loadings (A), melting
temperature (B) and mixing speed (C) were investigated and optimized using central
composite design. The analysis of the fitted cubic model clearly indicated that A and B were the main factors influencing the tensile properties at a fixed value of C. However,
the analysis of variance showed that the interactions between the process parameters,
such as; AB, AC, AB2, A2B and ABC, were highly significant on both tensile strength
and Young’s modulus enhancement, while no interaction is significant in all models
considered for elongation. The established optimal conditions gave 0.17%, 165 °C, and 120 rpm for A, B and C, respectively. These conditions yielded a percentage in-crease of 57 and 63% for tensile strength and Young’s modulus respectively compared to the virgin Polypropylene used.
Keywords: MWCNT, PPTN, tensile strength and Young’s modulus.
INTRODUCTION
Polypropylene is an important plastic, which offers probably the best quality among polyolefins at low cost [1, 2]. It has a wider area of applica-tions, such as packaging, home utensils, casings and automobile accessories compared than any other thermoplastic. In addition, polypropylene has a lower density between 900 and 920 kg/m3, in comparison to other engineering materials, al-lowing for potential weight reductions, very good heat resistance and due to its higher crystallinity, it is an excellent moisture barrier and has good optical properties [3, 4].
Polymers in their pure and natural state are either reinforced with organic fillers, such as si -sal, flax, jute and wood fibres [5, 6], or particulate fillers, such as tack, CaCO3 and mica. Such poly-mer composites are credited with better
proper-ties relative to their parent matrix and have found a wide array of applications in the civil construc-tion industries [7, 8]. They are term microcom-posite simply because the fillers are dispersed in micro scale. However, effort in the field of poly -mer microcomposite has reached the highest level of optimization because most times higher filler loading is usually required and consequently af-fect the final material.
[12, 13], and barrier [14, 15] properties of ther-moplastic by addition of organically modified layered silicates to polymer matrices. This has attracted further studies in the field of polymeric composite.
Polypropylene, among thermoplastic has a wider area of industrial applications. It can be modified in many ways and its fibre reinforced grades compete even with most engineering poly-mers. Consequently, many attempts have been made to prepare polypropylene-layered silicate nanocomposite (PP/MNC) in order to have a ma -terial of better properties compared to the con-ventional polymer micro-composite. However, practically all composites prepared from organo-philic clay and polypropylene do not show im-provements in an extent that satisfies the require -ments of most applications in terms of mechani-cal properties because complete dispersion of the silicate is never achieved in the PP matrix [16]. In addition, the achieved properties usually dif-fer from the intended trade-off what affects the quality of the final composite. As a result, effort is ongoing to produce composite that will combine more than one filler in a polymer matrix. Such that there will be shared properties and shortcom-ings from one filler can be addressed by the other called a secondary filler [14, 17]. Carbon nano -tube is suggested in this study as a secondary fill -er due to its special intrinsic prop-erties and high aspect ratio combined with surface area.
Due to the complexity in the behavior of Poly-propylene blend with nanomaterials cum their re-action towards process parameters such as melt-ing temperature, mixmelt-ing speed and filler loadmelt-ings, optimization of the process parameters is rarely reported. The present work is therefore aimed at optimizing these process parameters to enhance the properties of PPTN. Such ternary combina -tion will address the most common shortcomings, such as low mechanical properties and trade-off problems peculiar to the binary precursor (PP/ MNC) and hence possess better properties.
METHODOLOGY
Materials
Multiwall carbon nanotubes with outer diame-ter range between 10 nm and 20 nm, length ~30 µm and 95% purity was manufactured by Zyvex In-strument, Germany and supplied by Cahaya BHD SDN, Malaysia. Bentonite clay manufactured by
Across Organics was modified in the laboratory using octadecylamine salt. Polypropylene homo-polymer with an MFR > 3 g/10 min manufactured by Petronas Malaysia was used as matrix, while maleic anhydride grafted polypropylene (PPgMA oligoma) (Polybond 3200) with 1.2 wt % MA was used as compatibilizer.
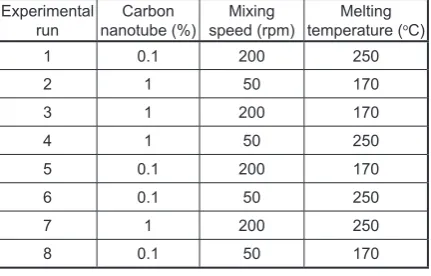
Selection of range of process parameters Range of the selected process parameters was determined by using design expert version 6.0.8, Stat-ease Inc, USA with full factorial, three fac-tors with low and high levels: The selected pa-rameters were varied between 170 and 250 °C for melting temperature, 0.1 to 1% of binary precur-sor for MWCNT loading and 100 to 200 rpm for mixing speed. These were used in the preparation of ternary nanocomposite according to Table 1 below, the final PPTN were tested for their ten -sile properties using ASTM D638, and the results were analyzed.
Table 1. Experimental design for determination of range for process parameters
Experimental
run nanotube (%)Carbon speed (rpm)Mixing temperature (Melting oC)
1 0.1 200 250
2 1 50 170
3 1 200 170
4 1 50 250
5 0.1 200 170
6 0.1 50 250
7 1 200 250
8 0.1 50 170
Preparation of PP-Clay/MWCNTs nanocomposites
Experimental design
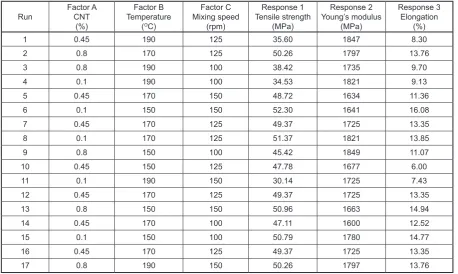
Optimization using central composite design (CCD) of the response surface (RSM) is a suit-able tool for determination of optimum condi-tions when many factors affect a desired response [18]. In this work, seventeen experiments were carried out according to the conditions indicated in Table 2. The response values (tensile strength, Young modulus and elongation) are reported in the last three columns of the table.
RESULTS AND DISCUSSION
Range of process parameters using factorial design
The tensile properties of the selected process parameters based on high and low level of values are shown on Table 3. This consideration shows the effect of low and high value of the selected pa-rameters on the tensile properties and hence gave the required range of values for the optimization purpose. The results were analyzed by grouping the experimental blocks into a pair of similar pa-rameters (for example mixing speed and MWCNT loading) and the third parameter (melting temper-ature) varied. Similarly, melting temperature and MWCNT were fixed and the mixing speed was varied. The analysis of the results showed that the
tensile strength of the composite produced at 250 °C melting temperature was lower than that at 170 °C for a fixed MWCNT loading and mixing speed. The tensile properties at 170 °C were in the range of 30 to 32 MPa, for tensile strength and between 1200 and 1700 MPa for Young’s modulus while at 250 °C, the properties lied between the range of 20 and 25 MPa tensile strength and 1000 and 1300 MPa Young’s modulus respectively. The loss in the tensile properties at higher temperature could be traced to the degeneration in the plastic properties of PP, which resulted in low viscosity, and hence loss of binding effect on the fillers with -in the matrix. This agrees with the Eisten postulate, equation (1) which states that the effect of filler on modulus is proportional to that on viscosity.
η = ηs (1 + 2.5Vr) (1) Where η represents the viscosity of the com-posite, ηs represents the viscosity of the matrix and Vr the filler volume fraction. When the viscos -ity terms in equation (1) is replaced by the modu-lus term E, the equation gives:
E = Es (1 + 2.5Vr) (2)
E and Es represent the modulus for compos-ite and matrix respectively. Therefore, at 250 °C melting temperature, an irreversible drop in vis-cosity of the nanocomposites can be explained in terms of the drop in the stiffness measured as a function of Young’s modulus.
Table 2. Central composite design for PP/Clay/CNT and responses
Run Factor ACNT
(%)
Factor B Temperature
(OC)
Factor C Mixing speed
(rpm)
Response 1 Tensile strength
(MPa)
Response 2 Young’s modulus
(MPa)
Response 3 Elongation
(%)
1 0.45 190 125 35.60 1847 8.30
2 0.8 170 125 50.26 1797 13.76
3 0.8 190 100 38.42 1735 9.70
4 0.1 190 100 34.53 1821 9.13
5 0.45 170 150 48.72 1634 11.36
6 0.1 150 150 52.30 1641 16.08
7 0.45 170 125 49.37 1725 13.35
8 0.1 170 125 51.37 1821 13.85
9 0.8 150 100 45.42 1849 11.07
10 0.45 150 125 47.78 1677 6.00
11 0.1 190 150 30.14 1725 7.43
12 0.45 170 125 49.37 1725 13.35
13 0.8 150 150 50.96 1663 14.94
14 0.45 170 100 47.11 1600 12.52
15 0.1 150 100 50.79 1780 14.77
16 0.45 170 125 49.37 1725 13.35
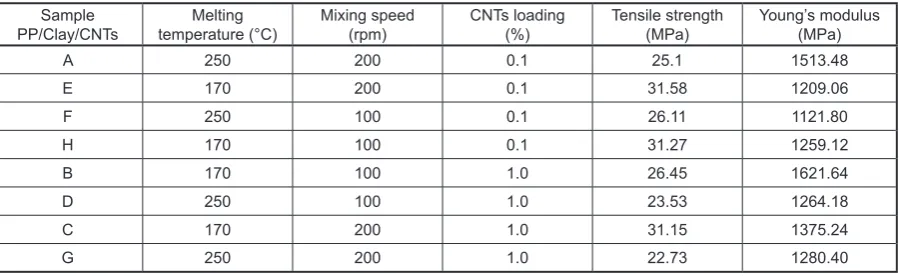
The effect of shear was measured in terms of mixing speed. Therefore, at a fixed melting temperature and percentage MWCNT, the results show that tensile properties increase with shear but the rate of increase was not so significant. For example in the case of composites produced at a fixed temperature of 170 °C and 0.1% CNT loading (EH); the tensile strength was 31.27 MPa and 31.58 MPa at 100 and 200 rpm respectively and 1259.12 & 1209.06 MPa for Young’s modu-lus respectively. The same explanation holds for other combinations such as; BC, AF and DG. It is therefore concluded that melting temperature and CNTs loadings have more significant effect on the preparation of PPTN compared to mixing speed.
Also when the filler loading was varied while the melting temperature and mixing speed kept constant (such as: AG, BH, CE and DE). Considering a pair AG, Table 3 shows that at a fixed melting temperature of 250 °C and mixing speed of 200 rpm, the tensile strengths at 0.1 and 1% MWCNT were 25.1 and 22.73 MPa while the Young’s modulus 1513.48 and 1280.40 MPa respectively. This shows that at 1% MWCNT loading, the tensile properties are affected trace-able to the formation of agglomerates in the polymer matrices. Specifically on the PPTN; in -crease in CNT may saturate the PP/Clay binary precursor due to the existing filler (layered sili -cate) in the matrix, thereby increased the rate of formation of agglomerates and hence reducing the tensile properties. Sometimes, Young’s mod-ulus may be favored by increasing filler loading but usually at the expense of other properties, such situation was observed in BH where the Young’s modulus of the composite sample was 1259.12 MPa at 0.1% CNT and 1621.64 MPa at 1% CNT. Further increase in CNT might lead to a complete loss in both the tensile strength and the Young’s modulus.
Test of significance and accuracy of the model
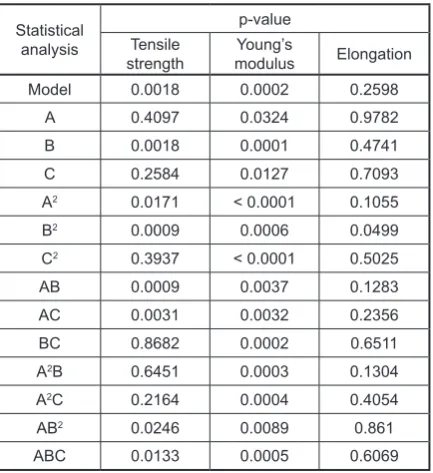
The level of significance and accuracy of the fitted models were tested through the analysis of variance using p-value. As shown in Table 4, it is evident from ANOVA that the third order poly -nomial model for both the tensile strength and Young’s modulus are highly significant with p-val -ue of 0.0018 and 0.0002 respectively knowing ful-ly well that for p-value < 0.05, the model terms are significant and for p-value < 0.01, the model terms are highly significant [19]. However, the model terms for the elongation are not significant due to its high p-value (0.2598). This result is also justi-fied from the experimental data, which showed an inconsistency pattern for the elongation.
Following the above arguments, it is evident from Table 4 that the variables that are highly sig-nificant are B, B2, AB and AC while A2 AB2 and ABC are significant factors in the case of tensile strength where A represents the MWCNTs load -ing (%), B represents the temperature (oC) and C the mixing speed (rpm). In the case of Young’s modulus (Table 6), the highly significant factors are; B, A2, B2, C2, AB, AC, BC, A2B, A2C, AB2 and ABC while only A is significant. From the above analysis both linear and polynomial ef-fects of parameters were significant, meaning that they can act as limiting factor and little variation in their values can alter the properties (Tensile strength and Young’s modulus) of the composite. Considering the third model (Elongation), no sig-nificant factor was recorded either in the linear or polynomial model (Table 4). This implies that the addition of CNT though enhanced other prop -erties, but did not have any significant effect on elongation. It can therefore be inferred from the analysis of results that Table 4 are true a represen-tation of the model and can be used to determine the responses of the composite to changes in the
Table 3. Tensile properties of PPTN for determination of range for process parameters
Sample
PP/Clay/CNTs temperature (°C)Melting Mixing speed(rpm) CNTs loading(%) Tensile strength(MPa) Young’s modulus(MPa)
A 250 200 0.1 25.1 1513.48
E 170 200 0.1 31.58 1209.06
F 250 100 0.1 26.11 1121.80
H 170 100 0.1 31.27 1259.12
B 170 100 1.0 26.45 1621.64
D 250 100 1.0 23.53 1264.18
C 170 200 1.0 31.15 1375.24
process parameters. However, if elongation is of prime importance in the application of nanocom-posite, the plasticizer, mostly phthalate esters, can be added in a predetermined quantity.
To further reaffirm the significance of the fitted model using regression analysis, the coef -ficients of determinations (actual R2 and adjusted R2) were computed and compared. This is because R2 only measures the amount of reduction in the variability obtained by using the regressor vari-ables [20]. However, a large value of R2 does not necessarily imply that the regression model is a good one and as a result, adjusted R2 were com-puted and compared with actual R2 to justify the significance of the model. Table 5 shows that the coefficient of determination R2 and adjusted R2 for both the tensile strength and Young’s modulus are near to 1 which implies that the regression models are highly significant. In comparison with elonga -tion, though R2 of 91% is large enough but when compared with adjusted R2 (52%), there is a wide gap. This also justifies the anomalous behavior of elongation. Adequate precision measures the sig-nal to noise ratio (S/N). A ratio greater than 4 is desirable [19]. Hence adequate precission for both tensile strength and Young modulus (≈ 30 and 60) are large enough for the significancy of the model. However, the adequate precission for elongation of 4.8 is just adequate but less significant or practi -cally insignificant. This also is in agreement with other observation made so far in this research.
Model equations
In order to predict the optimal regions for the production of ternary nanocomposite consider-ing the three responses [tensile strength (T/S), Young’s modulus (Y/M) and elongation (E)] within the experimental constraints: CNT load -ings (A), melting temperature (B) and mixing speed (C). A third order polynomial model was fitted to the experimental results using the Design Expert software and the following models were developed for each of the responses.
Model equations in terms of actual factors: T/S = -627 + 430A + 7.23B + 1.79C + 57.12A2 – 0.02B2– 4.35AB – 2.49AC – 0.01BC – 0.25A2C + 6.72E – 003AB2 + 0.02ABC (3) Y/Mod = 531 + 1776A + 3B + 24C + 8487A2 – 0.06B2 – 0.18C2 – 76.27AB + 8AC + 0.11BC – 36.832B – 12.57 A2C + 0.32AB2 + 0.01ABC (4) Elong = -249 – 122.23A + 3.33B + 0.09C + 179.42A2 – 9.47E – 003B2 + 1.65E – 003C2 + 0.72AB – 0.87AC – 3.01E – 003C – 1.21A2B + 0.40A2C + 1.50E – 004AB2 + 3.895E – 003ABC (5)
Following the model equations above, it can be inferred that equation 3 to 5 are better combi-nations and can be used for the determination of the required process parameters for the produc-tion of PP-ternary nanocomposites of a known tensile properties.
Condition for optimum responses
The relationship between the responses and the experimental variables are illustrated graphi-cally by plotting three-dimensional (3D) response surface graphs (Figures 1 to 3). The y-axis repre-sents any of the responses (T/S, Y/M or E) while
x and z-axes represent any two of the three inde-pendent variables. In this case, x and y are melt-ing temperature and MWCNT percentage respec -tively, while mixing speed was fixed at 125 rpm. In Figure 1 examination of three-dimensional plot showed that the tensile strength is in the optimum Table 4. Summary of statistical analysis using ANOVA
Statistical analysis
p-value Tensile
strength modulusYoung’s Elongation
Model 0.0018 0.0002 0.2598
A 0.4097 0.0324 0.9782
B 0.0018 0.0001 0.4741
C 0.2584 0.0127 0.7093
A2 0.0171 < 0.0001 0.1055
B2 0.0009 0.0006 0.0499
C2 0.3937 < 0.0001 0.5025
AB 0.0009 0.0037 0.1283
AC 0.0031 0.0032 0.2356
BC 0.8682 0.0002 0.6511
A2B 0.6451 0.0003 0.1304
A2C 0.2164 0.0004 0.4054
AB2 0.0246 0.0089 0.861
ABC 0.0133 0.0005 0.6069
p < 0.05 indicate the model terms are significant. p < 0.01 indicate the model terms are highly significant
Table 5. Measure of significance using R2 and
ad-equate precision
Statistical
tool strengthTensile modulusYoung’s Elongation
R-squared 0.9973 0.9994 0.9112
Adj R-squared 0.9857 0.9966 0.5265
region when the temperature lies between 150 and 170 °C and MWCNT loadings is between 0.1 and 0.28%.
However, if the targeted property is Young’s modulus, Figure 2 showed that the optima region also lies between 150 and 170 °C while the CNT loadings lies between 0.28 and 0.63%. Gener-ally, this implies that for the production of PP-ternary nanocomposite with high tensile strength and Young’s modulus as the targeted properties, the favorable temperature is between 150 °C and 170 °C and the MWCNT loading is between 0.1 and 0.6% considering Figure 1 and 2.
Regarding the elongation, no consistent pat-tern could be established statistically for the ef-fect of the process parameters due to low pre-dicted R2, high p-value and low adequate preci-sion however, some general trends which agreed with the predicted optimal regions such as melt-ing temperature of 150 to 170oC and 0.28 to 0.63 MWCNT loading are indicated in the response surface curve as shown in Figure 3.
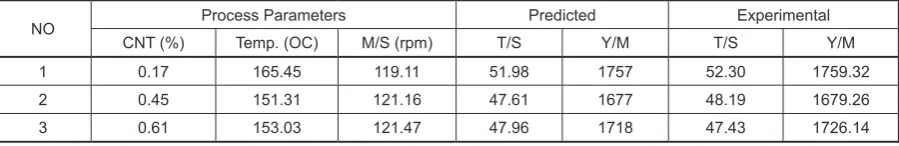
Validation of the model
In order to justify the optimization results ob-tained in Figure 1, 2 and 3, and to determine the exact optimum point a set of supplementary ex-periments were carried out based on the suggest-ed optima conditions. The results are as shown in Table 6.
The highest tensile properties were obtained at optimum conditions, which are when the MW-CNT content was 0.17%, melting temperature of 165.45 °C and mixing speed of 119.11 rpm. This is also justified from the surface response plots (Figures 1 and 2) where the optimum region lies between 0.1 and 0.28% MWCNT for the tensile strength and between 0.28 and 0.63% MWCNT for the Young’s modulus. The optimum tempera-ture lies generally between 150 and 170 °C.
CONCLUSIONS
In this study, ternary nanocomposites of Poly-propylene, which comprises of modified nano -clay and multiwall carbon nanotubes have been prepared, characterized and the operating eters optimized. The three key process param-eters considered are MWCNT loadings, melting temperature and the mixing speed and the major responses were tensile strength, Young’s modu-lus and elongation. This study clearly developed Fig. 1. Response surface plots showing the effect of
temperature and MWCNT loadings on the tensile strength of PPTN
Fig. 2. Response surface plots showing the effect of
temperature and MWCNT loadings on the Young’s modulus of PPTN
Fig. 3. Response surface plots showing the effect of
three statistical models that can be used to predict the operating parameters once the tensile prop-erties are fixed for the production of PP-ternary nanocomposite. Hence, novel plastic materials of specific properties can be developed for various industrial applications.
REFERENCES
1. Mittal V. Polypropylene–layered silicate nanocom-posites: Filler matrix interactions and mechanical properties. Journal of Thermoplastic Composite Materials, 20, 2007, 575–599.
2. Nello P. Polypropylene handbook. Second edition,
Hanser Publishers, Munich, Hanser Gadner Publi-cations, Cincinnati 2005, 326–334,
3. Karian H.G. Handbook of polypropylene and
poly-propylene composites. Marcel Dekker, NY. 2003,
155–158.
4. Valentini L., Biagiott I.K., Kenny J.M. Lopez M., Manchando M.A. Physical and mechanical behav-iour of single wall carbon nanotube/polypropyl-ene/ethylene-polypropylene-diene rubber nano-composite. Journal of Applied Polymer Science, 89(10), 2003, 2657–2663.
5. Hu N., Masuda Z., Yamamoto G., Fukunaga H.,
Hashida T., Qin J. Effect of fabrication process on electrical properties of polymer/ multi-wall car-bon nanotube nanocomposites composites. Part A. Applied Science and Manufacturing, 39(5), 2008, 893–903.
6. Xun X., Krishnan J., Caroline M.,, Nicholas S. Life Cycle assessment of wood-fibre reinforced poly -propylene composite. Journal of Material Process-ing Technology, 198, 2008, 168–177.
7. Ma J., Qi Z., Hu Y. Synthesis and characterization of polypropylene-clay nanocomposites. Journal of Applied Polymer Science, 82, 2001, 3611–3617. 8. Thostenson E.J., Ren Z., Chou T.W. Advances in
science and technology of carbon nanotubes and their composites. A review. Composite Science and Technology, 61, 2001, 1899–1912.
Table 6. Validation of the developed model
NO Process Parameters Predicted Experimental
CNT (%) Temp. (OC) M/S (rpm) T/S Y/M T/S Y/M
1 0.17 165.45 119.11 51.98 1757 52.30 1759.32
2 0.45 151.31 121.16 47.61 1677 48.19 1679.26
3 0.61 153.03 121.47 47.96 1718 47.43 1726.14
9. Bafna A., Beaucage G., Mirabella F., Mehta S. 3D hierarchical orientation in polymer-clay
nanocom-posite film. Polymer, 44(4), 2003, 1103–1115.
10. Fornes T.D., Yoon P.J., Keskkula H., Paul D.R.
Nylon 6 nanocomposites: The effect of matrix mo -lecular weight. Polymer, 42(25), 2001, 9929–9940. 11. Oya A., Kurokawa Y., Yasuda H. Factors control-ling mechanical properties of clay mineral/ poly-propylene nanocomposites. Journal of Material Science, 35(5), 2000, 1045–1050.
12. Gilman J.W. Flammability and thermal stability studies of polymer layered-silicate (clay) nano-composites. Applied Clay Science 15, 1999, 31–49. 13. Isam Y.Q. The potential of carbon nanotubes
pro-duction as a filler element in polymer nanocompos -ite: A review article. Minia Journal of Engineering and Technology, 30(1), 2011, 1–21.
14. Chen T.K., Tien Y.I., Wei K.H. Synthesis and char-acterization of novel segmented polyurethane/clay nanocomposite. Polymer, 41(4), 2000, 1345–1353. 15. Sudip R., Siew Y.Q., Allan E., Xiao D.C. The
po-tential use of polymer-clay nanocomposites in food packaging. International Journal of Food Engineer-ing 2(4), 2006, 4–13.
16. Laszlo S., Agnes A., Pukanszky B.Jr., Julius G.V., Punkaszky B. Morphological characterization of PP/Clay nanocomposites across the length scales of the structural architecture. Micromolecular Ma-terials and Engineering, 291(7), 2006, 858–868. 17. Salawudeen T.O., Suleyman A.M., Qasim H.S.,
Ma’an F.A., Faridah Y., Isam Y.Q. Improving the polypropylene-clay composite using carbon
nano-tube as secondary filler. Energy Research Journal 1
(2), 2010, 68–72.
18. Manel M, Souhail B., Moncef C., Christelle R., Michel P., Christophe B., Hamadi A. Optimization of pecting extraction from lemon by-product with
acidified date juice using response surface method -ology. Carbohydrate Polymers, 74, 2008, 185–192. 19. Stat-Ease, Design Expert, Version 6.0.8. Available
on wwwstatease.com(2002).
20. Douglas C.M. Design and analysis of experiments.