R E S E A R C H
Open Access
Changes in triggering of ST-elevation
myocardial infarction by particulate air
pollution in Monroe County, New York over
time: a case-crossover study
Meng Wang
1, Philip K. Hopke
1,2, Mauro Masiol
1,2, Sally W. Thurston
3, Scott Cameron
4, Frederick Ling
4,
Edwin van Wijngaarden
1,5, Daniel Croft
4, Stefania Squizzato
1,2, Kelly Thevenet-Morrison
1, David Chalupa
5and
David Q. Rich
1,4,5,6*Abstract
Background:Previous studies have reported that fine particle (PM2.5) concentrations triggered ST elevation myocardial infarctions (STEMI). In Rochester, NY, multiple air quality policies and economic changes/influences from 2008 to 2013 led to decreased concentrations of PM2.5and its major constituents (SO42−, NO3−, elemental and primary organic carbon). This study examined whether the rate of STEMI associated with increased ambient gaseous and PM component concentrations was different AFTER these air quality policies and economic changes (2014–2016), compared to DURING (2008–2013) and BEFORE these polices and changes (2005–2007).
Methods:Using 921 STEMIs treated at the University of Rochester Medical Center (2005–2016) and a case-crossover design, we examined whether the rate of STEMI associated with increased PM2.5, ultrafine particles (UFP, < 100 nm), accumulation mode particles (AMP, 100-500 nm), black carbon, SO2, CO, and O3concentrations in the previous 1–72 h was modified by the time period related to these pollutant source changes (BEFORE, DURING, AFTER).
Results:Each interquartile range (3702 particles/cm3) increase in UFP concentration in the previous 1 h was associated with a 12% (95% CI = 3%, 22%) increase in the rate of STEMI. The effect size was larger in the AFTER period (26%) than the DURING (5%) or BEFORE periods (9%). There were similar patterns for black carbon and SO2.
Conclusions:An increased rate of STEMI associated with UFP and other pollutant concentrations was higher in the AFTER period compared to the BEFORE and DURING periods. This may be due to changes in PM composition (e.g. higher secondary organic carbon and particle bound reactive oxygen species) following these air quality policies and economic changes.
Keywords:Particulate matter, Ultrafine particles, ST elevation myocardial infarction, Air quality, Effect modification, Case-crossover
Introduction
Over the past decade, policy initiatives to improve air quality have been implemented nationwide and in New York State [1]. These measures included the lowering of the sulfur content of diesel and home heating fuels, use of
particle regenerative traps, and nitrogen oxide controls on new heavy-duty diesel vehicles. Additionally, several ac-tions to reduce sulfur dioxide (SO2) and nitrogen oxide (NOx) emissions from power plants in upwind source areas have also been enacted (i.e. Cross-State Air Pollution Rule). Furthermore, economic changes have also led to changes in emissions [1,2]. The economic drivers include the recession of 2008 that resulted in generally decreased economic activity and thus lower emissions, and a dra-matic decline in the price of natural gas that displaced coal as a fuel for electricity generation.
© The Author(s). 2019Open AccessThis article is distributed under the terms of the Creative Commons Attribution 4.0 International License (http://creativecommons.org/licenses/by/4.0/), which permits unrestricted use, distribution, and reproduction in any medium, provided you give appropriate credit to the original author(s) and the source, provide a link to the Creative Commons license, and indicate if changes were made. The Creative Commons Public Domain Dedication waiver (http://creativecommons.org/publicdomain/zero/1.0/) applies to the data made available in this article, unless otherwise stated.
* Correspondence:[email protected]
1
Department of Public Health Sciences, University of Rochester Medical Center, Rochester, NY, USA
4Department of Medicine, University of Rochester Medical Center, Rochester, NY, USA
These policy initiatives and economic drivers resulted in changes in the concentrations and composition of air pollut-ants measured in Rochester, NY [1–3]. Long-term trend ana-lyses from 2001/2002 to 2015/2016 in Rochester showed decreases in concentrations of particulate matter with aero-dynamic diameter < 2.5μm (PM2.5), accumulation mode parti-cles (AMP, 100–500 nm), ultrafine partiparti-cles (UFP,≤100 nm), black carbon (BC), SO2, and carbon monoxide (CO), while the concentration of ozone (O3) showed a slight upward trend [4]. The reduction in PM2.5concentrations was largely attrib-uted to substantial decreases in sulfate and nitrate (−65% and
−37%, respectively, from 2001 to 2015) [1], which are second-ary PM species formed from the oxidation of precursor gases SO2and NOx. These pollutants have been previously associ-ated with adverse cardiovascular outcomes [5–10].
Short-term increases in PM2.5concentrations in the previ-ous hours and days have been repeatedly associated with the triggering of myocardial infarction [8,11–17], including prior Rochester studies reporting triggering of ST segment elevation myocardial infarction (STEMI) by short-term increases in am-bient PM2.5concentrations in the previous hour [11,12]. Fur-thermore, Rich et al. reported a higher rate of MI associated with increased PM2.5concentrations when the PM2.5mixtures had high mass fractions of secondary PM species (sulfate, ni-trate, and/or organics), compared to when the mixtures had low mass fractions of secondary PM species [18]. This result suggests that PM2.5high in secondary species, formed through active, oxidative atmospheric photochemistry, may be more likely to trigger myocardial infarctions than primary fine parti-cles [18]. Given these findings, reduced concentrations of sec-ondary PM species sulfate and nitrate following the policy initiatives described above may result in a lower rate of STEMI per unit mass of PM, compared to periods when PM contained a higher proportion of secondary PM.
Using data on patients with a STEMI treated at the Univer-sity of Rochester Medical Center (URMC) and air pollutant concentrations measured in Rochester, we examined whether the rate of STEMI associated with increased PM (PM2.5, UFP, and AMP) concentrations in the previous few hours and days was modified by periods defined based on the time of pollu-tant source changes following these environmental policies. We hypothesized that increases in the rate of STEMI associ-ated with the same incremental increase in PM concentrations would be smaller AFTER these pollutant changes occurred (2014–2016), compared to BEFORE (2005–2007), and DUR-ING this period (2008–2013). We also explored effect modifi-cations by periods (BEFORE, DURING, and AFTER) of the rate of STEMI associated with concentrations of BC and gas-eous pollutants SO2, O3, and CO.
Methods
Study population
We included all patients treated at the Cardiac Catheterization Laboratory (Cath Lab) at URMC in
Rochester, NY for STEMI between January 1, 2005 and December 31, 2016, who resided within 15 miles of the pollution monitoring station in Rochester. If a patient experienced multiple STEMIs during the study period, we only included STEMI that occurred at least 72 h after a previous STEMI, resulting in 921 STEMI events in 912 patients available for analyses. Patients’ demographic and clinical characteristics were also obtained. This study was approved by the University of Rochester Med-ical Center Research Subjects Review Board. Informed consent was not required since data were past events and the research could not affect treatment, there was no contact with study subjects, and all results are pre-sented in aggregate only.
Outcome assessments
American College of Cardiology (ACC)/American Heart As-sociation (AHA) guidelines were used at the time of Cath Lab admission to diagnose STEMI [19]. Specifically, STEMI was defined as ST segment elevation on the presenting elec-trocardiogram (ECG) of > 1 mm in≥2 contiguous precordial leads, or in≥2 adjacent limb leads, or new or presumed new left bundle branch block in the presence of angina or angina equivalent. ECG criteria are both necessary and sufficient for the diagnosis of STEMI in a patient deemed by the treating physician to have symptoms consistent with cardiac chest pain. Symptom onset time (date and hour) was self-reported by each patient (or kin if the patient was unable to commu-nicate) upon arrival to the URMC Cath Lab.
Air pollution and meteorology measurements
not included in our study. Temperature and relative humid-ity data measured at the Rochester International Airport were obtained from the National Climate Data Center. Hourly means of each pollutant and weather variables were used in all statistical analyses described below.
Study design
We used a time-stratified case-crossover design to estimate the rate of STEMI associated with air pollutant concentra-tions [25,26]. This design contrasts pollutant concentrations immediately before the acute STEMI (case-period) to other time periods when the patient did not have an acute STEMI (control period). Case periods of this study were defined as the 1, 3, 12, 24, 48, and 72-h periods prior to the time of STEMI symptom onset, with control periods (3–4 per case, depending on the number of days in calendar month) matched by calendar year, month, weekday, and hour of the day. Since these case and control periods were separated by 1 week, there was no overlap in the air pollutant concentra-tions included in the case and control periods. Further, since the case and control periods were from the same patient, time-invariant confounders such as age, gender, and chronic comorbidities were controlled by design. Factors that varied between the case and control periods (e.g., temperature and relative humidity) were potential confounders included in our models.
Statistical analysis
First, we computed the average concentrations of each pollu-tant (PM2.5, AMP, UFP, UFP 11-50 nm, UFP 50-100 nm, BC, SO2, O3, and CO) in the 1 (lag hour 0), 3 (lag hours 0– 2), 12 (lag hours 0–11), 24 (lag hours 0–23), 48 (lag hours 0–47), and 72 (lag hours 0–71) hours prior to each symptom onset (i.e. case) time and its matched control time. If the time of symptom onset of a STEMI event was estimated to be in the first 29 min of the hour (e.g. 12:28), then lag hour 0 was defined as the previous hour (i.e. 11:00–11:59). If the STEMI symptom onset time was estimated to be in the 30th minute or after (e.g. 12:49), then lag hour 0 was defined as that same hour (i.e. 12:00–12:59). We then regressed the case-control status (i.e., case = 1, control = 0) against the mean PM2.5concentration at lag hour 0 of the case and con-trol periods, using conditional logistic regression models stratified by each case-control set, adjusting for mean temperature and relative humidity during the same lag hours. We used Akaike’s information criterion to select the optimal functional form (natural spline with 2, 3, 4, or 5 de-grees of freedom versus 1 degree of freedom/linear) for these two covariates. One degree of freedom (linear) was selected for both variables and used in the model. We also estimated the rate of STEMI associated with each interquartile (IQR) increase in the average PM2.5 concentration at longer lag hours (lag hours 0–2, 0–11, 0–23, 0–47, and 0–71) in separ-ate models in the same manner. We then repesepar-ated these
analyses for the other pollutants (AMP, UFP, UFP 11-50 nm, UFP 50-100 nm, BC, SO2, O3, CO). Three sensitivity analyses were performed. First, we examined whether the exposure-response functions (i.e. relative rates in the model described above) were linear or non-linear, by comparing AIC from the model described above, to models where the rate of STEMI associated with increased pollutant concentration was modeled using a natural spline with 2, 3, 4, or 5 degrees of freedom. Second, we examined whether the pollutant/ STEMI association changed after further adjustment for holi-day in the model. Third, we examined whether the pollu-tant/STEMI association was modified by age (< 65 vs. ≥65 years), sex (male vs. female), and history of smoking, dia-betes, dyslipidemia, and heart failure (yes vs. no) in separate models by adding an interaction term (e.g. UFP *male) to the model described above. The IQRs used to scale effect esti-mates were the IQRs of the pollutant specific lag times, from the control periods during the entire study years (2005– 2016). Since the correlation among data resulting from mul-tiple STEMI events contributed by the same patient is likely negligible (921 events contributed by 912 patients), we did not account for within-subject correlation in our analyses.
To examine whether the rate of STEMI associated with increased PM2.5concentration in the previous hour (lag hour 0) was modified by the period of pollutant source changes (BEFORE [2005–2007], DURING [2008– 2013], and AFTER [2014–2016]), we added two inter-action terms of‘period’(a categorical variable with three levels) and PM2.5concentration to the model of main ef-fect analysis described above. We then repeated this ana-lysis for other lag hours (lag hours 0–2, 0–11, 0–23, 0–47, and 0–71) and the other pollutants (AMP, UFP, UFP 11-50 nm, UFP 50-100 nm, BC, SO2, O3, CO). To account for the unbalanced distribution of patients’age across the three pe-riods, in sensitivity analysis, we added an interaction term be-tween pollutant concentration and age (< 65 years vs. ≥65 years) to the model of effect modification by period de-scribed above. We then repeated this analysis for all patient characteristics with unbalanced distributions across the three periods (sex, smoking, diabetes, dyslipidemia, heart failure). Analyses were performed using SAS (version 9.4; SAS insti-tute Inc., Cary, NC) and R (version 3.0.1, R foundation for statistical computing, Vienna, Austria, splines package). A p< 0.05 was used to define statistical significance.
Results
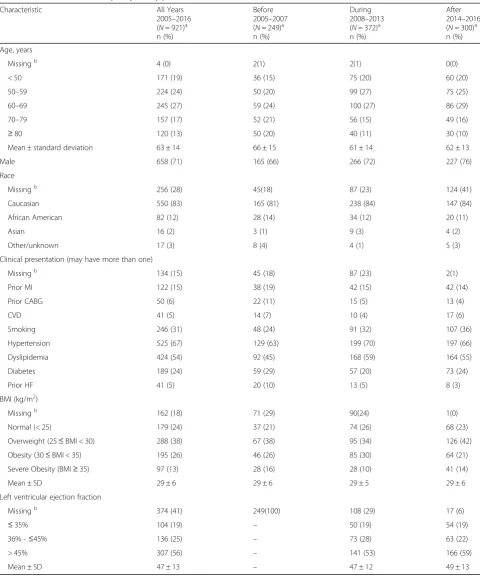
Table 1Characteristics of study subjects, by period
Characteristic All Years
2005–2016 (N= 921)a n (%)
Before 2005–2007 (N= 249)a n (%)
During 2008–2013 (N= 372)a n (%)
After 2014–2016 (N= 300)a n (%)
Age, years
Missingb 4 (0) 2(1) 2(1) 0(0)
< 50 171 (19) 36 (15) 75 (20) 60 (20)
50–59 224 (24) 50 (20) 99 (27) 75 (25)
60–69 245 (27) 59 (24) 100 (27) 86 (29)
70–79 157 (17) 52 (21) 56 (15) 49 (16)
≥80 120 (13) 50 (20) 40 (11) 30 (10)
Mean ± standard deviation 63 ± 14 66 ± 15 61 ± 14 62 ± 13
Male 658 (71) 165 (66) 266 (72) 227 (76)
Race
Missingb 256 (28) 45(18) 87 (23) 124 (41)
Caucasian 550 (83) 165 (81) 238 (84) 147 (84)
African American 82 (12) 28 (14) 34 (12) 20 (11)
Asian 16 (2) 3 (1) 9 (3) 4 (2)
Other/unknown 17 (3) 8 (4) 4 (1) 5 (3)
Clinical presentation (may have more than one)
Missingb 134 (15) 45 (18) 87 (23) 2(1)
Prior MI 122 (15) 38 (19) 42 (15) 42 (14)
Prior CABG 50 (6) 22 (11) 15 (5) 13 (4)
CVD 41 (5) 14 (7) 10 (4) 17 (6)
Smoking 246 (31) 48 (24) 91 (32) 107 (36)
Hypertension 525 (67) 129 (63) 199 (70) 197 (66)
Dyslipidemia 424 (54) 92 (45) 168 (59) 164 (55)
Diabetes 189 (24) 59 (29) 57 (20) 73 (24)
Prior HF 41 (5) 20 (10) 13 (5) 8 (3)
BMI (kg/m2)
Missingb 162 (18) 71 (29) 90(24) 1(0)
Normal (< 25) 179 (24) 37 (21) 74 (26) 68 (23)
Overweight (25≤BMI < 30) 288 (38) 67 (38) 95 (34) 126 (42)
Obesity (30≤BMI < 35) 195 (26) 46 (26) 85 (30) 64 (21)
Severe Obesity (BMI≥35) 97 (13) 28 (16) 28 (10) 41 (14)
Mean ± SD 29 ± 6 29 ± 6 29 ± 5 29 ± 6
Left ventricular ejection fraction
Missingb 374 (41) 249(100) 108 (29) 17 (6)
≤35% 104 (19) – 50 (19) 54 (19)
36% -≤45% 136 (25) – 73 (28) 63 (22)
> 45% 307 (56) – 141 (53) 166 (59)
Mean ± SD 47 ± 13 – 47 ± 12 49 ± 13
Data are N (%) or Mean ± SD. For any given characteristic, the denominator of percentage is all STEMIs with available data on that characteristic a
Ns are the number of STEMIs. There were a total of 921 STEMIs among 912 patients b
heart failure was higher in patients in the BEFORE period, than other periods. However, the prevalence of dyslipidemia was lower in patients in the BEFORE period (Table1).
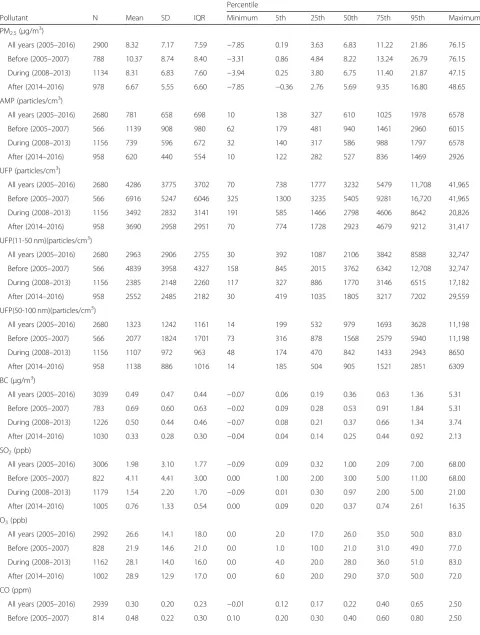
There were substantial decreases in the concentrations of almost all pollutants during the study period except for O3 (Table2). From the BEFORE to the AFTER period, the me-dian concentration of PM2.5decreased by ~ 30%, AMP by ~ 40%, UFP by ~ 45%, BC and CO by ~ 50%, and SO2by ~ 90%. However, the median O3concentration increased by ~ 30% from the BEFORE period to the DURING and AFTER periods. Further description of these changes in Rochester and across New York State has been provided previously [1– 3]. Pearson correlations between hourly pollutants concen-trations are shown in Additional file1: Table S1. PM2.5was moderately correlated with AMP (r = 0.62–0.69), but poorly correlated with UFP (r = 0.12–0.22) in all years. AMP was moderately correlated with UFP in the BEFORE (r = 0.53) and DURING (r = 0.57) period, but the correlation was weaker in the AFTER period (r= 0.29).
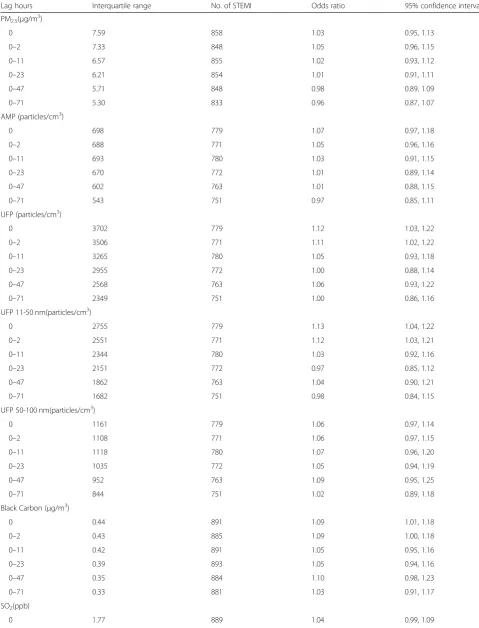
Over all periods, estimates of the relative rate of STEMI associated with increased PM2.5 and AMP con-centrations were all close to 1.0 and not statistically sig-nificant (Table 3). However, increased rates of STEMI were associated with increased UFP and UFP 11-50 nm concentrations in the previous 1 (lag hour 0) and 3 h (lag hours 0–2). IQR increases in UFP concentrations in the previous 1 and 3 h were associated with 12% (95%CI: 3%, 22%) and 11% (95%CI: 2%, 22%) increases in the rate of STEMI, respectively. Similar to UFP, IQR increases in the particle number concentrations of UFP 11-50 nm (nucle-ation mode and spark ignition vehicle emissions [20–22]) at lag hour 0 and lag hours 0–2 were associated with 13% (95%CI: 4%, 22%) and 12% (95%CI: 3%, 21%) increases in the rate of STEMI, respectively. However, increases in UFP 50-100 nm (diesel vehicle emissions and residential wood burning; Aitken mode [20–22]) concentrations were not significantly associated with increases in the rate of STEMI, with effect estimates for all lag hours slightly greater than 1.0.
IQR increases in BC concentrations (lag hour 0: 9%, 95%CI: 1%, 18%; lag hours 0–2: 9%, 95%CI: 0%, 18%) and CO concentrations (lag hour 0: 15%, 95%CI: 2%, 29%; lag hours 0–2: 13%, 95%CI: 0%, 28%) had similar patterns as UFP. Increased SO2concentrations were associated with in-creased rates of STEMI in the previous 3 to 72 h, with statis-tically significant increases in the previous 3 to 24 h. Relative rates ranged from 1.14 to 1.18 in the previous 12 to 72 h. The rates of STEMI associated with each IQR increase in O3 concentrations in the previous 1 to 72 h were all less than 1.0 (OR = 0.87–0.92), but none were statistically significant. These results were essentially the same after additional ad-justment for holiday (Additional file1: Table S2). The rate of STEMI associated with increased UFP concentrations in the
previous hour was not substantially different by age, sex, smoking, diabetes, dyslipidemia, and heart failure (Additional file 1: Table S3), although the relative rate was larger in males than females (1.16, 95%CI: 1.05–1.29 in males vs. 1.04, 95%CI: 0.89–1.21 in females). Further, there was no evi-dence of a non-linear UFP concentration-response func-tion, as the rate of STEMI associated with increased UFP in the previous hour (linear function, 1 df) had the lowest AIC (2168.9) compared to models using a natural spline with 2 df (AIC = 2170.7), 3 df (2171.9), 4 df (AIC = 2173.7), or 5 df (AIC = 2174.9).
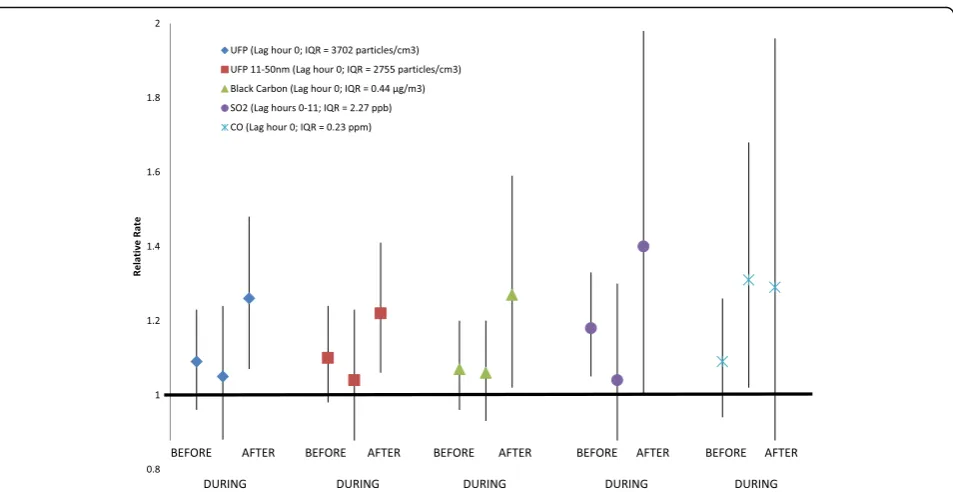
Increases in the rate of STEMI associated with in-creased concentrations of UFP, UFP 11-50 nm, BC, and SO2were larger in the AFTER period compared to those in the BEFORE and DURING periods (Fig. 1; Table 4). In the previous hour (lag hour with the largest UFP rela-tive rate in Table 3), each IQR (3702 particles/cm3) in-crease in UFP concentration was associated with 9% (95%CI: −4%, 23%), 5% (95%CI: −12%, 24%), and 26% (95%CI: 7%, 48%) increases in the rate of STEMI, in the BEFORE, DURING, and AFTER periods, respectively. This pattern remained even when separately including interaction terms between air pollution and age, sex, smoking, diabetes, dyslipidemia, and heart failure in the model (Additional file 1: Table S4). There were similar patterns for UFP in the previous 3 h, UFP 11-50 nm in the previous hour and previous 3 h, BC in the previous hour, and SO2 in the previous 1 to 24 h. However, the pattern for CO relative rates was different. Each IQR (0.23 ppm) increase in CO concentration at lag hour 0 was associated with 9% (−6 to 26%), 31% (2 to 68%), and 29% (−15 to 96%) increases in the rate of STEMI, in the BEFORE, DURING, and AFTER periods, respect-ively, showing similarly larger relative rates in the DUR-ING and AFTER periods. We did not observe a pattern of effect modification by period for the associations be-tween STEMI and PM2.5, UFP 50-100 nm, AMP, or O3.
Discussion
In Rochester, NY from 2005 to 2016, increased rates of STEMI were associated with increased concentrations of UFP, UFP 11-50 nm, BC, and CO in the previous 1 to 3 h, as well as increased SO2concentration in the previous 3 to 72 h. Further, we found larger rates of STEMI associated with UFP, UFP11-50 nm, BC, and SO2in the period after air qual-ity policy implementation and economic changes (AFTER period: 2014–2016) compared to the periods BEFORE (2005–2007) or DURING (2008–2013) these changes. Given concomitant changes in pollutant composition over the three periods, this difference in relative rate by period may reflect differential triggering of STEMI by specific PM constituents.
Table 2Distribution of hourly pollutant concentrations and weather characteristics (lag hour 0 of control periods) by period
Percentile
Pollutant N Mean SD IQR Minimum 5th 25th 50th 75th 95th Maximum
PM2.5(μg/m3)
All years (2005–2016) 2900 8.32 7.17 7.59 −7.85 0.19 3.63 6.83 11.22 21.86 76.15 Before (2005–2007) 788 10.37 8.74 8.40 −3.31 0.86 4.84 8.22 13.24 26.79 76.15 During (2008–2013) 1134 8.31 6.83 7.60 −3.94 0.25 3.80 6.75 11.40 21.87 47.15 After (2014–2016) 978 6.67 5.55 6.60 −7.85 −0.36 2.76 5.69 9.35 16.80 48.65 AMP (particles/cm3)
All years (2005–2016) 2680 781 658 698 10 138 327 610 1025 1978 6578
Before (2005–2007) 566 1139 908 980 62 179 481 940 1461 2960 6015
During (2008–2013) 1156 739 596 672 32 140 317 586 988 1797 6578
After (2014–2016) 958 620 440 554 10 122 282 527 836 1469 2926
UFP (particles/cm3)
All years (2005–2016) 2680 4286 3775 3702 70 738 1777 3232 5479 11,708 41,965 Before (2005–2007) 566 6916 5247 6046 325 1300 3235 5405 9281 16,720 41,965 During (2008–2013) 1156 3492 2832 3141 191 585 1466 2798 4606 8642 20,826
After (2014–2016) 958 3690 2958 2951 70 774 1728 2923 4679 9212 31,417
UFP(11-50 nm)(particles/cm3)
All years (2005–2016) 2680 2963 2906 2755 30 392 1087 2106 3842 8588 32,747 Before (2005–2007) 566 4839 3958 4327 158 845 2015 3762 6342 12,708 32,747
During (2008–2013) 1156 2385 2148 2260 117 327 886 1770 3146 6515 17,182
After (2014–2016) 958 2552 2485 2182 30 419 1035 1805 3217 7202 29,559
UFP(50-100 nm)(particles/cm3)
All years (2005–2016) 2680 1323 1242 1161 14 199 532 979 1693 3628 11,198
Before (2005–2007) 566 2077 1824 1701 73 316 878 1568 2579 5940 11,198
During (2008–2013) 1156 1107 972 963 48 174 470 842 1433 2943 8650
After (2014–2016) 958 1138 886 1016 14 185 504 905 1521 2851 6309
BC (μg/m3)
All years (2005–2016) 3039 0.49 0.47 0.44 −0.07 0.06 0.19 0.36 0.63 1.36 5.31 Before (2005–2007) 783 0.69 0.60 0.63 −0.02 0.09 0.28 0.53 0.91 1.84 5.31 During (2008–2013) 1226 0.50 0.44 0.46 −0.07 0.08 0.21 0.37 0.66 1.34 3.74 After (2014–2016) 1030 0.33 0.28 0.30 −0.04 0.04 0.14 0.25 0.44 0.92 2.13 SO2(ppb)
All years (2005–2016) 3006 1.98 3.10 1.77 −0.09 0.09 0.32 1.00 2.09 7.00 68.00 Before (2005–2007) 822 4.11 4.41 3.00 0.00 1.00 2.00 3.00 5.00 11.00 68.00 During (2008–2013) 1179 1.54 2.20 1.70 −0.09 0.01 0.30 0.97 2.00 5.00 21.00 After (2014–2016) 1005 0.76 1.33 0.54 0.00 0.09 0.20 0.37 0.74 2.61 16.35 O3(ppb)
All years (2005–2016) 2992 26.6 14.1 18.0 0.0 2.0 17.0 26.0 35.0 50.0 83.0
Before (2005–2007) 828 21.9 14.6 21.0 0.0 1.0 10.0 21.0 31.0 49.0 77.0
During (2008–2013) 1162 28.1 14.0 16.0 0.0 4.0 20.0 28.0 36.0 51.0 83.0
After (2014–2016) 1002 28.9 12.9 17.0 0.0 6.0 20.0 29.0 37.0 50.0 72.0
CO (ppm)
hour using STEMI from 2007 to 2012 and subjects living in Monroe County, NY [11], and Gardner et al. reported a 18% increased rate associated with each 7.1μg/m3 in-crease in PM2.5in the previous hour using STEMI from 2007 to 2010 and subjects living within 15 miles of the Rochester monitoring station [12]. When using data from 2005 to 2016, but the same analysis methods for subjects living within 15 miles of the monitoring station, we found only a 3% (−5 to 12%) increased rate of STEMI associated with each 7.1μg/m3 increase in PM2.5 in the previous hour. Differences in PM composition between the study periods and differences in study populations may explain, in part, this discrepancy. Most, but not all other case-crossover studies also reported increased risks/odds/rates of STEMI associated with short-term increases in PM2.5 concentrations [13–17,27]. However, most of these stud-ies did not have symptom onset time and thus were not able to examine triggering of MI by increased pollutant concentrations in the previous few hours, perhaps missing an etiologically important time window. Most of these studies observed the largest increased rate of STEMI asso-ciated with pollutant concentrations in the concurrent or previous day, with excess relative rate estimates (associ-ated with each 10μg/m3increase in PM2.5concentration) ranging from 5 to 15% [13,14,16,17].
In contrast with the lack of findings for PM2.5, we found a 12% increase in the rate of STEMI associated with each 3702 particles/cm3increase in UFP concentration in the previous hour. Analyses of different UFP size fractions (11-50 nm and 50-100 nm) suggested that this observed increase in STEMI rate associated with UFPs was primar-ily driven by UFP 11-50 nm, which are mostly gasoline emissions and nucleation mode particles [20, 22]. UFPs
comprise a large particle number concentration, but con-tribute little mass to PM2.5[28,29]. In the present study, PM2.5mass concentration and UFP particle number con-centration were poorly correlated (r= 0.21). Both UFPs and PM2.5have been associated with adverse cardiovascu-lar responses including systematic inflammation, oxidative stress, endothelial dysfunction, thrombosis and coagula-tion, and autonomic dysfunction [7,10,30,31]. However, compared to larger particle fractions (e.g. AMP), UFPs de-posit more deeply into the lung and may even escape clearance mechanisms and translocate into the circulatory system [32,33]. Therefore, UFPs may exert adverse health effects via pathophysiological pathways different from PM2.5and AMP [30].
Consistent with a meta-analysis of air pollutants and MI by Mustafic et al. [8], we observed increased rates of STEMI associated with increased CO and SO2concentrations, but not O3. Our findings of an increased rate of STEMI associ-ated with increased concentrations of BC in the previous hour (Excess Rate = 9%, 95% CI: 1%, 18%; per 0.44μg/m3) and previous 3 h (Excess Rate = 9%, 95% CI: 0%, 18%; per 0.43μg/m3) are generally consistent with a study by Zano-betti and Schwartz that reported an 8.3% (95% CI: 0.2%, 15.8%) increase in the risk of hospitalization for MI associ-ated with each 1.7μg/m3increase in BC concentrations in the previous 2 days in Boston, MA from 1995 to 1999 [34].
An interesting finding of our study is the pattern of lar-ger rates of STEMI associated with increased concentra-tions of UFP, UFP 11-50 nm, BC, and SO2in the period AFTER pollutant source and economic changes compared to the periods BEFORE or DURING these changes, which is contradictory to our a priori hypothesis. However, this is consistent with our other work conducted in New York Table 2Distribution of hourly pollutant concentrations and weather characteristics (lag hour 0 of control periods) by period
(Continued)
Percentile
Pollutant N Mean SD IQR Minimum 5th 25th 50th 75th 95th Maximum
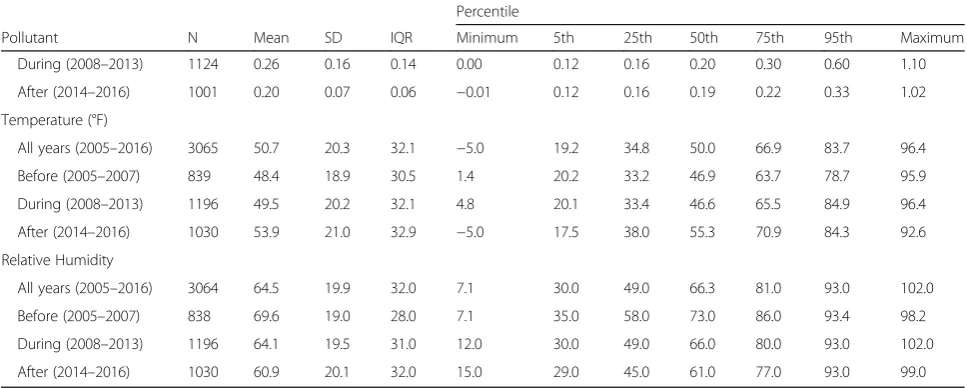
During (2008–2013) 1124 0.26 0.16 0.14 0.00 0.12 0.16 0.20 0.30 0.60 1.10 After (2014–2016) 1001 0.20 0.07 0.06 −0.01 0.12 0.16 0.19 0.22 0.33 1.02 Temperature (°F)
All years (2005–2016) 3065 50.7 20.3 32.1 −5.0 19.2 34.8 50.0 66.9 83.7 96.4
Before (2005–2007) 839 48.4 18.9 30.5 1.4 20.2 33.2 46.9 63.7 78.7 95.9
During (2008–2013) 1196 49.5 20.2 32.1 4.8 20.1 33.4 46.6 65.5 84.9 96.4 After (2014–2016) 1030 53.9 21.0 32.9 −5.0 17.5 38.0 55.3 70.9 84.3 92.6 Relative Humidity
All years (2005–2016) 3064 64.5 19.9 32.0 7.1 30.0 49.0 66.3 81.0 93.0 102.0
Before (2005–2007) 838 69.6 19.0 28.0 7.1 35.0 58.0 73.0 86.0 93.4 98.2
During (2008–2013) 1196 64.1 19.5 31.0 12.0 30.0 49.0 66.0 80.0 93.0 102.0 After (2014–2016) 1030 60.9 20.1 32.0 15.0 29.0 45.0 61.0 77.0 93.0 99.0 Number of total control periods = 3122; Number of control periods in the Before, During, and After period were 839, 1250, and 1033, respectively
Table 3Rate of STEMI associated with each interquartile range increase in pollutant concentration (2005–2016)
Lag hours Interquartile range No. of STEMI Odds ratio 95% confidence interval
PM2.5(μg/m3)
0 7.59 858 1.03 0.95, 1.13
0–2 7.33 848 1.05 0.96, 1.15
0–11 6.57 855 1.02 0.93, 1.12
0–23 6.21 854 1.01 0.91, 1.11
0–47 5.71 848 0.98 0.89, 1.09
0–71 5.30 833 0.96 0.87, 1.07
AMP (particles/cm3)
0 698 779 1.07 0.97, 1.18
0–2 688 771 1.05 0.96, 1.16
0–11 693 780 1.03 0.91, 1.15
0–23 670 772 1.01 0.89, 1.14
0–47 602 763 1.01 0.88, 1.15
0–71 543 751 0.97 0.85, 1.11
UFP (particles/cm3)
0 3702 779 1.12 1.03, 1.22
0–2 3506 771 1.11 1.02, 1.22
0–11 3265 780 1.05 0.93, 1.18
0–23 2955 772 1.00 0.88, 1.14
0–47 2568 763 1.06 0.93, 1.22
0–71 2349 751 1.00 0.86, 1.16
UFP 11-50 nm(particles/cm3)
0 2755 779 1.13 1.04, 1.22
0–2 2551 771 1.12 1.03, 1.21
0–11 2344 780 1.03 0.92, 1.16
0–23 2151 772 0.97 0.85, 1.12
0–47 1862 763 1.04 0.90, 1.21
0–71 1682 751 0.98 0.84, 1.15
UFP 50-100 nm(particles/cm3)
0 1161 779 1.06 0.97, 1.14
0–2 1108 771 1.06 0.97, 1.15
0–11 1118 780 1.07 0.96, 1.20
0–23 1035 772 1.05 0.94, 1.19
0–47 952 763 1.09 0.95, 1.25
0–71 844 751 1.02 0.89, 1.18
Black Carbon (μg/m3)
0 0.44 891 1.09 1.01, 1.18
0–2 0.43 885 1.09 1.00, 1.18
0–11 0.42 891 1.05 0.95, 1.16
0–23 0.39 893 1.05 0.94, 1.16
0–47 0.35 884 1.10 0.98, 1.23
0–71 0.33 881 1.03 0.91, 1.17
SO2(ppb)
Table 3Rate of STEMI associated with each interquartile range increase in pollutant concentration (2005–2016)(Continued)
Lag hours Interquartile range No. of STEMI Odds ratio 95% confidence interval
0–2 2.20 884 1.09 1.02, 1.18
0–11 2.27 889 1.17 1.06, 1.29
0–23 2.30 896 1.15 1.01, 1.30
0–47 2.19 886 1.14 0.98, 1.33
0–71 2.22 883 1.18 0.99, 1.41
O3(ppb)
0 18.0 884 0.89 0.77, 1.03
0–2 17.3 872 0.90 0.78, 1.04
0–11 15.2 888 0.92 0.80, 1.06
0–23 13.7 893 0.92 0.79, 1.07
0–47 12.9 887 0.87 0.73, 1.03
0–71 12.3 883 0.90 0.75, 1.07
CO (ppm)
0 0.23 866 1.15 1.02, 1.29
0–2 0.23 852 1.13 1.00, 1.28
0–11 0.21 873 1.10 0.96, 1.27
0–23 0.22 875 1.07 0.91, 1.25
0–47 0.21 870 1.10 0.94, 1.30
0–71 0.21 864 1.08 0.91, 1.29
Odds ratios were estimated from conditional logistic regression models adjusting for mean temperature and relative humidity during the same lag hour(s)
STEMIST-elevation myocardial infarction
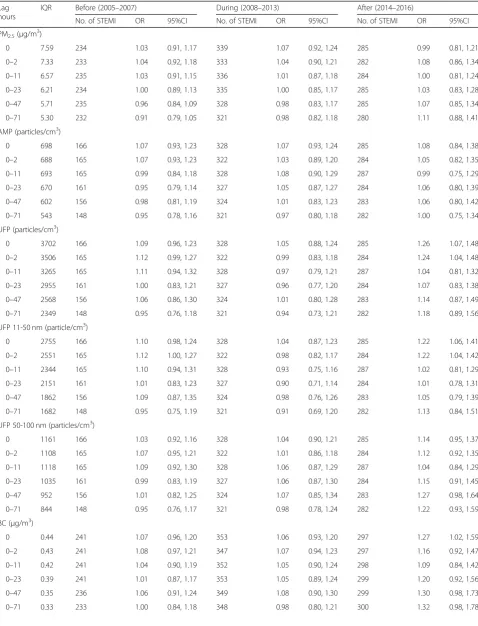
Table 4Rate of STEMI associated with each interquartile range increase in pollutant concentration in the Before, During, and After periods
Lag hours
IQR Before (2005–2007) During (2008–2013) After (2014–2016)
No. of STEMI OR 95%CI No. of STEMI OR 95%CI No. of STEMI OR 95%CI
PM2.5(μg/m 3
)
0 7.59 234 1.03 0.91, 1.17 339 1.07 0.92, 1.24 285 0.99 0.81, 1.21
0–2 7.33 233 1.04 0.92, 1.18 333 1.04 0.90, 1.21 282 1.08 0.86, 1.34
0–11 6.57 235 1.03 0.91, 1.15 336 1.01 0.87, 1.18 284 1.00 0.81, 1.24
0–23 6.21 234 1.00 0.89, 1.13 335 1.00 0.85, 1.17 285 1.03 0.83, 1.28
0–47 5.71 235 0.96 0.84, 1.09 328 0.98 0.83, 1.17 285 1.07 0.85, 1.34
0–71 5.30 232 0.91 0.79, 1.05 321 0.98 0.82, 1.18 280 1.11 0.88, 1.41
AMP (particles/cm3)
0 698 166 1.07 0.93, 1.23 328 1.07 0.93, 1.24 285 1.08 0.84, 1.38
0–2 688 165 1.07 0.93, 1.23 322 1.03 0.89, 1.20 284 1.05 0.82, 1.35
0–11 693 165 0.99 0.84, 1.18 328 1.08 0.90, 1.29 287 0.99 0.75, 1.29
0–23 670 161 0.95 0.79, 1.14 327 1.05 0.87, 1.27 284 1.06 0.80, 1.39
0–47 602 156 0.98 0.81, 1.19 324 1.01 0.83, 1.23 283 1.06 0.80, 1.42
0–71 543 148 0.95 0.78, 1.16 321 0.97 0.80, 1.18 282 1.00 0.75, 1.34
UFP (particles/cm3)
0 3702 166 1.09 0.96, 1.23 328 1.05 0.88, 1.24 285 1.26 1.07, 1.48
0–2 3506 165 1.12 0.99, 1.27 322 0.99 0.83, 1.18 284 1.24 1.04, 1.48
0–11 3265 165 1.11 0.94, 1.32 328 0.97 0.79, 1.21 287 1.04 0.81, 1.32
0–23 2955 161 1.00 0.83, 1.21 327 0.96 0.77, 1.20 284 1.07 0.83, 1.38
0–47 2568 156 1.06 0.86, 1.30 324 1.01 0.80, 1.28 283 1.14 0.87, 1.49
0–71 2349 148 0.95 0.76, 1.18 321 0.94 0.73, 1.21 282 1.18 0.89, 1.56
UFP 11-50 nm (particle/cm3)
0 2755 166 1.10 0.98, 1.24 328 1.04 0.87, 1.23 285 1.22 1.06, 1.41
0–2 2551 165 1.12 1.00, 1.27 322 0.98 0.82, 1.17 284 1.22 1.04, 1.42
0–11 2344 165 1.10 0.94, 1.31 328 0.93 0.75, 1.16 287 1.02 0.81, 1.29
0–23 2151 161 1.01 0.83, 1.23 327 0.90 0.71, 1.14 284 1.01 0.78, 1.31
0–47 1862 156 1.09 0.87, 1.35 324 0.98 0.76, 1.26 283 1.05 0.79, 1.39
0–71 1682 148 0.95 0.75, 1.19 321 0.91 0.69, 1.20 282 1.13 0.84, 1.51
UFP 50-100 nm (particles/cm3)
0 1161 166 1.03 0.92, 1.16 328 1.04 0.90, 1.21 285 1.14 0.95, 1.37
0–2 1108 165 1.07 0.95, 1.21 322 1.01 0.86, 1.18 284 1.12 0.92, 1.35
0–11 1118 165 1.09 0.92, 1.30 328 1.06 0.87, 1.29 287 1.04 0.84, 1.29
0–23 1035 161 0.99 0.83, 1.19 327 1.06 0.87, 1.30 284 1.15 0.91, 1.45
0–47 952 156 1.01 0.82, 1.25 324 1.07 0.85, 1.34 283 1.27 0.98, 1.64
0–71 844 148 0.95 0.76, 1.17 321 0.98 0.78, 1.24 282 1.22 0.93, 1.59
BC (μg/m3)
0 0.44 241 1.07 0.96, 1.20 353 1.06 0.93, 1.20 297 1.27 1.02, 1.59
0–2 0.43 241 1.08 0.97, 1.21 347 1.07 0.94, 1.23 297 1.16 0.92, 1.47
0–11 0.42 241 1.04 0.90, 1.19 352 1.05 0.90, 1.24 298 1.09 0.84, 1.42
0–23 0.39 241 1.01 0.87, 1.17 353 1.05 0.89, 1.24 299 1.20 0.92, 1.56
0–47 0.35 236 1.06 0.91, 1.24 349 1.08 0.90, 1.30 299 1.30 0.98, 1.73
State using hospital admissions of NY residents living near PM2.5 monitoring stations in Buffalo, Albany, Rochester, and New York City during the same study period of 2005–2016 [35]. In that analysis, we observed a greater ex-cess rate of ischemic heart disease hospital admissions as-sociated with increased PM2.5 concentrations in the previous 2 days in the AFTER period (2.8%; 2014–2016) than in the DURING (0.6%; 2008–2013) or BEFORE (0.8%; 2005–2007) periods [35]. Our finding of a greater excess rate of STEMI associated with increased UFP con-centrations in the previous hour in the AFTER period (26%) compared to the DURING (5%) and BEFORE (9%) periods, is similar. Together, these findings may reflect the same change in PM composition and differential trigger-ing of acute cardiovascular events by one or more PM components and/or PM mixtures. We suspect that sec-ondary organic compounds and particle-bound reactive oxygen species (ROS) may play a role in the stronger ad-verse effect of these pollutants (i.e., UFP, UFP 11-50 nm, BC, SO2,) after economic changes and policy initiatives that reduced SO2and NOx emissions. It is also possible that this lower relative rate estimated in the AFTER period was attributable to non-linearity of the exposure-response
function. However, this seems unlikely, since our sensitiv-ity analyses of the rate of STEMI associated with UFP in the previous hour suggested a linear (1 df) exposure-re-sponse function fit the data best.
Concentrations of sulfate and nitrate have decreased from 2005 to 2016 across Rochester and New York State following air quality policy initiatives and economic changes [1, 36]. However, Squizzato et al. and Zhang et al. reported that over this same period, secondary organic carbon increased across New York State [35,37]. These decreases in SO2and NOx emissions may have led to an increased oxidation rate of volatile organic compounds by hydroxyl radicals that would have otherwise reacted with the pollutant gases [37,38]. The oxidation of SO2and NO2forms strong acid, but oxidation of organic compounds forms secondary organic aerosol and produces ROS such as peroxy radicals and peroxide com-pounds [39]. ROS along with the secondary organics can de-posit on particles (particle-bound ROS), which can then be inhaled leading to oxidative stress [40]. Oxidative stress and associated inflammation are hypothesized to be key mecha-nisms underlying the adverse cardiovascular health effect as-sociated with air pollutants [7]. Although it is well known that ROS can be formed in situ after particles are deposited Table 4Rate of STEMI associated with each interquartile range increase in pollutant concentration in the Before, During, and After periods(Continued)
Lag hours
IQR Before (2005–2007) During (2008–2013) After (2014–2016)
No. of STEMI OR 95%CI No. of STEMI OR 95%CI No. of STEMI OR 95%CI
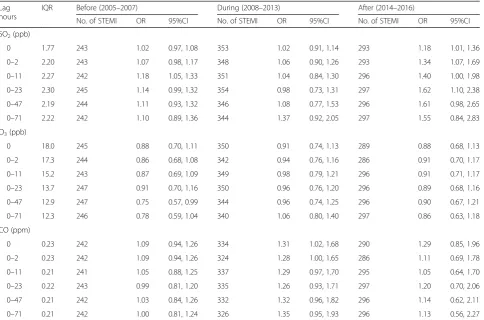
SO2(ppb)
0 1.77 243 1.02 0.97, 1.08 353 1.02 0.91, 1.14 293 1.18 1.01, 1.36
0–2 2.20 243 1.07 0.98, 1.17 348 1.06 0.90, 1.26 293 1.34 1.07, 1.69
0–11 2.27 242 1.18 1.05, 1.33 351 1.04 0.84, 1.30 296 1.40 1.00, 1.98
0–23 2.30 245 1.14 0.99, 1.32 354 0.98 0.73, 1.31 297 1.62 1.10, 2.38
0–47 2.19 244 1.11 0.93, 1.32 346 1.08 0.77, 1.53 296 1.61 0.98, 2.65
0–71 2.22 242 1.10 0.89, 1.36 344 1.37 0.92, 2.05 297 1.55 0.84, 2.83
O3(ppb)
0 18.0 245 0.88 0.70, 1.11 350 0.91 0.74, 1.13 289 0.88 0.68, 1.13
0–2 17.3 244 0.86 0.68, 1.08 342 0.94 0.76, 1.16 286 0.91 0.70, 1.17
0–11 15.2 243 0.87 0.69, 1.09 349 0.98 0.79, 1.21 296 0.91 0.71, 1.17
0–23 13.7 247 0.91 0.70, 1.16 350 0.96 0.76, 1.20 296 0.89 0.68, 1.16
0–47 12.9 247 0.75 0.57, 0.99 344 0.96 0.74, 1.25 296 0.90 0.67, 1.21
0–71 12.3 246 0.78 0.59, 1.04 340 1.06 0.80, 1.40 297 0.86 0.63, 1.18
CO (ppm)
0 0.23 242 1.09 0.94, 1.26 334 1.31 1.02, 1.68 290 1.29 0.85, 1.96
0–2 0.23 242 1.09 0.94, 1.26 324 1.28 1.00, 1.65 286 1.11 0.69, 1.78
0–11 0.21 241 1.05 0.88, 1.25 337 1.29 0.97, 1.70 295 1.05 0.64, 1.70
0–23 0.22 243 0.99 0.81, 1.20 335 1.26 0.93, 1.71 297 1.20 0.70, 2.06
0–47 0.21 242 1.03 0.84, 1.26 332 1.32 0.96, 1.82 296 1.14 0.62, 2.11
0–71 0.21 242 1.00 0.81, 1.24 326 1.35 0.95, 1.93 296 1.13 0.56, 2.27
Odds ratios were estimated from conditional logistic regression models adjusting for mean temperature and relative humidity during the same lag hour(s)
in the respiratory tract, little attention has been focused on particle-bound ROS [39, 40]. We suspect that PM high in secondary organics and ROS may be more toxic than PM high in secondary sulfate and nitrate in triggering MI.
Furthermore, recent source apportionment analyses across New York State including Rochester suggest that although PM2.5 concentrations and contributions from most major source types were decreasing, spark-ignition vehicle emissions were increasing [4, 37]. Rich et al. (2019) found increased rates of cardiovascular hospitali-zations associated with increased concentrations of spark ignition vehicles and diesel emissions in the previous few days [41]. The correlation coefficient between second-ary organic carbon and the spark-ignition vehicle contribu-tion to PM2.5 mass in Rochester was 0.73, suggesting that the increased formation of secondary organic carbon in the AFTER period may be associated with spark-ignition auto-motive emissions. This result is consistent with our findings that the UFP 11–50 nm fraction (marker for nucleation and spark ignition vehicle emissions [23]) was the primary con-tributor for the increased rate of STEMI associated with UFP. Diesel emissions also contribute to nucleation mode particles [23]. UFP 50–100 nm fraction (a larger mode
indi-cator of diesel vehicle emissions) was not associated with in-creased rates of STEMI. Taken together, the observed stronger effect of UFP and BC on the rate of STEMI in the AFTER period may be explained by increased formation of secondary organics and ROS in the atmosphere, in part from spark-ignition vehicle emissions, and the subsequent increase in particle-bound ROS. These findings suggest that although the concentrations of PM have decreased following policy initiatives and economic changes, changing composition of PM may make the same dose of PM (e.g. each 3702 parti-cles/cm3of UFP) more toxic in triggering STEMI.
SO2 also had a stronger effect in the AFTER period, which may represent the influence of the remaining emissions from diesel traffic near the monitoring site in-cluding heavy-duty diesel traffic on the major roads and the adjacent diesel trains. Although on-road diesel fuel went to ultralow sulfur in 2006 and non-road diesel sold in NYS went to ultralow in 2012, out-of-state non-road diesel such as that used in diesel railroad engines was not ultralow sulfur until 2014. There would also be an influence from upwind coal-fired power plants in Dun-kirk, NY (shutdown December 31, 2015) and Tona-wanda, NY (Huntley Generating Station closed March 1, 2016). Thus, SO2may be a surrogate for fresh secondary organic aerosol being produced in the upwind domain and transported with the SO2. CO had a stronger influ-ence in the DURING and AFTER periods. CO could be a surrogate for spark-ignitions vehicles and residential wood combustion. Squizzato et al. [37] reported that car registrations increased in Monroe County after 2010. However, this also may be a result of a more sensitive
CO monitor starting in 2011, resulting in reduced expos-ure misclassification and less downward bias, and larger relative rates in the DURING and AFTER periods. Health effect studies based on apportioned source contributions are needed to further assess these associations.
This study had several strengths, including a large sample size and multiple years of exposure data, resulting in in-creased statistical power. Additionally, we used symptom on-set time, estimated by the patient and treating physician, to define the start time of each STEMI event, likely resulting in less exposure error than previous studies that used only hos-pital arrival date/time [8,13–17,27]. Further, it allowed us to examine whether the rate of STEMI increased a few hours after increases in ambient pollutant concentrations, rather than just on or after one or more days.
However, our study also had several limitations. First, we used air pollution measurements from a central monitoring station to assign exposure to all subjects living within a 15-mile radius of the site, regardless of the specific distance from the monitoring station to subject’s residence and/or where they worked and spent time. However, this exposure error is likely to be non-differential with regard to case and control periods and thus, should result only in underesti-mates of the relative rate of STEMI. The magnitude of this measurement error and underestimation may vary for differ-ent pollutants. UFP is thought to be more spatially variable than PM2.5and AMP, and our previous work observed high spatial heterogeneity in BC across the Rochester area [42]. Although UFP and BC may be subject to greater exposure error, we observed increased rates of STEMI associated with these two pollutants. The true effect estimates in the absence of exposure measurement error might be even larger.
Third, patients in the three periods were perhaps dif-ferent regarding several clinical characteristics associated with an increased rate of MI [44]. STEMI patients in-cluded in the BEFORE period were older and had a higher prevalence of diabetes and heart failure than patients in the AFTER period. By contrast, STEMI patients in the AFTER period were more often male, smokers, and more often had dyslipidemia. Although these characteristics may be related to susceptibility to acute effects of short-term air pollution exposure, our sensitivity analyses show that the pattern of larger increased rate of STEMI associated with increased UFP concentrations at lag hour 0 in the AFTER period compared to the BEFORE and DURING periods remained when also adjusting for interactions between air pollutant and age, sex, smoking, diabetes, dyslipidemia, and heart fail-ure in separate models (Additional file1: Table S4), suggest-ing these differences in period-specific effect estimates were not likely due to differences in the characteristics of the STEMI patients by period and interactions between those characteristics and air pollutant concentrations. Further-more, as discussed above, the pattern of a larger increased rate of STEMI associated with increased UFP in the AFTER period in the present study is similar to the larger rate of is-chemic heart disease hospital admissions associated with in-creased PM2.5in the AFTER period reported by Zhang et al. across New York State [35]. This correspondence sug-gests that difference in study population by period may not be the sole reason for our observed period-specific effects. It is also of note that since the proportion of missing data on clinical characteristics was large in the BEFORE period (18% missing), we may not have accurately compared STEMI patient characteristics between periods.
Fourth, we did not have data on influenza in our study subjects or influenza epidemics occurring during the study period, and thus did not adjust for this variable in our ana-lyses. However, influenza may have been a mediator of the association between air pollution and STEMI, rather than a confounder, as several studies have reported triggering of re-spiratory infection by short term increases in air pollutant concentrations [43,45–48], and others have suggested that influenza may trigger acute myocardial infarction [49–51]. Finally, although our inference was primarily made by con-sidering the pattern of STEMI response to pollutants across multiple lag times and not just whether each was statistically significant, type I error in the assessment of the main effect of air pollution on STEMI might be inflated due to multiple comparisons.
Conclusions
In summary, increased rates of STEMI associated with increased UFP, UFP-11-50 nm, BC, and SO2 concentra-tions were higher in the AFTER period (2014–2016) compared to the BEFORE (2005–2007) and DURING (2008–2013) periods. This may be due to changes in PM
composition (i.e. higher secondary organic carbon and particle-bound ROS) following multiple air quality pol-icies and economic changes. The sources and the role of secondary organics and particle-bound ROS in triggering MI need to be further studied.
Additional file
Additional file 1:Supplementary materials. (DOCX 393 kb)
Abbreviations
AMP:Accumulation mode particle; BC: Black carbon; CABG: Coronary Artery Bypass Grafting; Cath Lab: Catheterization Laboratory; CO: Carbon monoxide; IQR: Interquartile range; NOx: Nitrogen oxide; O3: Ozone; OR: Odds ratio;
PM: Particulate matter; SO2: Sulfur dioxide; STEMI: ST elevation myocardial
infarctions; UFP: Ultrafine particle; URMC: University of Rochester Medical Center
Acknowledgments
The authors would like to thank Melanie Robinson for her assistance in initial data acquisition and management.
Authors’contributions
MW, PKH, and DQR drafted the manuscript. PKH, SC, FL, MM, SS, KTM, and D Chalupa collected and processed the health and air pollution data. MW, PKH, DQR, EvW, D Croft, MM, and SS analyzed and interpreted the data. MM, SWT, SC, FL, EvW, D Croft, SS, KTW, and D Chalupa contributed to critical revision of the manuscript. All authors read and approved the final manuscript.
Funding
This work was supported by contract 59802 and 59800 from the New York State Energy Research and Development Authority, and grant P30 ES01247 from the National Institutes of Environmental Health Sciences. Scott Cameron was supported by grant K08HL128856 from the National Heart, Lung, and Blood Institute and training grant T32 HL066988–1 from the National Institute of Health. Daniel Croft was supported by training grant T32 HL066988–1 from the National Institute of Health.
Availability of data and materials
The datasets generated and/or analyzed during the current study are not publicly available since it contains patient health information.
Ethics approval and consent to participate
This study was approved by the University of Rochester Medical Center Research Subjects Review Board with a waiver of written informed consent.
Consent for publication Not applicable.
Competing interests
The authors declare that they have no competing interests.
Author details
Received: 19 September 2018 Accepted: 23 August 2019
References
1. Emami F, Masiol M, Hopke PK. Air pollution at Rochester, NY: long-term trends and multivariate analysis of upwind SO2 source impacts. Sci Total Environ. 2018;612:1506–15.
2. Squizzato S, Masiol M, Rich DQ, Hopke PK. PM2.5 and gaseous pollutants in New York State during 2005–2016: Spatial variability, temporal trends, and economic influences. Atmos Environ. 2018;183:209–24.
3. Masiol M, Squizzato S, Chalupa DC, Utell MJ, Rich DQ, Hopke PK. Long-term trends in submicron particle concentrations in a metropolitan area of the northeastern United States. Sci Total Environ. 2018;633:59–70.
4. Masiol M, Squizzato S, Rich DQ, Hopke PK. Long-term trends (2005–2016) of source apportioned PM2.5 across New York state. Atmos Environ. 2019;201:110–20. 5. Bourdrel T, Bind M-A, Béjot Y, Morel O, Argacha J-F. Cardiovascular effects of
air pollution. Arch Cardiovasc Dis. 2017;110(11):634–42.
6. Brook RD. Cardiovascular effects of air pollution. Clin Sci (London, England : 1979). 2008;115(6):175–87.
7. Brook RD, Rajagopalan S, Pope CA 3rd, Brook JR, Bhatnagar A, Diez-Roux AV, Holguin F, Hong Y, Luepker RV, Mittleman MA, et al. Particulate matter air pollution and cardiovascular disease: an update to the scientific statement from the American Heart Association. Circulation. 2010;121(21):2331–78. 8. Mustafic H, Jabre P, Caussin C, Murad MH, Escolano S, Tafflet M, Perier MC,
Marijon E, Vernerey D, Empana JP, et al. Main air pollutants and myocardial infarction: a systematic review and meta-analysis. JAMA. 2012;307(7):713–21. 9. Rich DQ, Kipen HM, Huang W, Wang G, Wang Y, Zhu P, Ohman-Strickland P,
Hu M, Philipp C, Diehl SR, et al. Association between changes in air pollution levels during the Beijing Olympics and biomarkers of inflammation and thrombosis in healthy young adults. Jama. 2012;307(19):2068–78. 10. Rich DQ, Zareba W, Beckett W, Hopke PK, Oakes D, Frampton MW,
Bisognano J, Chalupa D, Bausch J, O'Shea K, et al. Are ambient ultrafine, accumulation mode, and fine particles associated with adverse cardiac responses in patients undergoing cardiac rehabilitation? Environ Health Perspect. 2012;120(8):1162–9.
11. Evans KA, Hopke PK, Utell MJ, Kane C, Thurston SW, Ling FS, Chalupa D, Rich DQ. Triggering of ST-elevation myocardial infarction by ambient wood smoke and other particulate and gaseous pollutants. J Expo Sci Environ Epidemiol. 2017;27(2):198–206.
12. Gardner B, Ling F, Hopke PK, Frampton MW, Utell MJ, Zareba W, Cameron SJ, Chalupa D, Kane C, Kulandhaisamy S, et al. Ambient fine particulate air pollution triggers ST-elevation myocardial infarction, but not non-ST elevation myocardial infarction: a case-crossover study. Part Fibre Toxicol. 2014;11:1. 13. Akbarzadeh MA, Khaheshi I, Sharifi A, Yousefi N, Naderian M, Namazi MH,
Safi M, Vakili H, Saadat H, Alipour Parsa S, et al. The association between exposure to air pollutants including PM10, PM2.5, ozone, carbon monoxide, sulfur dioxide, and nitrogen dioxide concentration and the relative risk of developing STEMI: a case-crossover design. Environ Res. 2018;161:299–303. 14. Argacha JF, Collart P, Wauters A, Kayaert P, Lochy S, Schoors D, Sonck J, de Vos T, Forton M, Brasseur O, et al. Air pollution and ST-elevation myocardial infarction: a case-crossover study of the Belgian STEMI registry 2009-2013. Int J Cardiol. 2016;223:300–5.
15. Liu H, Tian Y, Cao Y, Song J, Huang C, Xiang X, Li M, Hu Y. Fine particulate air pollution and hospital admissions and readmissions for acute myocardial infarction in 26 Chinese cities. Chemosphere. 2018;192:282–8.
16. Pope CA, Muhlestein JB, Anderson JL, Cannon JB, Hales NM, Meredith KG, Le V, Horne BD. Short-Term Exposure to Fine Particulate Matter Air Pollution Is Preferentially Associated With the Risk of ST-Segment Elevation Acute Coronary Events. J Am Heart Assoc. 2015;4(12):e002506.
17. Zhang Q, Qi W, Yao W, Wang M, Chen Y, Zhou Y. Ambient particulate matter (PM2.5/PM10) exposure and emergency department visits for acute myocardial infarction in Chaoyang District, Beijing, China during 2014: A case-crossover study. J Epidemiol. 2016;26(10):538–45.
18. Rich DQ, Özkaynak H, Crooks J, Baxter L, Burke J, Ohman-Strickland P, Thevenet-Morrison K, Kipen HM, Zhang J, Kostis JB, et al. The triggering of myocardial infarction by fine particles is enhanced when particles are enriched in secondary species. Environ Sci Technol. 2013;47(16).https://doi.org/10.1021/es4027248. 19. O'Gara PT, Kushner FG, Ascheim DD, Casey DE Jr, Chung MK, de Lemos JA,
Ettinger SM, Fang JC, Fesmire FM, Franklin BA, et al. 2013 ACCF/AHA guideline for the management of ST-elevation myocardial infarction: a report of the
American College of Cardiology Foundation/American Heart Association task force on practice guidelines. Circulation. 2013;127(4):e362–425.
20. Kittelson DB, Watts WF, Johnson JP, Schauer JJ, Lawson DR. On-road and laboratory evaluation of combustion aerosols—Part 2:: Summary of spark ignition engine results. J Aerosol Sci. 2006;37(8):931–49.
21. Kittelson DB, Watts WF, Johnson JP. On-road and laboratory evaluation of combustion aerosols—Part1: summary of diesel engine results. J Aerosol Sci. 2006;37(8):913–30.
22. Kasumba J, Hopke PK, Chalupa DC, Utell MJ. Comparison of sources of submicron particle number concentrations measured at two sites in Rochester, NY. Sci Total Environ. 2009;407(18):5071–84.
23. Kittelson DB. Engines and nanoparticles: a review. J Aerosol Sci. 1998;29(5): 575–88.
24. Masiol M, Squizzato S, Cheng M-D, Rich DQ, Hopke PK. Differential probability functions for investigating long-term changes in local and regional air pollution sources. Aerosol Air Qual Res. 2019;19(4):724–36. 25. Levy D, Lumley T, Sheppard L, Kaufman J, Checkoway H. Referent selection
in case-crossover analyses of acute health effects of air pollution. Epidemiology. 2001;12(2):186–92.
26. Maclure M. The case-crossover design: a method for studying transient effects on the risk of acute events. Am J Epidemiol. 1991;133(2):144–53. 27. Butland BK, Atkinson RW, Milojevic A, Heal MR, Doherty RM, Armstrong BG,
MacKenzie IA, Vieno M, Lin C, Wilkinson P. Myocardial infarction, ST-elevation and non-ST-ST-elevation myocardial infarction and modelled daily pollution concentrations: a case-crossover analysis of MINAP data. Open Heart. 2016;3(2):e000429.
28. Jeong C-H, Hopke PK, Chalupa D, Utell M. Characteristics of nucleation and growth events of ultrafine particles measured in Rochester, NY. Environ Sci Technol. 2004;38(7):1933–40.
29. Oberdorster G, Oberdorster E, Oberdorster J. Nanotoxicology: an emerging discipline evolving from studies of ultrafine particles. Environ Health Perspect. 2005;113(7):823–39.
30. Gong J, Zhu T, Kipen H, Wang G, Hu M, Guo Q, Ohman-Strickland P, Lu SE, Wang Y, Zhu P, et al. Comparisons of ultrafine and fine particles in their associations with biomarkers reflecting physiological pathways. Environ Sci Technol. 2014;48(9):5264–73.
31. Wang M, Utell MJ, Schneider A, Zareba W, Frampton MW, Oakes D, Hopke PK, Wiltshire J, Kane C, Peters A, et al. Does total antioxidant capacity modify adverse cardiac responses associated with ambient ultrafine, accumulation mode, and fine particles in patients undergoing cardiac rehabilitation? Environ Res. 2016;149:15–22.
32. Geiser M, Rothen-Rutishauser B, Kapp N, Schurch S, Kreyling W, Schulz H, Semmler M, Im Hof V, Heyder J, Gehr P. Ultrafine particles cross cellular membranes by nonphagocytic mechanisms in lungs and in cultured cells. Environ Health Perspect. 2005;113(11):1555–60.
33. Moller W, Felten K, Sommerer K, Scheuch G, Meyer G, Meyer P, Haussinger K, Kreyling WG. Deposition, retention, and translocation of ultrafine particles from the central airways and lung periphery. Am J Respir Crit Care Med. 2008;177(4):426–32. 34. Zanobetti A, Schwartz J. Air pollution and emergency admissions in Boston,
MA. J Epidemiol Community Health. 2006;60(10):890–5.
35. Zhang W, Lin S, Hopke PK, Thurston SW, van Wijngaarden E, Croft D, Squizzato S, Masiol M, Rich DQ. Triggering of cardiovascular hospital admissions by fine particle concentrations in New York state: before, during, and after implementation of multiple environmental policies and a recession. Environ Pollut. 2018;242:1404–16.
36. Rattigan OV, Civerolo KL, Felton HD, Schwab JJ, Demerjian KL. Long term trends in New York: PM2.5 mass and particle components. Aerosol Air Qual Res. 2016;16(5):1191–205.
37. Squizzato S, Masiol M, Rich DQ, Hopke PK. A long-term source apportionment of PM2.5 in New York state during 2005–2016. Atmos Environ. 2018;192:35–47.
38. Zhao Y, Saleh R, Saliba G, Presto AA, Gordon TD, Drozd GT, Goldstein AH, Donahue NM, Robinson AL. Reducing secondary organic aerosol formation from gasoline vehicle exhaust. Proc Natl Acad Sci. 2017;114(27):6984–9. 39. Hopke PK. Reactive Ambient Particles. In: Nadadur SS, Hollingsworth JW,
editors. Air Pollution and Health Effects. London: Springer London; 2015. p. 1–24.
40. Hopke PK. New directions: reactive particles as a source of human health effects. Atmos Environ. 2008;42(13):3192–4.
admissions by source specific fine particle concentrations in urban centers of New York state. Environ Int. 2019;126:387–94.
42. Wang Y, Hopke PK, Utell MJ. Urban-scale spatial-temporal variability of black carbon and winter residential wood combustion particles. Aerosol Air Qual Res. 2011;11(5):473–81.
43. Croft DP, Zhang W, Lin S, Thurston SW, Hopke PK, Masiol M, Squizzato S, van Wijngaarden E, Utell MJ, Rich DQ. The association between respiratory infection and air pollution in the setting of air quality policy and economic change. Ann Am Thorac Soc. 2019;16(3):321–30.
44. D'Agostino RB Sr, Vasan RS, Pencina MJ, Wolf PA, Cobain M, Massaro JM, Kannel WB. General cardiovascular risk profile for use in primary care: the Framingham heart study. Circulation. 2008;117(6):743–53.
45. Krall JR, Mulholland JA, Russell AG, Balachandran S, Winquist A, Tolbert PE, Waller LA, Sarnat SE. Associations between source-specific fine particulate matter and emergency department visits for respiratory disease in four U.S. cities. Environ Health Perspect. 2017;125(1):97–103.
46. Pirozzi CS, Jones BE, VanDerslice JA, Zhang Y, Paine R 3rd, Dean NC. Short-term air pollution and incident pneumonia. A case-crossover study. Ann Am Thorac Soc. 2018;15(4):449–59.
47. Horne BD, Joy EA, Hofmann MG, Gesteland PH, Cannon JB, Lefler JS, Blagev DP, Korgenski EK, Torosyan N, Hansen GI, et al. Short-term elevation of fine particulate matter air pollution and acute lower respiratory infection. Am J Respir Crit Care Med. 2018;198(6):759–66.
48. Ciencewicki J, Jaspers I. Air pollution and respiratory viral infection. Inhal Toxicol. 2007;19(14):1135–46.
49. Kwong JC, Schwartz KL, Campitelli MA, Chung H, Crowcroft NS, Karnauchow T, Katz K, Ko DT, McGeer AJ, McNally D, et al. Acute myocardial infarction after laboratory-confirmed influenza infection. N Engl J Med. 2018;378(4):345–53. 50. Warren-Gash C, Hayward AC, Hemingway H, Denaxas S, Thomas SL, Timmis
AD, Whitaker H, Smeeth L. Influenza infection and risk of acute myocardial infarction in England and Wales: a CALIBER self-controlled case series study. J Infect Dis. 2012;206(11):1652–9.
51. Warren-Gash C, Smeeth L, Hayward AC. Influenza as a trigger for acute myocardial infarction or death from cardiovascular disease: a systematic review. Lancet Infect Dis. 2009;9(10):601–10.
Publisher’s Note