R E S E A R C H A R T I C L E
Open Access
Serum sclerostin levels are positively
related to bone mineral density in
peritoneal dialysis patients: a
cross-sectional study
Te-Hui Kuo
1,2, Wei-Hung Lin
3, Jo-Yen Chao
1,4, An-Bang Wu
1,4, Chin-Chung Tseng
1, Yu-Tzu Chang
1,
Hung-Hsiang Liou
5*and Ming-Cheng Wang
1,4*Abstract
Background:Sclerostin, an antagonist of the Wingless-type mouse mammary tumor virus integration site (Wnt)
pathway that regulates bone metabolism, is a potential contributor of chronic kidney disease (CKD)–mineral and bone disorder (MBD), which has various forms of presentation, from osteoporosis to vascular calcification. The positive association of sclerostin with bone mineral density (BMD) has been demonstrated in CKD and hemodialysis (HD) patients but not in peritoneal dialysis (PD) patients. This study assessed the association between sclerostin and BMD in PD patients.
Methods:Eighty-nine PD patients were enrolled; their sera were collected for measurement of sclerostin and other CKD–MBD-related markers. BMD was also assessed simultaneously. We examined the relationship between
sclerostin and each parameter through Spearman correlation analysis and by comparing group data between patients with above- and below-median sclerostin levels. Univariate and multiple logistic regression models were employed to define the most predictive of sclerostin levels in the above-median category.
Results:Bivariate analysis revealed that sclerostin was correlated with spine BMD (r= 0.271, P= 0.011), spine BMD T-score (r= 0.274, P= 0.010), spine BMD Z-score (r= 0.237, P= 0.027), and intact parathyroid hormone (PTH; r=−0.357, P< 0.001) after adjustments for age and sex. High BMD, old age, male sex, increased weight and height, diabetes, and high osteocalcin and uric acid levels were observed in patients with high serum sclerostin levels and an inverse relation was noticed between PTH and sclerostin. Univariate logistic regression analysis demonstrated that BMD is positively correlated with above-median sclerostin levels (odds ratio [OR] = 65.61, P= 0.002); the correlation was retained even after multivariate adjustment (OR = 121.5, P= 0.007).
Conclusions: For the first time, this study demonstrated a positive association between serum sclerostin
levels and BMD in the PD population.
Keywords: Sclerostin, Bone mineral density, Peritoneal dialysis, Chronic kidney disease–mineral and bone
disorder (CKD–MBD), Wnt pathway
© The Author(s). 2019Open AccessThis article is distributed under the terms of the Creative Commons Attribution 4.0 International License (http://creativecommons.org/licenses/by/4.0/), which permits unrestricted use, distribution, and reproduction in any medium, provided you give appropriate credit to the original author(s) and the source, provide a link to the Creative Commons license, and indicate if changes were made. The Creative Commons Public Domain Dedication waiver (http://creativecommons.org/publicdomain/zero/1.0/) applies to the data made available in this article, unless otherwise stated. * Correspondence:hh258527@ms23.hinet.net;wangmc@mail.ncku.edu.tw
Background
Chronic kidney disease (CKD)–mineral and bone dis-order (MBD) is a systemic disdis-order caused by alterations in mineral handling, bone and hormonal changes due to CKD, and subsequent cardiovascular disease and mortal-ity; CKD–MBD becomes a potential target to improve CKD care outcomes referred by the KDIGO CKD–MBD guidelines [1]. CKD–MBD is characterized by a disrup-tion in the homeostasis of the renal, skeletal, and cardio-vascular systems. The injured kidney contributes to hyperphosphatemia, excessive bone resorption, and sub-sequent osteopenia in CKD patients with either high- or low-turnover bone disorders resulting in osteoporosis prevalence being higher in patients with CKD than in the general population [2–4]. By accelerating ectopic mineralization, particularly vascular calcification, CKD– MBD extends beyond CKD-related bone disorders to-ward increasing cardiovascular risk and mortality by fur-ther aggravating vascular stiffness and promoting ventricular hypertrophy development. Over the past dec-ade, numerous studies have reported that the wingless-type mouse mammary tumor virus integration site (Wnt)/β-catenin canonical signaling pathway is a major bone mass regulatory pathway [5]. Wnt signaling is me-diated by the binding of Wnt ligands to a transmem-brane receptor complex, composed of the frizzled receptor and either of the two coreceptors, the low-density lipoprotein receptor-related protein (LRP) 5 or LRP6 [6]. Wnt signaling activation reduces osteoblast and osteocyte apoptosis, induces osteoblastogenesis, and inhibits osteoclastogenesis [7]. These actions, resulting in subsequent increase in bone formation and bone density, may be crucial in CKD–MBD pathogenesis [8].
The Wnt signaling pathway is regulated by several inhibi-tors, whose regulatory action involves either preventing Wnt ligands from binding to receptors directly or binding to LRP5 or LRP6 (thus reducing the availability of these coreceptors to Wnt ligands). Of the main regulators in the Wnt pathway, dickkopf (DKK)-1 and particularly sclerostin have recently been studied comprehensively. DKK-1, a 28-kDa glycoprotein found in osteoblasts and osteocytes, in-hibits the Wnt pathway by binding to LRP5, LRP6, and Kremen-1 (another coreceptor) to induce internalization of these coreceptors [9]. Similar to DKK-1, sclerostin is a 24-kDa glycoprotein, encoded by SOST, but secreted almost exclusively by osteocytes. Sclerostin inhibits the Wnt path-way by competing with Wnts for binding to LRP5 and LRP6 to antagonize the canonical Wnt signaling. In studies mainly on non-CKD population, sclerostin levels were cor-related positively with age, male sex, diabetes, and bone mineral density (BMD) but inversely with physical activity and parathyroid hormone (PTH) levels [10–14].
Patients with CKD have increased bone loss and low BMD risks followed by fractures because of the disturbance
in mineral and bone metabolism [15, 16]. Recent CKD-MBD guidelines have updated that BMD assessment is suf-ficient for fracture prediction in patients with advanced CKD [17]. However, most studies correlating sclerostin with BMD and other CKD–MBD-related factors mainly in-volve nondialyzed CKD or hemodialysis (HD) patients and very few have been in the peritoneal dialysis (PD) popula-tion [18–22]. Thus, this study explored serum sclerostin levels and their association with BMD and other CKD– MBD-related biomarkers in the PD patients.
Methods Patients
This study enrolled patients with end-stage renal disease receiving PD for at least 3 months at the National Cheng Kung University Hospital, a tertiary hospital in Taiwan. The patients attended PD care follow-ups at monthly in-tervals. A written informed consent was obtained from each patient before study participation. The study proto-col was approved by the Institutional Review Board of National Cheng Kung University Hospital (approval number: B-ER-103-279), according to the Ethics of Clin-ical Research, Declaration of Helsinki.
Biochemistry and clinical parameters
For blood examination, all samples were collected and sent to the central laboratory of the hospital in the index month for analysis. The blood examination included complete blood cell count and serum albumin, blood urea nitrogen, creatinine, aspartate transaminase (AST), alanine transaminase (ALT), sodium, potassium, cal-cium, phosphorus, magnesium, alkaline phosphatase (ALP), uric acid, bicarbonate, total cholesterol, triglycer-ide, high-density lipoprotein cholesterol (HDL), low-density lipoprotein cholesterol (LDL), iron profiles, high-sensitivity C-reactive protein (hsCRP), and intact PTH measurement.
ELISA for sclerostin, FGF-23, DKK-1, and CTX measurements
Serum sclerostin, FGF-23, DKK-1, and CTX levels were measured using commercial quantitative sandwich ELISA kits by Biomedica (Vienna, Austria; assay limit: 3.2 pmol/ L, coefficients of variation (CV): 3–10%, median for healthy individuals: 24.14 pmol/L), Kainos (Tokyo, Japan; assay limit: 3 pg/mL, CV < 10%, mean for healthy individ-uals: 42.0 pg/mL), R&D Systems (Minneapolis, USA; assay limit: 4.2 pg/mL, CV: 3.3–7.6%, mean for healthy individ-uals: 2513 pg/mL), and Cloud-Clone Corp. (Wuhan, China; assay limit: 53.4 pg/mL, CV < 10%, range for healthy individuals: 0.45–2.4 ng/mL), respectively.
Bone mineral densitometry
Anteroposterior lumbar spine (L1–L4) BMD measurement (in g/cm2) was performed through dual-energy X-ray ab-sorptiometry by using a LUNAR Prodigy Model (GE Healthcare, Madison, USA), according to the standard protocol in the manufacturer’s instructions. For quality as-surance of BMD measurement, certified densitometry oper-ators implemented a quality assurance program by including a daily calibration measurement and using stand-ard phantoms supplied with the system, according to the manufacturer’s instructions. The mean CV for lumbar spine in our center is 0.25%. The total lumbar spine BMD was calculated by averaging the BMD of L1–L4 vertebrae. BMD T and Z scores were classified according to World Health Organization criteria.
Statistical analyses
Baseline demographics and comorbidities are reported as means ± standard deviations (SD), medians and inter-quartile ranges (IQR), or number and percentages, as ap-propriate. Spearman rank correlation coefficients were used to examine the relationship between serum scleros-tin levels and each clinical parameter. Partial correlation coefficients were assessed after age and gender adjust-ment. To perform further analysis, we stratified patients evenly into two groups for comparison according to me-dian serum sclerostin levels because the normal serum sclerostin range in the PD population remains unclear. Grouped data were compared through Student t, Mann–Whitney U, or chi-square testing, as appropriate. All relevant variables with statistical significance in the grouped data comparison were tested through univariate logistic regression modeling to define the most predict-ive of sclerostin levels in the above-median category. Multiple logistic regression analysis was subsequently performed to assess the contribution of the clinical and laboratory parameters, with adjustments for age, sex, and weight; according to the sample size estimates, as maximum of four predictors can be included in multiple regression for the 89 samples. Box-Tidwell testing was
performed to examine whether the explanatory continu-ous variables comply with the linearity assumption of lo-gistic regression in the logit [24]. The data were analyzed on SAS (version 9.4 for Windows; SAS Insti-tute Inc., Cary, NC, USA), with P< 0.05 being consid-ered statistically significant.
Results
Patient characteristics
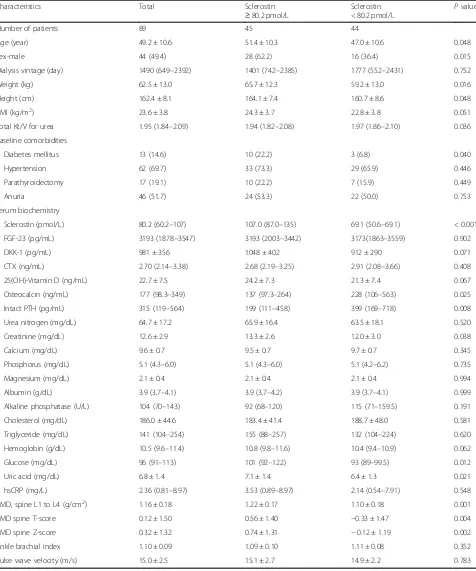
In total, 89 PD patients were enrolled. Table1lists their demographic data, comorbidities, and blood examination and image study results: age, 49.2 ± 10.6 years; male-to-female ratio, 0.49; PD vintage, 1490 (649–2392) days; body mass index, 23.6 ± 3.8; total Kt/V for urea (i.e., peritoneal Kt/V plus residual renal Kt/V), 1.95 (1.84– 2.09); number of anuric patients, 46 (51.7%); and serum sclerostin level, 80.2 (60.2–107.0) pmol/L. Approxi-mately 19.1% of the patients had received parathyroidec-tomy, and only 14.6% had diabetes. Mild femoral vascular calcification was noted in the X-ray of only four patients, and no patient demonstrated bilateral hand vascular calcification. Because ankle brachial index and pulse wave velocity data were available for further ana-lysis, we have not presented the vascular calcification scores here.
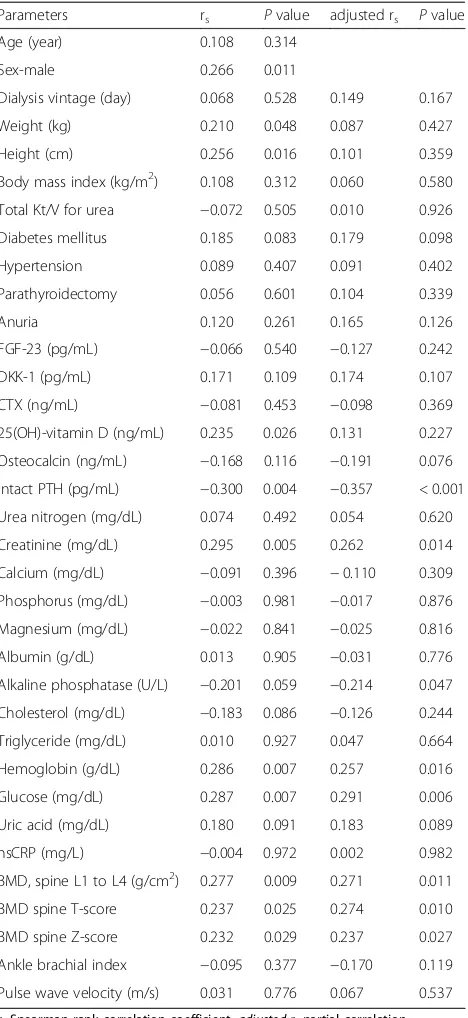
Correlations between serum sclerostin level and clinical parameters
Bivariate analysis (Table 2) revealed that sclerostin was positively associated with male sex (r= 0.266, P= 0.011); weight (r= 0.210, P= 0.048); height (r= 0.256, P= 0.016); serum 25(OH)-vitamin D (r= 0.235, P= 0.026), creatinine (r= 0.295,P= 0.005), hemoglobin (r= 0.286,P= 0.007), and glucose (r= 0.287,P= 0.007) levels; spine BMD (r= 0.277, P= 0.009); and spine BMD T (r= 0.237, P= 0.025) and Z (r= 0.232,P= 0.029) scores. By contrast, it was inversely as-sociated with intact PTH levels (r=−0.300,P= 0.004). The relationship of sclerostin with creatinine (r= 0.262, P= 0.014), hemoglobin (r= 0.257,P= 0.016), and glucose (r= 0.291, P= 0.006) levels; spine BMD (r= 0.271, P= 0.011); spine BMD T (r= 0.274, P= 0.010) and Z (r= 0.237,P= 0.027) scores; and intact PTH (r=−0.357, P< 0.001) remained significant after adjustment for age and sex.
Differences in patient characteristics according to serum sclerostin levels
Table 1Patient characteristics and comparison between patients with above- and below-median sclerostin levels
Characteristics Total Sclerostin
≥80.2 pmol/L
Sclerostin
< 80.2 pmol/L P value
Number of patients 89 45 44
Age (year) 49.2 ± 10.6 51.4 ± 10.3 47.0 ± 10.6 0.048
Sex-male 44 (49.4) 28 (62.2) 16 (36.4) 0.015
Dialysis vintage (day) 1490 (649–2392) 1401 (742–2385) 1777 (552–2431) 0.752
Weight (kg) 62.5 ± 13.0 65.7 ± 12.3 59.2 ± 13.0 0.016
Height (cm) 162.4 ± 8.1 164.1 ± 7.4 160.7 ± 8.6 0.048
BMI (kg/m2) 23.6 ± 3.8 24.3 ± 3.7 22.8 ± 3.8 0.051
Total Kt/V for urea 1.95 (1.84–2.09) 1.94 (1.82–2.08) 1.97 (1.86–2.10) 0.036
Baseline comorbidities
Diabetes mellitus 13 (14.6) 10 (22.2) 3 (6.8) 0.040
Hypertension 62 (69.7) 33 (73.3) 29 (65.9) 0.446
Parathyroidectomy 17 (19.1) 10 (22.2) 7 (15.9) 0.449
Anuria 46 (51.7) 24 (53.3) 22 (50.0) 0.753
Serum biochemistry
Sclerostin (pmol/L) 80.2 (60.2–107) 107.0 (87.0–135) 69.1 (50.6–69.1) < 0.001
FGF-23 (pg/mL) 3193 (1878–3547) 3193 (2003–3442) 3173(1863–3559) 0.902
DKK-1 (pg/mL) 981 ± 356 1048 ± 402 912 ± 290 0.071
CTX (ng/mL) 2.70 (2.14–3.38) 2.68 (2.19–3.25) 2.91 (2.08–3.66) 0.408
25(OH)-Vitamin D (ng/mL) 22.7 ± 7.5 24.2 ± 7.3 21.3 ± 7.4 0.067
Osteocalcin (ng/mL) 177 (98.3–349) 137 (97.3–264) 228 (106–563) 0.025
Intact PTH (pg/mL) 315 (119–564) 199 (111–458) 399 (169–718) 0.008
Urea nitrogen (mg/dL) 64.7 ± 17.2 65.9 ± 16.4 63.5 ± 18.1 0.520
Creatinine (mg/dL) 12.6 ± 2.9 13.3 ± 2.6 12.0 ± 3.0 0.038
Calcium (mg/dL) 9.6 ± 0.7 9.5 ± 0.7 9.7 ± 0.7 0.345
Phosphorus (mg/dL) 5.1 (4.3–6.0) 5.1 (4.3–6.0) 5.1 (4.2–6.2) 0.735
Magnesium (mg/dL) 2.1 ± 0.4 2.1 ± 0.4 2.1 ± 0.4 0.994
Albumin (g/dL) 3.9 (3.7–4.1) 3.9 (3.7–4.2) 3.9 (3.7–4.1) 0.999
Alkaline phosphatase (U/L) 104 (70–143) 92 (68–120) 115 (71–159.5) 0.191
Cholesterol (mg/dL) 186.0 ± 44.6 183.4 ± 41.4 188.7 ± 48.0 0.581
Triglyceride (mg/dL) 141 (104–254) 155 (88–257) 132 (104–224) 0.620
Hemoglobin (g/dL) 10.5 (9.6–11.4) 10.8 (9.8–11.6) 10.4 (9.4–10.9) 0.062
Glucose (mg/dL) 96 (91–113) 101 (92–122) 93 (89–99.5) 0.012
Uric acid (mg/dL) 6.8 ± 1.4 7.1 ± 1.4 6.4 ± 1.3 0.021
hsCRP (mg/L) 2.36 (0.81–8.97) 3.53 (0.89–8.97) 2.14 (0.54–7.91) 0.548
BMD, spine L1 to L4 (g/cm2) 1.16 ± 0.18 1.22 ± 0.17 1.10 ± 0.18 0.001
BMD spine T-score 0.12 ± 1.50 0.56 ± 1.40 −0.33 ± 1.47 0.004
BMD spine Z-score 0.32 ± 1.32 0.74 ± 1.31 −0.12 ± 1.19 0.002
Ankle brachial index 1.10 ± 0.09 1.09 ± 0.10 1.11 ± 0.08 0.352
Pulse wave velocity (m/s) 15.0 ± 2.5 15.1 ± 2.7 14.9 ± 2.2 0.783
BMIbody mass index,FGF-23fibroblast growth factor 23,DKK-1dickkopf-1,CTXcross-linked C-telopeptide of type 1 collagen,PTHparathyroid hormone,hsCRP
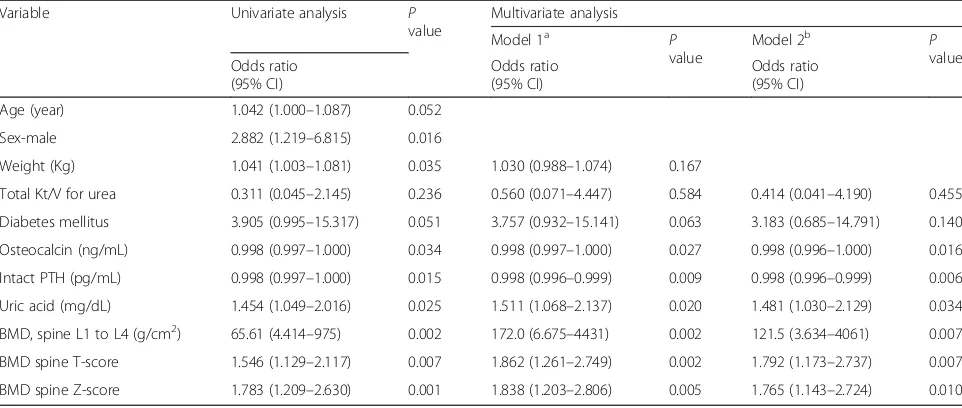
Logistic regression for factors associated with above-median sclerostin levels
Univariate analysis (Table 3) revealed a significant cor-relation of sclerostin with male sex (odds ratio [OR] =
2.882, P= 0.016), uric acid (OR = 1.454, P= 0.025), and BMD (OR = 65.607, P= 0.002). Age, weight, diabetes, osteocalcin levels, and intact PTH levels had marginally statistical significance (P> 0.05) or marginal effects (OR = ~ 1) on sclerostin levels. Multiple logistic regres-sion results indicated that osteocalcin (OR = 0.998, P= 0.016), intact PTH (OR = 0.998,P= 0.006), and uric acid (OR = 1.481,P= 0.034) levels and BMD (OR = 121.5,P= 0.007) were correlated to high serum sclerostin levels with statistical significance; however, some of the effects remained marginal. No continuous predictor demon-strated nonlinearity with statistical significance in the Box-Tidwell testing for the logistic regression.
Discussion
Our findings demonstrated, for the first time in a PD population, that sclerostin levels are positively associ-ated with BMD, an association that remained even after adjustment for various factors. Because gender and weight can have different effects on BMD, their contribution to the sclerostin–BMD association was also investigated. In the general population, particu-larly postmenopausal women, a positive correlation between BMD and sclerostin has been identified [11,
25–27]. This relationship can also be observed in older men and patients with advanced CKD, including those receiving maintenance HD [11, 21, 28, 29]. However, this positive association between sclerostin and BMD cannot be well explained by the BMD-lowering effects of sclerostin, which was demonstrated by an interventional study, in which a lower risk of vertebral fractures was noted in postmenopausal women with osteoporosis after antagonizing sclerostin [30]. In addition, high physical activity, particularly weight-bearing activity, aided in reducing sclerostin levels and thus increased BMD [31]. In another study on healthy men, long-term bed rest reduced BMD and increased sclerostin levels [32]. These results dis-agree with the assumption that serum sclerostin levels increase and thus BMD decreases in older people and CKD or dialysis patients because their physical activ-ity levels typically are low. Nevertheless, considering the causal inferences in this association from the op-posite direction, a possible explanation could be higher BMD in men and patients with higher weights reflect higher total body skeletal mass with more os-teocytes, the main sclerostin-producing cells [11].
Sclerostin levels also increase with age in nondia-lyzed CKD and HD patients [18, 33]. In 2015, Yamada et al. reported that serum sclerostin was positively associated with age in PD patients [34]. However, in the present study, patients with above-median sclerostin levels were characterized by older Table 2Bivariate correlation between sclerostin levels and
clinical parameters
Parameters rs Pvalue adjusted rs Pvalue Age (year) 0.108 0.314
Sex-male 0.266 0.011
Dialysis vintage (day) 0.068 0.528 0.149 0.167
Weight (kg) 0.210 0.048 0.087 0.427
Height (cm) 0.256 0.016 0.101 0.359
Body mass index (kg/m2) 0.108 0.312 0.060 0.580 Total Kt/V for urea −0.072 0.505 0.010 0.926
Diabetes mellitus 0.185 0.083 0.179 0.098
Hypertension 0.089 0.407 0.091 0.402
Parathyroidectomy 0.056 0.601 0.104 0.339
Anuria 0.120 0.261 0.165 0.126
FGF-23 (pg/mL) −0.066 0.540 −0.127 0.242
DKK-1 (pg/mL) 0.171 0.109 0.174 0.107
CTX (ng/mL) −0.081 0.453 −0.098 0.369
25(OH)-vitamin D (ng/mL) 0.235 0.026 0.131 0.227
Osteocalcin (ng/mL) −0.168 0.116 −0.191 0.076
Intact PTH (pg/mL) −0.300 0.004 −0.357 < 0.001
Urea nitrogen (mg/dL) 0.074 0.492 0.054 0.620
Creatinine (mg/dL) 0.295 0.005 0.262 0.014
Calcium (mg/dL) −0.091 0.396 −0.110 0.309
Phosphorus (mg/dL) −0.003 0.981 −0.017 0.876
Magnesium (mg/dL) −0.022 0.841 −0.025 0.816
Albumin (g/dL) 0.013 0.905 −0.031 0.776
Alkaline phosphatase (U/L) −0.201 0.059 −0.214 0.047
Cholesterol (mg/dL) −0.183 0.086 −0.126 0.244
Triglyceride (mg/dL) 0.010 0.927 0.047 0.664
Hemoglobin (g/dL) 0.286 0.007 0.257 0.016
Glucose (mg/dL) 0.287 0.007 0.291 0.006
Uric acid (mg/dL) 0.180 0.091 0.183 0.089
hsCRP (mg/L) −0.004 0.972 0.002 0.982
BMD, spine L1 to L4 (g/cm2) 0.277 0.009 0.271 0.011 BMD spine T-score 0.237 0.025 0.274 0.010
BMD spine Z-score 0.232 0.029 0.237 0.027
Ankle brachial index −0.095 0.377 −0.170 0.119
Pulse wave velocity (m/s) 0.031 0.776 0.067 0.537
rsSpearman rank correlation coefficient,adjusted rspartial correlation
coefficient adjusted for age and gender,BMIbody mass index,FGF-23
fibroblast growth factor 23,DKK-1dickkopf-1,CTXcrosslinked C-telopeptide of type 1 collagen,PTHparathyroid hormone,hsCRPhigh-sensitivity C-reactive
age, with only marginally statistical significance, prob-ably because of our limited sample size.
Moreover, here, intact PTH levels were negatively as-sociated with serum sclerostin levels (Spearman correl-ation coefficient adjusted for age and gender,r=−0.357, P< 0.001). Intact PTH is a significant determinant of serum sclerostin levels in healthy premenopausal and postmenopausal women [10, 35], patients with primary hyperparathyroidism [14], HD patients [8], and PD pa-tients [34], but not in patients with non-dialyzed CKD [18]. Although the PTH–sclerostin relationship was seen in our univariate and multivariate analyses, the effect size was marginal. Some of our patients had received parathyroidectomy, which may interfere with their intact PTH levels; thus, whether parathyroidectomy has a role in circulating sclerostin remains unclear. Because further subgroup analysis was limited by the sample size of our parathyroidectomy patients, we performed another ana-lysis to test for the intact PTH–parathyroidectomy inter-action for serum sclerostin levels; however, no significant interaction was noted (P for interaction = 0.440). Patients with a parathyroidectomy history are mostly present in the dialysis population; two studies have explored sclerostin levels in these dialysis patients [21,34]. However, patients with parathyroidectomy were excluded by Cejka et al. (when including HD patients) and by Yamada et al. (when including PD patients). Hence, more data and studies to elucidate the relation-ship between serum intact PTH and sclerostin levels after parathyroidectomy in these dialysis patients are warranted.
An unexpected finding in the present study was the uric acid–sclerostin relationship. In the univariate logistic
regression, uric acid was positively correlated with scleros-tin, with statistical significance. In the multiple regression analysis with adjustments for age, gender, and weight, this association remained significant (P< 0.05). Thus far, no direct link between uric acid and sclerostin has been re-ported; nevertheless, more data to clarify this association are needed.
Sclerostin is also positively associated with pulse wave velocity for arterial stiffness in postmenopausal women, nondialyzed CKD patients, HD patients, and kidney transplant recipients and thus could be a biomarker for the cardiovascular changes in the CKD–MBD spectrum [22,25,36,37]. However, in our PD patients, such an as-sociation was absent between arterial stiffness and scler-ostin. Although the results were nonsignificant in our PD patients, vascular stiffness could be a later presenta-tion after sclerostin or BMD has changed. The evolving disturbances in the renal–skeletal–cardiovascular axis in the CKD–MBD may target osteoporosis with an early intervention to prevent further cardiovascular damage and improve long-term outcomes; thus, in the early CKD–MBD phase, sclerostin could both be a biomarker and an intervention target. However, we did not obtain this kind of association between arterial stiffness and sclerostin in the PD patients.
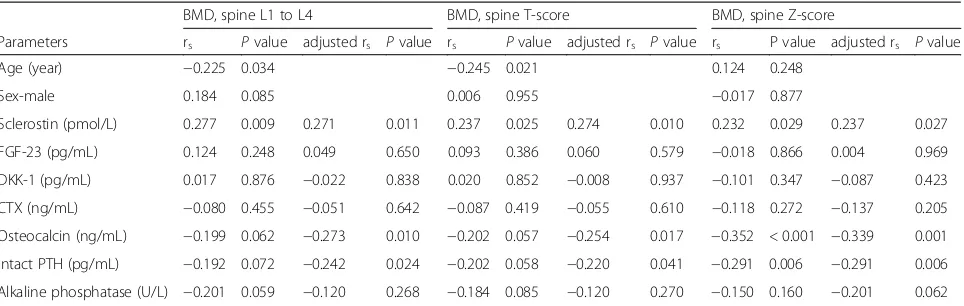
In addition, to explore the relationship between BMD and the bone-related biomarkers other than sclerostin, we compared the respective associations (Table 4). The rela-tionship between DKK-1 and BMD disclosed inconsistent results in previous reports: DKK-1 had a negative correl-ation with BMD in diabetes and predialysis CKD patients [28,38], but in postmenopausal women, HD patients, and people under steroid treatment, this relationship was not Table 3Logistic regression analysis of association of above-median sclerostin levels with clinical and biochemical parameters
Variable Univariate analysis P value
Multivariate analysis
Model 1a P
value
Model 2b P
value Odds ratio
(95% CI)
Odds ratio (95% CI)
Odds ratio (95% CI)
Age (year) 1.042 (1.000–1.087) 0.052
Sex-male 2.882 (1.219–6.815) 0.016
Weight (Kg) 1.041 (1.003–1.081) 0.035 1.030 (0.988–1.074) 0.167
Total Kt/V for urea 0.311 (0.045–2.145) 0.236 0.560 (0.071–4.447) 0.584 0.414 (0.041–4.190) 0.455
Diabetes mellitus 3.905 (0.995–15.317) 0.051 3.757 (0.932–15.141) 0.063 3.183 (0.685–14.791) 0.140
Osteocalcin (ng/mL) 0.998 (0.997–1.000) 0.034 0.998 (0.997–1.000) 0.027 0.998 (0.996–1.000) 0.016
Intact PTH (pg/mL) 0.998 (0.997–1.000) 0.015 0.998 (0.996–0.999) 0.009 0.998 (0.996–0.999) 0.006
Uric acid (mg/dL) 1.454 (1.049–2.016) 0.025 1.511 (1.068–2.137) 0.020 1.481 (1.030–2.129) 0.034
BMD, spine L1 to L4 (g/cm2) 65.61 (4.414
–975) 0.002 172.0 (6.675–4431) 0.002 121.5 (3.634–4061) 0.007 BMD spine T-score 1.546 (1.129–2.117) 0.007 1.862 (1.261–2.749) 0.002 1.792 (1.173–2.737) 0.007
BMD spine Z-score 1.783 (1.209–2.630) 0.001 1.838 (1.203–2.806) 0.005 1.765 (1.143–2.724) 0.010
CIconfidence interval,PTHparathyroid hormone,BMDbone mineral density a
model 1: adjusted for age and gender;b
observed [21,25,39]; moreover, here, we did not find this correlation in our PD patients. Although both sclerostin and DKK-1 express Wnt antagonism, they are independ-ent (not synergistic) regulators of Wnt signaling. DKK-1 and sclerostin do not bind simultaneously to LRP5; DKK-1 can displace sclerostin from a previously formed sclerostin-LRP5 complex [40]. In addition, compared with the BMD-sclerostin association, the lack of BMD-DKK-1 association may be related to DKK-1 not being highly expressed in adult bones unless it is activated by an insult. By contrast, sclerostin expression is downregulated when bone formation or normal skeletal maintenance is re-quired, not merely when fractures occur [41]. The differ-ences in study populations and the wider tissue distribution of DKK-1 compared with that of sclerostin may explain the varying results of their correlation with BMD [25]. FGF-23 is positively correlated significantly with BMD in older men and postmenopausal women [42–44]. However, the association was not noted in the CKD or HD patients [45, 46]. After bone degradation, CTX, a bone resorption marker, is released into circula-tion and eventually excreted through urine [47]. CTX is negatively correlated with BMD in HD patients, but not PD patients [48,49]—similar to our results. Because CTX is renally cleared, residual renal function may alter scleros-tin levels. Here, we analyzed CTX results by stratifying our PD patients into anuric and nonanuric groups but ob-served no difference in CTX levels or total Kt/V between these two groups. According to a study on CTX in HD pa-tients, CTX was nonsignificantly associated with the re-sidual renal function, and CTX sampling time was suggested to be before dialysis because the concentration decreased after HD, implying some HD-related clearance [50]. Osteocalcin, produced by osteoblasts, is often consid-ered a bone formation marker. Our results revealed that BMD is negatively correlated with osteocalcin after adjust-ments for age and gender; similar results were reported in predialysis CKD and HD patients [51, 52]. Nevertheless,
here, the correlation between bone-related biomarkers other than sclerostin and BMD was not strong; however, the trends of the associations in this study were compat-ible with most of the previous reports. Further informa-tion enabling the elucidation of the bone-related biomarker relationships with BMD in PD patients is needed because the actual association may be merely masked by either our small sample size or our inclusion of younger patients with narrow age distribution.
Although our results demonstrated the sclerostin– BMD association, our clinical inference should be inter-preted with caution because the selection of site for BMD measurement and quantification of sclerostin with different assays may demonstrate important differences. Lumbar BMD may increase if abdominal aortic calcifica-tion or spinal degeneracalcifica-tion exists [53–56]. Here, the re-view of pelvis and previous abdominal X-ray revealed that few of our enrolled patients had aorta calcification or severely degenerative spine, which could strongly in-fluence spine BMD accuracy. Although BMD measure-ment is recommended by the KDIGO 2017 Clinical Practice Guideline Update [17], the choice of site for BMD measurement is not clearly stated and recom-mended. Four prospective studies of BMD and incident fractures in adults were reviewed in guideline develop-ment process. The purpose was for fracture prediction and the BMD results of hip or femoral neck were with a higher rate of prediction. However, a few dialysis pa-tients receive total hip replacement surgery because the long-term use of steroid for glomerulonephritis in their predialysis phase has side effects and BMD at these sites cannot be measured. Therefore, in addition to fracture risk assessment, lumbar BMD may still have a role for the assessment of CKD-MBD syndrome, but the evalu-ation of factors affecting the accuracy of BMD measure-ment should be considered simultaneously. Regarding sclerostin measurement, Delanaye et al. reported that commercially available sclerostin ELISAs demonstrated
Table 4Bivariate correlation between bone-related biomarkers and spine BMD
BMD, spine L1 to L4 BMD, spine T-score BMD, spine Z-score
Parameters rs Pvalue adjusted rs Pvalue rs Pvalue adjusted rs Pvalue rs P value adjusted rs Pvalue
Age (year) −0.225 0.034 −0.245 0.021 0.124 0.248
Sex-male 0.184 0.085 0.006 0.955 −0.017 0.877
Sclerostin (pmol/L) 0.277 0.009 0.271 0.011 0.237 0.025 0.274 0.010 0.232 0.029 0.237 0.027
FGF-23 (pg/mL) 0.124 0.248 0.049 0.650 0.093 0.386 0.060 0.579 −0.018 0.866 0.004 0.969
DKK-1 (pg/mL) 0.017 0.876 −0.022 0.838 0.020 0.852 −0.008 0.937 −0.101 0.347 −0.087 0.423
CTX (ng/mL) −0.080 0.455 −0.051 0.642 −0.087 0.419 −0.055 0.610 −0.118 0.272 −0.137 0.205
Osteocalcin (ng/mL) −0.199 0.062 −0.273 0.010 −0.202 0.057 −0.254 0.017 −0.352 < 0.001 −0.339 0.001
Intact PTH (pg/mL) −0.192 0.072 −0.242 0.024 −0.202 0.058 −0.220 0.041 −0.291 0.006 −0.291 0.006
Alkaline phosphatase (U/L) −0.201 0.059 −0.120 0.268 −0.184 0.085 −0.120 0.270 −0.150 0.160 −0.201 0.062
rsSpearman rank correlation coefficient,adjusted rspartial correlation coefficient adjusted for age and gender,FGF-23fibroblast growth factor 23;DKK-1
marked differences in the values of measurement [57]. These differences potentially result from the manufacturer-provided antibodies being different, having crossreactivity with other proteins, and capturing both intact sclerostin and its degraded fragments. In the present study, ELISA for sclerostin may have detected both the intact molecule and its fragments; however, no information on the activity of degraded fragments of sclerostin is currently available. When exploring the re-lationship between sclerostin and its clinical or biochem-ical determinants, our results should be used with caution until a reference assay with high specificity for sclerostin is available.
This study has some limitations. First, similar to any cross-sectional observational study, our study confirmed the expected association, but a causal inference could not be made. To characterize the sclerostin–BMD rela-tionship, a future longitudinal study may be needed. Sec-ond, our sample was relatively small and thus its statistical power may not have been sufficient for detect-ing potential confounddetect-ing factors affectdetect-ing sclerostin levels. Third, the biological variation in the serum levels of sclerostin and other bone-related biomarkers may cause some bias in a single measurement for each pa-tient. Fourth, only lumbar spine BMD was measured and the correlation between sclerostin and BMD at other sites in PD patients was not investigated. In addition, we did not obtain information on the physical activities, which could be BMD determinants; however, dialysis patients are typically thought to have relatively low weight-bearing activities. Fifth, we did not collect peritoneal dialysate for sclerostin measurement and thus whether the clearance of sclerostin through peritoneal dialysate potentially interfered with our final result re-mains unclear. Nevertheless, the total Kt/V for urea in our patients, as a surrogate of sclerostin clearance through peritoneal dialysate, demonstrated no major ef-fects for sclerostin in our analysis. Finally, sclerostin levels are considerably influenced by the assay used; our findings would not be immediately relevant if a different assay were adopted.
Conclusions
This is the first study demonstrating that serum scleros-tin is significantly correlated with BMD in PD patients. The BMD of vertebrae was positively associated with sclerostin levels even after adjustment for multiple fac-tors. The results add substantial evidence to the whole picture of CKD–MBD by connecting sclerostin to bone changes in the CKD–MBD spectrum. However, the de-tailed effects of sclerostin from the skeletal to vascular sides of the CKD–MBD spectrum remain unclear. Thus, future longitudinal studies elucidating the role of scler-ostin in PD patients with CKD–MBD are warranted.
Abbreviations
ALP:Alkaline phosphatase; ALT: Alanine transaminase; AST: Aspartate transaminase; BMD: Bone mineral density; CKD: Chronic kidney disease; CKD– MBD: Chronic kidney disease–mineral and bone disorder; CTX: Crosslinked C-telopeptide of type 1 collagen; DKK-1: Dickkopf-1; ELISA: Enzyme-linked immunosorbent assay; FGF-23: Fibroblast growth factor 23; HD: Hemodialysis; HDL: High-density lipoprotein cholesterol; hsCRP: High-sensitivity C-reactive protein; IQR: Interquartile range; LDL: Low-density lipoprotein cholesterol; LRP: Low-density lipoprotein receptor-related protein; OR: Odds ratio; PD: Peritoneal dialysis; PTH: Parathyroid hormone; SD: Standard deviation; Wnt: Wingless-type mouse mammary tumor virus integration site
Acknowledgments
The authors thank Ms. Yen-Hsiu Ko for her assistance in ELISA.
Authors’contributions
HHL and MCW designed and directed the project. THK, ABW, CCT, and YTC carried out data collection. THK, WHL, JYC, HHL, and MCW participated in data analysis. THK, HHL, and MCW wrote the manuscript. All authors discussed the results and approved the manuscript as submitted. All authors agree to be accountable for the work and to ensure that questions related to the accuracy or integrity of the work are appropriately investigated and resolved.
Funding
This research was supported by the grants from National Cheng Kung University Hospital, College of Medicine, National Cheng Kung University, Tainan, Taiwan (grant numbers: NCKUH-10406030, NCKUH-10505030, and NCKUH-10704006). The funder had no role in study design, conduct of the study, decision to publish, or preparation of the manuscript.
Availability of data and materials
All data supporting the study are presented in the manuscript and available on a request to either of the corresponding authors of this manuscript, Ming-Cheng Wang.
or Hung-Hsiang Liou.
Ethics approval and consent to participate
All procedures performed in the study involving human participants were in accordance with the Ethics of Clinical Research, Declaration of Helsinki. This research protocol was approved by the Institutional Review Board, National Cheng Kung University Hospital (approval number: B-ER-103-279). Written in-formed consent was obtained from each participant.
Consent for publication
Not applicable.
Competing interests
The authors declare that they have no competing interests.
Author details
1Division of Nephrology, Department of Internal Medicine, National Cheng Kung University Hospital, College of Medicine, National Cheng Kung University, 138 Shengli Rd., North Dist, Tainan 704, Taiwan.2Department and Graduate Institute of Public Health, College of Medicine, National Cheng Kung University, Tainan, Taiwan.3Department of Internal Medicine, National Cheng Kung University Hospital, College of Medicine, National Cheng Kung University, Tainan, Taiwan.4Institute of Clinical Pharmacy and Pharmaceutical Sciences, College of Medicine, National Cheng Kung University, Tainan, Taiwan.5Division of Nephrology, Department of Internal Medicine, Hsin-Jen Hospital, 395 Zhongzheng Rd., Xinzhuang Dist, New Taipei City 242, Taiwan.
Received: 18 December 2018 Accepted: 3 July 2019
References
2. Rix M, Andreassen H, Eskildsen P, Langdahl B, Olgaard K. Bone mineral density and biochemical markers of bone turnover in patients with predialysis chronic renal failure. Kidney Int. 1999;56:1084–93.
3. Coco M, Rush H. Increased incidence of hip fractures in dialysis patients with low serum parathyroid hormone. Am J Kidney Dis. 2000;36:1115–21. 4. Cunningham J, Sprague SM, Cannata-Andia J, Coco M, Cohen-Solal M,
Fitzpatrick L, Goltzmann D, Lafage-Proust MH, Leonard M, Ott S, et al. Osteoporosis in chronic kidney disease. Am J Kidney Dis. 2004;43:566–71. 5. Krishnan V, Bryant HU, Macdougald OA. Regulation of bone mass by Wnt
signaling. J Clin Invest. 2006;116:1202–9.
6. Clevers H. Wnt/beta-catenin signaling in development and disease. Cell. 2006;127:469–80.
7. Johnson ML, Kamel MA. The Wnt signaling pathway and bone metabolism. Curr Opin Rheumatol. 2007;19:376–82.
8. Cejka D, Herberth J, Branscum AJ, Fardo DW, Monier-Faugere MC, Diarra D, Haas M, Malluche HH. Sclerostin and Dickkopf-1 in renal osteodystrophy. Clin J Am Soc Nephrol. 2011;6:877–82.
9. Baron R, Kneissel M. WNT signaling in bone homeostasis and disease: from human mutations to treatments. Nat Med. 2013;19:179–92.
10. Ardawi MS, Al-Kadi HA, Rouzi AA, Qari MH. Determinants of serum sclerostin in healthy pre- and postmenopausal women. J Bone Miner Res. 2011;26:2812–22.
11. Modder UI, Hoey KA, Amin S, McCready LK, Achenbach SJ, Riggs BL, Melton LJ 3rd, Khosla S. Relation of age, gender, and bone mass to circulating sclerostin levels in women and men. J Bone Miner Res. 2011;26:373–9. 12. Martin A, Rozas-Moreno P, Reyes-Garcia R, Morales-Santana S,
Garcia-Fontana B, Garcia-Salcedo JA, Munoz-Torres M. Circulating levels of sclerostin are increased in patients with type 2 diabetes mellitus. J Clin Endocrinol Metab. 2012;97:234–41.
13. Polyzos SA, Anastasilakis AD, Bratengeier C, Woloszczuk W, Papatheodorou A, Terpos E. Serum sclerostin levels positively correlate with lumbar spinal bone mineral density in postmenopausal women--the six-month effect of risedronate and teriparatide. Osteoporos Int. 2012;23:1171–6.
14. van Lierop AH, Witteveen JE, Hamdy NA, Papapoulos SE. Patients with primary hyperparathyroidism have lower circulating sclerostin levels than euparathyroid controls. Eur J Endocrinol. 2010;163:833–7.
15. Jadoul M, Albert JM, Akiba T, Akizawa T, Arab L, Bragg-Gresham JL, Mason N, Prutz KG, Young EW, Pisoni RL. Incidence and risk factors for hip or other bone fractures among hemodialysis patients in the Dialysis outcomes and practice patterns study. Kidney Int. 2006;70:1358–66.
16. Bucur RC, Panjwani DD, Turner L, Rader T, West SL, Jamal SA. Low bone mineral density and fractures in stages 3-5 CKD: an updated systematic review and meta-analysis. Osteoporos Int. 2015;26:449–58.
17. Ketteler M, Block GA, Evenepoel P, Fukagawa M, Herzog CA, McCann L, Moe SM, Shroff R, Tonelli MA, Toussaint ND, et al. Executive summary of the 2017 KDIGO chronic kidney disease-mineral and bone disorder (CKD-MBD) guideline update: what's changed and why it matters. Kidney Int. 2017;92:26–36.
18. Pelletier S, Dubourg L, Carlier MC, Hadj-Aissa A, Fouque D. The relation between renal function and serum sclerostin in adult patients with CKD. Clin J Am Soc Nephrol. 2013;8:819–23.
19. Kanbay M, Siriopol D, Saglam M, Kurt YG, Gok M, Cetinkaya H, Karaman M, Unal HU, Oguz Y, Sari S, et al. Serum sclerostin and adverse outcomes in nondialyzed chronic kidney disease patients. J Clin Endocrinol Metab. 2014; 99:E1854–61.
20. Kazama JJ, Matsuo K, Iwasaki Y, Fukagawa M. Chronic kidney disease and bone metabolism. J Bone Miner Metab. 2015;33:245–52.
21. Cejka D, Jager-Lansky A, Kieweg H, Weber M, Bieglmayer C, Haider DG, Diarra D, Patsch JM, Kainberger F, Bohle B, et al. Sclerostin serum levels correlate positively with bone mineral density and microarchitecture in haemodialysis patients. Nephrol Dial Transplant. 2012;27:226–30. 22. Pelletier S, Confavreux CB, Haesebaert J, Guebre-Egziabher F, Bacchetta J,
Carlier MC, Chardon L, Laville M, Chapurlat R, London GM, et al. Serum sclerostin: the missing link in the bone-vessel cross-talk in hemodialysis patients? Osteoporos Int. 2015;26:2165–74.
23. Lee H, Hwang YH, Jung JY, Na KY, Kim HS, Son MJ, Park JY, Cho EJ, Ahn C, Oh KH. Comparison of vascular calcification scoring systems using plain radiographs to predict vascular stiffness in peritoneal dialysis patients. Nephrology (Carlton). 2011;16:656–62.
24. Ottenbacher KJ, Ottenbacher HR, Tooth L, Ostir GV. A review of two journals found that articles using multivariable logistic regression
frequently did not report commonly recommended assumptions. J Clin Epidemiol. 2004;57:1147–52.
25. Hampson G, Edwards S, Conroy S, Blake GM, Fogelman I, Frost ML. The relationship between inhibitors of the Wnt signalling pathway (Dickkopf-1(DKK1) and sclerostin), bone mineral density, vascular calcification and arterial stiffness in post-menopausal women. Bone. 2013;56:42–7. 26. Garnero P, Sornay-Rendu E, Munoz F, Borel O, Chapurlat RD. Association of
serum sclerostin with bone mineral density, bone turnover, steroid and parathyroid hormones, and fracture risk in postmenopausal women: the OFELY study. Osteoporos Int. 2013;24:489–94.
27. Lim Y, Kim CH, Lee SY, Kim H, Ahn SH, Lee SH, Koh JM, Rhee Y, Baek KH, Min YK, et al. Decreased plasma levels of Sclerostin but not Dickkopf-1 are associated with an increased prevalence of osteoporotic fracture and lower bone mineral density in postmenopausal Korean women. Calcif Tissue Int. 2016;99:350–9.
28. Thambiah S, Roplekar R, Manghat P, Fogelman I, Fraser WD, Goldsmith D, Hampson G. Circulating sclerostin and Dickkopf-1 (DKK1) in predialysis chronic kidney disease (CKD): relationship with bone density and arterial stiffness. Calcif Tissue Int. 2012;90:473–80.
29. Ishimura E, Okuno S, Ichii M, Norimine K, Yamakawa T, Shoji S, Nishizawa Y, Inaba M. Relationship between serum sclerostin, bone metabolism markers, and bone mineral density in maintenance hemodialysis patients. J Clin Endocrinol Metab. 2014;99:4315–20.
30. Cosman F, Crittenden DB, Adachi JD, Binkley N, Czerwinski E, Ferrari S, Hofbauer LC, Lau E, Lewiecki EM, Miyauchi A, et al. Romosozumab treatment in postmenopausal women with osteoporosis. N Engl J Med. 2016;375:1532–43.
31. Ardawi MS, Rouzi AA, Qari MH. Physical activity in relation to serum sclerostin, insulin-like growth factor-1, and bone turnover markers in healthy premenopausal women: a cross-sectional and a longitudinal study. J Clin Endocrinol Metab. 2012;97:3691–9.
32. Spatz JM, Fields EE, Yu EW, Divieti Pajevic P, Bouxsein ML, Sibonga JD, Zwart SR, Smith SM. Serum sclerostin increases in healthy adult men during bed rest. J Clin Endocrinol Metab. 2012;97:E1736–40.
33. Viaene L, Behets GJ, Claes K, Meijers B, Blocki F, Brandenburg V, Evenepoel P, D'Haese PC. Sclerostin: another bone-related protein related to all-cause mortality in haemodialysis? Nephrol Dial Transplant. 2013;28:3024–30. 34. Yamada S, Tsuruya K, Tokumoto M, Yoshida H, Ooboshi H, Kitazono T. Factors associated with serum soluble inhibitors of Wnt-beta-catenin signaling (sclerostin and dickkopf-1) in patients undergoing peritoneal dialysis. Nephrology (Carlton). 2015;20:639–45.
35. Mirza FS, Padhi ID, Raisz LG, Lorenzo JA. Serum sclerostin levels negatively correlate with parathyroid hormone levels and free estrogen index in postmenopausal women. J Clin Endocrinol Metab. 2010;95:1991–7. 36. Jin S, Zhu M, Yan J, Fang Y, Lu R, Zhang W, Zhang Q, Lu J, Qi C, Shao X, et
al. Serum sclerostin level might be a potential biomarker for arterial stiffness in prevalent hemodialysis patients. Biomark Med. 2016;10:689–99. 37. Hsu BG, Liou HH, Lee CJ, Chen YC, Ho GJ, Lee MC. Serum Sclerostin as an
independent marker of peripheral arterial stiffness in renal transplantation recipients: a cross-sectional study. Medicine (Baltimore). 2016;95:e3300. 38. Wang N, Xue P, Wu X, Ma J, Wang Y, Li Y. Role of sclerostin and dkk1 in
bone remodeling in type 2 diabetic patients. Endocr Res. 2018;43:29–38. 39. Gifre L, Ruiz-Gaspa S, Monegal A, Nomdedeu B, Filella X, Guanabens N,
Peris P. Effect of glucocorticoid treatment on Wnt signalling antagonists (sclerostin and Dkk-1) and their relationship with bone turnover. Bone. 2013;57:272–6.
40. Balemans W, Piters E, Cleiren E, Ai M, Van Wesenbeeck L, Warman ML, Van Hul W. The binding between sclerostin and LRP5 is altered by DKK1 and by high-bone mass LRP5 mutations. Calcif Tissue Int. 2008;82:445–53. 41. Florio M, Gunasekaran K, Stolina M, Li X, Liu L, Tipton B, Salimi-Moosavi
H, Asuncion FJ, Li C, Sun B, et al. A bispecific antibody targeting sclerostin and DKK-1 promotes bone mass accrual and fracture repair. Nat Commun. 2016;7:11505.
42. Isakova T, Cai X, Lee J, Katz R, Cauley JA, Fried LF, Hoofnagle AN, Satterfield S, Harris TB, Shlipak MG, et al. Associations of FGF23 with change in bone mineral density and fracture risk in older individuals. J Bone Miner Res. 2016;31:742–8.
44. Imel EA, Liu Z, McQueen AK, Acton D, Acton A, Padgett LR, Peacock M, Econs MJ. Serum fibroblast growth factor 23, serum iron and bone mineral density in premenopausal women. Bone. 2016;86:98–105.
45. Desjardins L, Liabeuf S, Renard C, Lenglet A, Lemke HD, Choukroun G, Drueke TB, Massy ZA. FGF23 is independently associated with vascular calcification but not bone mineral density in patients at various CKD stages. Osteoporos Int. 2012;23:2017–25.
46. Urena Torres P, Friedlander G, de Vernejoul MC, Silve C, Prie D. Bone mass does not correlate with the serum fibroblast growth factor 23 in hemodialysis patients. Kidney Int. 2008;73:102–7.
47. Hlaing TT, Compston JE. Biochemical markers of bone turnover - uses and limitations. Ann Clin Biochem. 2014;51:189–202.
48. Okuno S, Inaba M, Kitatani K, Ishimura E, Yamakawa T, Nishizawa Y. Serum levels of C-terminal telopeptide of type I collagen: a useful new marker of cortical bone loss in hemodialysis patients. Osteoporos Int. 2005;16:501–9. 49. Negri AL, Barone R, Quiroga MA, Bravo M, Marino A, Fradinger E, Bogado
CE, Zanchetta JR. Bone mineral density: serum markers of bone turnover and their relationships in peritoneal dialysis. Perit Dial Int. 2004;24:163–8. 50. Reichel H, Roth HJ, Schmidt-Gayk H. Evaluation of serum
beta-carboxy-terminal cross-linking telopeptide of type I collagen as marker of bone resorption in chronic hemodialysis patients. Nephron Clinical practice. 2004;98:c112–8.
51. Tsuchida T, Ishimura E, Miki T, Matsumoto N, Naka H, Jono S, Inaba M, Nishizawa Y. The clinical significance of serum osteocalcin and N-terminal propeptide of type I collagen in predialysis patients with chronic renal failure. Osteoporos Int. 2005;16:172–9.
52. Hamano T, Tomida K, Mikami S, Matsui I, Fujii N, Imai E, Rakugi H, Isaka Y. Usefulness of bone resorption markers in hemodialysis patients. Bone. 2009; 45(Suppl 1):S19–25.
53. Drinka PJ, DeSmet AA, Bauwens SF, Rogot A. The effect of overlying calcification on lumbar bone densitometry. Calcif Tissue Int. 1992;50:507–10. 54. Cherney DD, Laymon MS, McNitt A, Yuly S. A study on the influence of
calcified intervertebral disk and aorta in determining bone mineral density. J Clin Densitom. 2002;5:193–8.
55. Toussaint ND, Lau KK, Strauss BJ, Polkinghorne KR, Kerr PG. Associations between vascular calcification, arterial stiffness and bone mineral density in chronic kidney disease. Nephrol Dial Transplant. 2008;23:586–93. 56. Nanjo Y, Morio Y, Nagashima H, Hagino H, Teshima R. Correlation between
bone mineral density and intervertebral disk degeneration in pre- and postmenopausal women. J Bone Miner Metab. 2003;21:22–7.
57. Delanaye P, Paquot F, Bouquegneau A, Blocki F, Krzesinski JM, Evenepoel P, Pottel H, Cavalier E. Sclerostin and chronic kidney disease: the assay impacts what we (thought to) know. Nephrol Dial Transplant. 2018;33:1404–10.
Publisher’s Note