R E S E A R C H
Open Access
Fully automatic algorithm for the analysis of vessels
in the angiographic image of the eye fundus
Robert Koprowski
1*, S
ł
awomir Jan Teper
2, Beata W
ę
glarz
2, Edward Wyl
ę
ga
ł
a
2, Micha
ł
Krejca
3and Zygmunt Wróbel
1* Correspondence:robert. [email protected] 1Department of Computer Biomedical Systems, Institute of Computer Science, University of Silesia, ul. Będzińska 39, 41-200, Sosnowiec, Poland
Full list of author information is available at the end of the article
Abstract
Background:The available scientific literature contains descriptions of manual, semi-automated and semi-automated methods for analysing angiographic images. The
presented algorithms segment vessels calculating their tortuosity or number in a given area. We describe a statistical analysis of the inclination of the vessels in the fundus as related to their distance from the center of the optic disc.
Methods:The paper presents an automated method for analysing vessels which are found in angiographic images of the eye using a Matlab implemented algorithm. It performs filtration and convolution operations with suggested masks. The result is an image containing information on the location of vessels and their inclination angle in relation to the center of the optic disc. This is a new approach to the analysis of vessels whose usefulness has been confirmed in the diagnosis of hypertension. Results:The proposed algorithm analyzed and processed the images of the eye fundus using a classifier in the form of decision trees. It enabled the proper classification of healthy patients and those with hypertension. The result is a very good separation of healthy subjects from the hypertensive ones: sensitivity - 83%, specificity - 100%, accuracy - 96%. This confirms a practical usefulness of the proposed method.
Conclusions:This paper presents an algorithm for the automatic analysis of morphological parameters of the fundus vessels. Such an analysis is performed during fluorescein angiography of the eye. The presented algorithm automatically calculates the global statistical features connected with both tortuosity of vessels and their total area or their number.
Keywords:Image processing, Angiographic image, Fully automatic algorithm
Background
The available literature contains descriptions of manual, semi-automated and auto-mated methods for analyzing angiographic images. The presented algorithms often refer to other visualization methods [1]. They segment vessels, calculate their tortuosity or number in a given area. The accompanying changes in the analyzed area of the eye fundus are also colour-coded [2], or analyzed locally (analyzed in a declared area) [3]. The local analysis of both the width of arterioles as well as the number of intersections between them is described in several papers [1,4-7]. What is usually measured is the number of intersections (decussations) of vessels, their tortuosity and diameter. It is done by, for example, IVAN software [8]. The measurement range is usually placed within the optic disc radius r - and ranges from 2r to 3r. The measurements of both
tortuosity and meane diameter of arterioles in this range lead to reliable results. A good example is the Blue Mountain Eye Study which showed that the diameter of retinal arterioles and venules was decreasing with age regardless of other factors [9,10]. On the other hand, in the Beaver Dam Study, it was observed that hypertension was the cause of retinal arteriolar narrowing. However, this phenomenon turned out to be less pro-nounced in older patients [11]. This fact proves inadequate vascular response to hyper-tension in this population, which may be caused by atherosclerosis or increased vascular wall stiffness.
There exists a large number of papers connected with the analysis and processing of the eye fundus images. The methods of image analysis and processing described in them are profiled to enhance segmentation of vessels. In papers [12-16], the authors perform skeletonization of blood vessels and then present its successive approximation in ac-cordance with the adopted algorithm. This method is extremely time-consuming be-cause it requires the use of sophisticated techniques for the initial stage of image analysis and processing, and is also connected with a morphological operation (skeleto-nization) and approximation. For example, paper [12] presents a method for assessing tortuosity of vessels by their subsequent division into smaller and smaller segments. In-dividual vessels can also be compared with a pattern, as it was done in paper [15]. Here the authors used a pattern in the form of a sine wave with variable amplitude in order to assess vascular tortuosity. Another method for obtaining correct results of segmenta-tion is tracking the vessel outline which is described in papers [14,17]. In paper [18], the authors describe the problems and methodology of measurements performed on images of the eye fundus and based on segmentation of vessels. In paper [19], the authors compare the results obtained from colour fundus photographs (FPs) and fluor-escein angiographs (FAs). In both cases, however, the methods of image analysis refer to segmentation of vessels. Generally, the obtained results are compared with assessments of an expert whose task is to verify them - in paper [20], e.g., there are three experts. They are not always profiled algorithms for the analysis of just this type of images. Sometimes they are supported by additional software such as, for example, Paint-Shop Pro (Jasc Software) used in paper [21].
Regardless of the results, the presented methods of measuring the characteristics (diameter of the veins and arteries, the tortuosity and the number of intersections) are based on the repetitive course of the following proceedings:
segmentation of veins and arteries as separate objects,
calculation of average values of tortuosity or diameter of veins or arteries in a declared area.
together with the adventitia. The vessel lumen diameter better reflects the functional state of the vessel and directly influences the flow. The downside is the lack of a fully automatic distinction between arterioles and venules.
We describe a method of statistical analysis of the inclination of the vessels in the fundus related to their distance from the center of the optic disc. This method, however, differs from the classical methods published in [4,6,23]. Only the fractal analysis [24,25] is similar to the approach presented in this article. However, this similarity concerns only the global approach to the analysis.
The algorithm created by the authors should have the following characteristics:
fully automatic image analysis - without operator intervention - even in the batch mode, analysis of angiographic images of the eye fundus at any resolution, both spatial resolution (pixels per inch) and pixel depth (bits per pixel),
automatic, statistical analysis of the diameter of vessels and their degree of tortuosity, automatic calculation of full statistics like:
average gradient of all vessels at any distance from the optic disc,
average volume occupied by all vessels at any distance from the optic disc,
automatic analysis of a group of images (for consecutive patients or for the same patient, but between successive tests): an average measure, STD, median or an average value of changes in thickness of vessels,
auto-save to disk of the received data and images.
The proposed algorithm was tested on a group of patients described below.
Materials
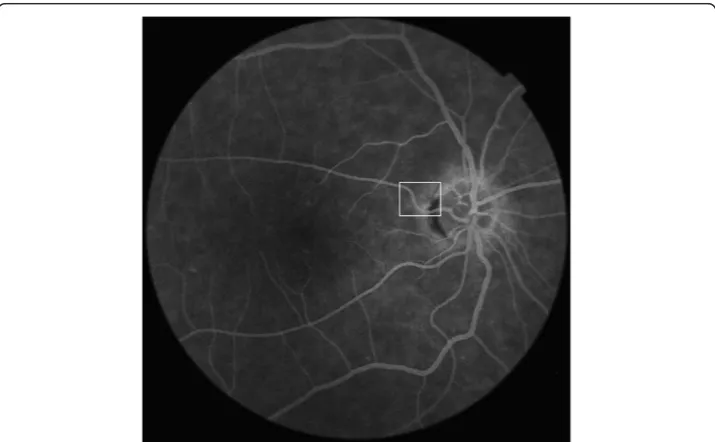
In order to verify the assumptions and correctness of the choice of the afore-mentioned image features, sample tests on patients have been performed. For this purpose, 12 healthy subjects and 40 patients with hypertension have been examined. They were aged 22 to 87 with a body weight between 53 to 92kg. Some of them were healthy and the others suffered from hypertension which was cardiologically stated. The Topcon funduscamera was used in the study. The camera is made by Zeiss and has angular width of 45 degrees and spatial reso-lution of 2136x3216 pixels. Fluorescein angiography was performed in a conventional way, and the images of the transit phase were analyzed as they best reflect the size of the vessel lumen. The patients agreed consciously to participate in the study which was conducted in accordance with the principles of the Declaration of Helsinki.
The algorithm suggested by the authors and the results of the analysis for the exam-ined patients are described below.
Method
Preprocessing
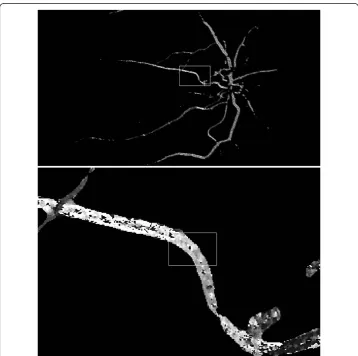
LGRAYangiographic image in DICOM format with a resolution MxN = 2136x3216 pixels is filtered with a median filter whose mask size is h1, Mh1xNh1= 3x3. The aim is to elim-inate the noise. The mask size was chosen arbitrarily taking into consideration the mini-mum size of objects and optimization of the operation time. For the adopted size of the mask and the image resolution of 8 bits per pixel, the filtration time was 100ms. This part of the algorithm was implemented in the C language and Matlab for a PC with an Intel Xenon processor [email protected], 12GB RAM. LGRAYimage after filtration with a median filter LMEDundergoes successive stages of processing.
Algorithm
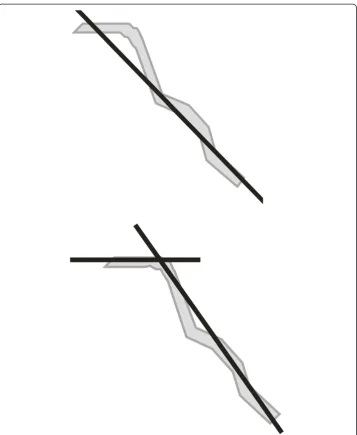
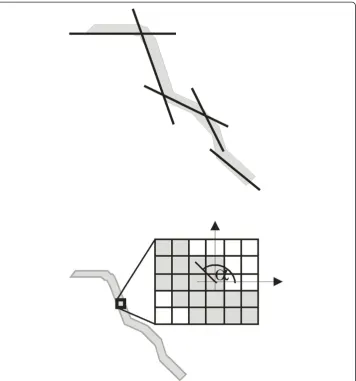
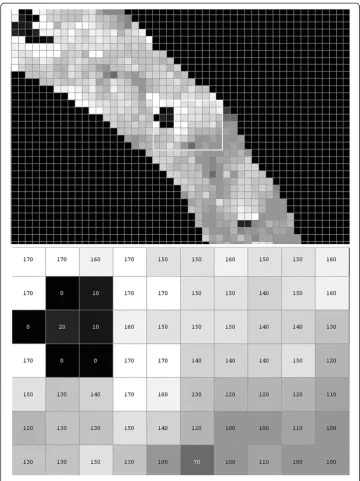
As outlined in the introduction, it is necessary to develop an algorithm that analyzes the inclination of vessels automatically. Finding the inclination angle will enable to calculate full statistics related to the assessment of the vessel width or its tortuosity. Vessels will be analyzed in such a way that their shape will be approximated, depending on the accuracy. It will be done by one straight line (k = 1), two straight lines (k = 2), a few straight lines or by replacing each image pixel with a value of the tangent inclin-ation angleαat a given point–as shown in Figure 1, Figure 2, respectively.
A method of this type (shown in Figure 1, Figure 2) allows for arbitrarily accurate ap-proximation of the inclination angle (for the values k = 1,2,3 etc. up to the angle values α). By the same token, it enables to calculate the width of the vessel at a given point.
The method shown in Figure 2 shows the greatest accuracy but also the largest com-putational complexity. Thus, it will be still used. The set of values of the inclination angle αcreates an inclination field, hereinafter referred to as Lα. It allows for an auto-mated analysis of vessels width which is done as accurately as possible with the level of the resolution error ±1bit.
Our proposed method of calculation of the matrix Lαuses convolution with a mask
h2created from the Gaussian function [26-28], i.e.
h2ðmh2;σ;Emi;θ¼0Þ ¼
1 1 . . . 1 2 6 6 4 3 7 7 5 |{z} nh2
ðEmaEmiÞ þEmi exp mh2
2
2σ2
ð1Þ
where:
Ema,Emi–the maximum and minimum values of the mask h2, θ–the inclination angle of the mask h2,
mh2,nh2–the coordinates of individual values in the mask h2, σ–standard deviations of an average.
For example, for Emi= -2 andEma= 4, σ= 1 and θ= 0°, and a resolution of 29x19, the values in the mask obtained are the ones shown in Figure 3.
obtained for convolution Lh, the maximum value Lma and the angle for which it oc-curred are stored, i.e.:
Lhðm;n;θÞ¼
X
Mh2=2
mh2¼Mh2=2
X
Mh2=2
nh2¼Nh2=2
LMEDðmþmh2;nþnh2Þh2ðmh2;σ;Ema;Emi;θÞ ð2Þ
Lmaðm;nÞ¼ max
θEð0;179ÞðLhðm;n;θÞÞ ð3Þ
where:
m, n–the coordinate - row and column of the matrix of the input image - in this case LMED(Figure 4).
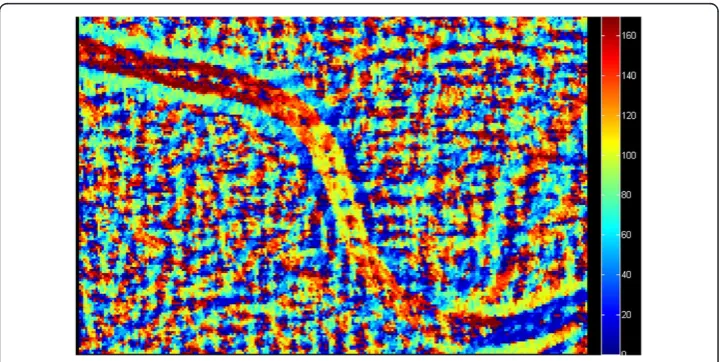
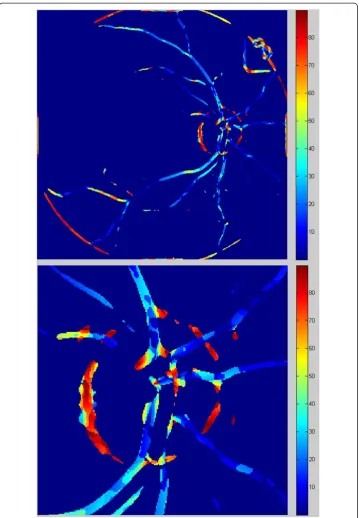
Consequently, we get two matrices Lmaand Lθ(shown in Figure 5, Figure 6). The first
one contains information about the "degree of match" of the mask h2 to the analyzed part of the image LMED. The latter one shows for which mask h2 (ie, for which angle value θ), the match occurred. The combination of these two matrices (Lma and Lθ) enables to create an image Lwwhich contains information about the location of pixels that constitute a vessel as well as the tangent inclination angle at a given point, i.e.:
Lwðm;nÞ ¼ Lθðm0;nÞ ifif LLmaðm;nÞ>pr maðm;nÞ≤pr
ð4Þ
where:
pr–decimal-to-binary conversion threshold.
The value of the threshold pr is selected automatically on the basis of the results obtained from Nobuyuki Otsu’s method [29]. The resulting image is shown in Figure 7 and its subsequent zooms in Figure 8, in which the value of the angleθis visible.
The pixel values in the image Lwshould be corrected accordingly. Owing to this correc-tion, it is possible to modify the angular values in such a way that they indicate the inclin-ation angle with respect to a circular coordinate system, whose center is located in the center of the optic disc. The angular values (in the range of 0 to 90°) obtained in this way are reliable in relation to the assessment of tortuosity of segmented vessels. A part of the image Lw,before and after correction Lk,is shown in Figure 9 and Figure 10.
Figure 3Mask h2obtained foremi= -2 andema= 4,σ= 1 andθ= 0°.This mask is applied to the basic operation of convolution with the input image. The shape of this mask substantially affects the accuracy and operations speed of the algorithm. The mask size depends on the image resolution and on the vessels width range.
The image Lk represents the final form of the image of the algorithm for image ana-lysis and processing. One of the possible applications of the presented algorithm, that is the measurements made in the image Lk, is presented in next section.
Results
The algorithm presented in the previous chapter is profiled for automatic analysis of the width of vessels. The analysis is made for each pixel of the image, with an accuracy described by the relation (1) (for the angular values with a resolution of one degree). The use of this automated method of analysis of data obtained in the image Lkwill be suggested below.
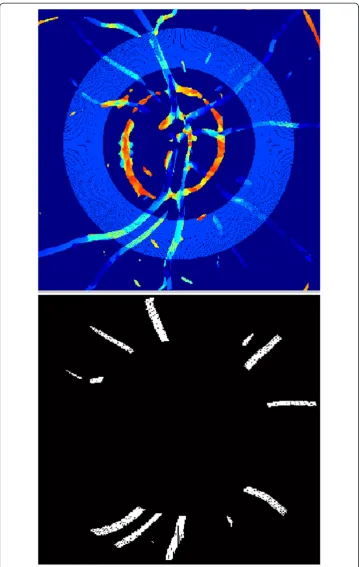
Assuming that the radius of the optic disc is known (referred to as r), we can desig-nate a circular band whose diameter is in the range of 2r to 3r (Figure 11). This range has been proposed in IVAN software [8] and is commonly used in the calculation of
Figure 5Fragment of image Lma.Bright values of pixels indicate a good detection of the object.The visible bright area will also be the basis for vessels segmentation. Together with the image from Figure 6 it will be the basis for further analyses. The degree of objects brightness will decide, whether they will be considered in further calculations.
changes in diameter of arteries and veins, which enables to assess the coexistence of those changes with the progression of vascular disease.
The presented analysis applies to:
– fully automatic measurement without any operator intervention,
– measurement of the number of vessels in a declared area further on denoted as z, – the average angular value for individual objects in the image Lk–further on
denoted asφsr,
– standard deviation of mean angular values in the image Lk- further on denoted asφSTD,
– calculation of the maximum value of the angle in the image Lk- further on denoted
asφmax,
– calculation of the percentage of the ratio of vessels surface area in relation to the measured area (calculated as the ratio of the total number of pixels that make up the vessels in the measured area to the total number of pixels of the area)–denoted as ps,
– designation of histogram of pixel inclination of objects.
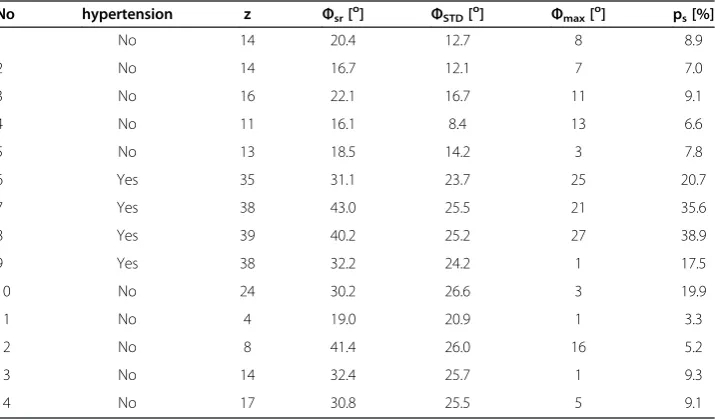
The results obtained for the test group (for healthy people and those with arterial hypertension) are given in Table 1.
Analyzing these results, we can, for example, read them for measurement no. 4. This is a patient without hypertension for whom 11 separated objects have been detected automatically in the area 2r to 3r. Their average angle of inclination with respect to the axis was 16.1°. In addition, most pixels of objects were found for a 13° angle. All the detected pixels of objects constituted 6.6% of the total measured area (2r to 3r).
In terms of diagnosis of hypertension, there is another interesting histogram which relates to changes in the values of the angle ϕ. The histogram presented in Figure 12
shows that the maximum is for the angle ϕ=6°, for which there were 240 pixels in total making up the vessels. Sloping nature of the envelope of the histogram is evidence of a small number of pixels with the value of the angleϕmuch exceeding 40°. It means that the vessels radiate from the center of the optic disc. Any angular error of unevenness is in the range of 10 to 40° and affects less than half of the pixels.
A group of 52 patients (including 40 healthy and 12 hypertensive ones) was divided in equal proportions into learning, validation and test group). Then, the cross-validation method was used, with particular reference to the ratio between the decision classes (stratified cross-validation). A classifier in the form of a decision tree was implemented,
assuming five attributes: the angle for the maximum number of pixels - ϕmax, standard deviation of the angle average ϕSTD, the average value of the angle -ϕsr, the number of vessels in a declared area –z, and the percentage of the ratio of vessels surface area to the measured area - ps. It was recognized that these attributes are equally privileged. On this basis, six decision trees were constructed; five trees for each of the attributes occurring independently and one for all of them together.
In all cases, a non-parametrical algorithm CART (Classification and Regression Trees) creating binary trees is used as the method for their induction. An increase in the nodes purity has been used as the criterion for assessing the quality of CART divisions. The Gini index has been used as the measure of nodes impurity. Because of a small number of cases, the tree creation was not limited by a minimum number of vectors in a node. Then, to prevent excessive fitting to the data, the created tree is pruned to the Table 1 Fragment of results of automated measurement of morphometric parameters of vessels
No hypertension z Φsr[o] ΦSTD[o] Φmax[o] ps[%]
1 No 14 20.4 12.7 8 8.9
2 No 14 16.7 12.1 7 7.0
3 No 16 22.1 16.7 11 9.1
4 No 11 16.1 8.4 13 6.6
5 No 13 18.5 14.2 3 7.8
6 Yes 35 31.1 23.7 25 20.7
7 Yes 38 43.0 25.5 21 35.6
8 Yes 39 40.2 25.2 27 38.9
9 Yes 38 32.2 24.2 1 17.5
10 No 24 30.2 26.6 3 19.9
11 No 4 19.0 20.9 1 3.3
12 No 8 41.4 26.0 16 5.2
13 No 14 32.4 25.7 1 9.3
14 No 17 30.8 25.5 5 9.1
Figure 12Histogram of marked analysis area from 2r to 3r.From the histogramϕmax= 6° for 240 pixels
maximum extent. At the first stage, the resubstitution error for various subsets of the original tree has been calculated. Then the cross-validation error for these sub-trees has been calculated. The cut-off value was set at the minimum cost (misclassification error) plus one standard error. The best level has been determined as the smallest tree below this cut-off. After pruning trees (to avoid over-fitting), the following results were obtained (true positive-TP, true negative - TN, false negative –FN and false positive-FP), i.e.:
z TP¼12; TN¼37; FN¼0 and 0:5emFP¼3;
ϕSR TP¼12; TN¼36; FN¼0 and 0:5emFP¼4; ϕSTD TP¼9; TN¼40; FN¼3 and 0:5emFP¼0; ϕmax TP¼10; TN¼40; FN¼2 and 0:5emFP¼0;
ps TP¼12; TN¼37; FN¼0 and 0:5emFP¼3;
z;ϕSR;ϕSTD; ϕmax; ps TP¼10; TN¼40; FN¼2 and 0:5emFP¼0:
For each of six trees created, the resultant values of accuracy have been calculated, ACC = (TP + TN)/(TP + TN + FP + FN), i.e.: z- 0.94, ϕSR- 0.92, ϕSTD- 0.94, ϕmax- 0.96, ps- 0.94 and z,ϕSR, ϕSTD, ϕmax, ps- 0.96. The ACC value was minimal for two pruned trees created on the basis of featureϕmaxonly and of all z,ϕSR,ϕSTD,ϕmaxand ps.The tree, whose construction requires only one featureϕmax, was chosen from these two de-cision trees. Therefore, this tree was classified as the best. In addition, after pruning, the tree constructed for z, ϕSR, ϕSTD, ϕmax, ps has only one node with the same attribute ϕmax – which confirms its proper selection (Figure 13). For this tree (created on the basis of the attribute ϕmax), the following indicators are obtained: sensitivity or true positive rate TPR = TP/(TP + FN) = 0.83, false positive rate FPR = FP/(FP + TN) = 0, ac-curacy ACC = (TP + TN)/(TP + TN + FP + FN) = 0.96, specificity SPC = TN/(FP + TN) = 1, positive predictive value PPV = TP/(TP + FP) = 1, negative predictive value NPV = TN/ (TN + FN) =0.95, false discovery rate FDR = FP/(FP + TP) = 0. Therefore, when analyzing the results obtained from the created decision tree, the average value ofϕmaxis 6.8±5.1° for patients without hypertension and 24.3±3° for patients with hypertension. While treating the two cases, FN = 2, as thick errors, the result obtained for all patients with hypertension is 21.6±7.6°. Calculations were made for the cut off marked from a deci-sion tree whose ϕmax= 18.5°. With a confidence level of 0.001, the critical value of Student-t distribution for a group of healthy subjects (39 degrees of freedom) is 3.55, for patients with hypertension (11 degrees of freedom) - 4.43. For the latter group, the bottom end of the confidence interval is 21.6 - 4.43 * 7.6/√ 12 = 14.5, whereas the top one is 6.8 - 3.55 * 5.1/√ 40 = 9.66. Both bands have no elements in common - they are well separated. Thus, it can be said, with probability equal to 99.9%, that the value of the angle ϕmax is reliable in the assessment of hypertension. However, there are two things which should be borne in mind, namely a relatively small number of subjects with hypertension and a number of cases of false positives equal to 2, which constitutes (FN/TP * 100) 16.6% error with respect to all patients.
Comparison with other methods
not the most accurate segmentation of vessels. In general, objects (vessels) visible in the picture Lwor Lk (Figure 9, Figure 10) do not have to be continuous. Furthermore, the algorithm does not have to segment all the vessels. Therefore, high accuracy is not required. The only common feature is related to the fact that the ratio of thickness of vessels must be preserved. The reason is that each pixel of an object (vessel) affects the shape of the histogram (Figure 12) and thus the valueϕmax.
The results of the presented algorithm were compared with the results obtained with DRIVE database [30]. The assessment of quality of segmentation of vessels should be distinguished from the evaluation of the adopted statistical methods. Minor differences were obtained in the detected level of details of vessels in favor of the method described in paper [30]. Underestimation and lack of vessels continuity were the main reasons for
Figure 13A full decision tree and after pruning - constructed based on 5 attributes - z,ΦSR,ΦSTD,
Φmax, ps. For the pruning decision tree only one representative attribute is obtained -ϕmax- and the
these differences. For 20 verified cases, the underestimation was less than 15% of the total area of all objects. It should be noted that despite receiving seemingly worse results of segmentation of vessels, the method described above has not been profiled for this purpose. This method enables to obtain directly the measurement results of tortu-osity and percentage of vessels in the analyzed area. Therefore, in contrast to the meth-ods described in the introduction [12–21], there is no need to perform additional analyzes like zooming vessels with a curve [12,16] or using patterns of tortuosity [15] etc. This is the biggest advantage of the presented algorithm over other methods described in all the publications [12–21]. An additional advantage of this algorithm is negligible sensitivity to change of image acquisition parameters - for different operators, different camera settings and different patient settings. This is due to the characteristics of the algorithm: automatically corrected unevenness of lighting and acceptance of lack of vessels continuity.
Comparing the obtained results with those of other authors, a similar global approach in the fractal analysis can be found. The fractal dimension shown in papers [31,32] allows for a group division into healthy subjects and those with hypertension. In paper [31], the value, i.e. fractal dimension, is fixed at 1.437 with a standard deviation of 0.025. However, this method is semi-automatic. Paper [33], on the other hand, presents an interesting method based on nonlinear orthogonal projection approach. This method uses the afore-mentioned DRIVE database. The authors have obtained 96.1% accuracy. The results are similar to those obtained in this paper (96% accuracy). However, they were obtained with a slightly different method. The differences consist in the fact that the algorithm presented in paper [31] is not fully automatic (the differences are thus related to the segmentation method). The algorithm presented in paper [33] does not apply directly to the detection of patients with hypertension. The level of accuracy at 96.1% indicated by the authors concerns the quality of segmentation of vessels. It is not a measure of the quality of separation of patients with hypertension from healthy sub-jects. Yet in paper [32] a global fractal analysis applies only to chronic kidney disease. The results in the diagnosis of this condition are at 95%. Therefore, a comparison with the use of the fractal dimension was carried out for the images obtained in this study. For this purpose, Fracllac software (Local Connected Fractal Dimension Analysis func-tion) was used, which is, for example, described in paper [24]. However, using only Fracllac software, no correlation between hypertension and the fractal dimension in the angiographic image was obtained. The reason was a major influence of lighting uneven-ness and artifacts visible in the image, which were not filtered. Whereas using the image pre-processing suggested in this paper, the accuracy was 81%. However, this result was obtained for the hybrid method which combines a filtration method suggested in this paper with the fractal analysis made with Fracllac software.
Conclusions
This paper presents a tool (algorithm) designed for automatic analysis of morphological parameters of vessels in the fundus watched during fluorescein angiography. The pre-sented algorithm automatically calculates the global statistical features connected with both tortuosity of vessels as well as their total area or their number. On the basis of preliminary studies, we have shown correlations between the total value of the inclin-ation angle of vessels and hypertension. This result confirms the usefulness of the described algorithm for image analysis and processing in medical practice. However, further research in a larger population is needed. The algorithm can also operate in a batch mode where the operator only selects a folder with images for analysis. Currently, with no time optimization, the analysis of one image takes a few seconds on the Intel Core 2 Quad Q9300 2.5 GHz CPU with 8 GB RAM.
Competing interests
The authors declare that they have no competing interests.
Authors’contributions
RK and ZW suggested the algorithm for images analysing and processing, implemented it and analysed the images. SJT, BW, EW performed the acquisition of the fundus of the eye images and consulted the obtained results. MK expressed opinions on the obtained results from a cardiologic point of view. All authors have read and approved the final manuscript.
Acknowledgements
No outside funding was received for this study.
Author details 1
Department of Computer Biomedical Systems, Institute of Computer Science, University of Silesia, ul. Będzińska 39, 41-200, Sosnowiec, Poland.2Department of Ophthalmology, Okregowy Szpital Kolejowy, Panewnicka 65, 40-760, Katowice, Poland.3I Clinical Department of Cardiacurgery, Medical University of Silesia,Śląski Ośrodek Kardiologii, Katowice, Poland.
Received: 16 May 2012 Accepted: 5 June 2012 Published: 22 June 2012
References
1. Farsiu S, Chiu SJ, Izatt JA, Toth CA:Fast detection and segmentation of drusen in retinal optical coherence tomography images.Proceedings of Photonics West. Proc SPIE2008,68440D:D1–D12.
2. Khan AU, Rabya BK, Bilal S, Asad J, Shah M:Enhancement of Angiogram Images Using Pseudo Color Processing. Information Technology Journal2008,7:210–214.
3. Hughes S, Gardiner T, Hu P, Baxter L, Rosinova E, Chan-Ling T:Altered pericyte-endothelial relations in the rat retina during aging: Implications for vessel stability.Neurobiol Aging2006,27:1838–1847.
4. Chu C, Delp E, Buda A:Detecting left ventricular endocardial and epicardial boundaries by digital two-dimensional echocardiography.IEEE Trans Med Imaging1988,7:81–90.
5. Grattoni P, Bonamini R:Contour detection of the left ventricular cavity from angiographic images.IEEE Trans Med Imaging1985,4(2):72–78.
6. Herna´ndez-Hoyos M, Orkisz M, Puech P, Mansard-Desbleds C, Douek P, Magnin IE:Computer-assisted Analysis of Threedimensional MR Angiograms.Radiographics2002,22:421–436.
7. Xinchun L, Shidong C, Mouyan Z, Zhenming C:Edge-detection based on the local variance in angiographic images.Journal of Electronics2000,17(4):338–344.
8. Wong TY, Knudtson MD, Klein R,et al:Computer-assisted measurement of retinal vessel diameters in the Beaver Dam Eye Study: methodology, correlation between eyes, and effect of refractive errors.Ophthalmology 2004,111(6):1183–1190.
9. Wong TY, Klein R, Klein BE, Meuer SM, Hubbard LD:Retinal vessel diameters and their associations with age and blood pressure.Invest Ophthalmol Vis Sci2003,44(11):4644–4650.
10. Wong TY, Shankar A, Klein R, Klein BE, Hubbard LD:Prospective cohort study of retinal vessel diameters and risk of hypertension.BMJ2004,10(7457):79. 329.
11. Wong TY, Shankar A, Klein R, Klein BE, Hubbard LD:Retinal arteriolar narrowing, hypertension, and subsequent risk of diabetes mellitus.Arch Intern Med2005,165:1060–1065.
12. Wilson CM, Cocker KD, Moseley MJ,et al:Computerized analysis of retinal vessel width and tortuosity in premature infants.Invest Ophthalmol Vis Sci2008,49(8):3577–3785.
13. Gelman R, Martinez-Perez ME, Vanderveen DK, Moskowitz A, Fulton AB:Diagnosis of Plus Disease in Retinopathy of Prematurity Using Retinal Image multiScale Analysis.Invest Ophthalmol Vis Sci2005,46(12):4734–4738. 14. Kochner B, Schulmann D, Michaelis M, Mann G, Englemeier KH:Course tracking and contour extraction of retinal
15. Heneghan C, Flynn J, O’Keefe M, Cahill M:Characterization of changes in blood vessel width and tortuosity in retinopathy of prematurity using image analysis.Medical Image Analysis2002,6:407–429.
16. Koreen S, Gelman R, Martinez-Perez ME,et al:Evaluation of a computer-based system for plus disease diagnosis in retinopathy of prematurity.Ophthalmology2007,114(12):59–67.
17. Wallace DK, Jomier J, Aylward SR, Landers MB:Computer-automated quantification of plus disease in retinopathy of prematurity.J AAPOS2003,7:126–130.
18. Patton N, Aslam TM, MacGillivray T,et al:Retinal image analysis: concepts, applications and potential.Prog Retin Eye Res2006,25:99–127.
19. Pakter HM, Fuchs SC, Maestri MK, Moreira LB, Dei Ricardi LM, Pamplona VF, Oliveira MM, Fuchs FD: Computer-assisted methods to evaluate retinal vascular caliber: what are they measuring?.Invest Ophthalmol2011,52 (2):810–815. Vis Sci.
20. Kiely AE, Wallace DK, Freedman SF, Zhao Z:Computer-assisted measurement of retinal vascular width and tortuosity in retinopathy of prematurity.Arch Ophthalmol2010,128(7):847–852.
21. Swanson CR, Cocker KD, Parker KH, Moseley MJ, Wren SME, Fielder AR:Semi-automatedcomputer analysis of vessel growth in preterminfants without and with ROP.Br J Ophthalmol2003,87:1474–1477.
22. Sekiguchi H, Sugimoto N, Kawahito M, Lee JD, Nakano A, Fujita M, Eiho S:Image processing on regular coronary angiograms for myocardial perfusion measurements.Computers Cardiol2006,33:821–824.
23. Klinder T, Ostermann J, Ehm M, Franz A, Kneser R, Lorenz C:Automated model-based vertebra detection, identification, and segmentation.Medical Image Analysis2009,13:471–482.
24. Mancardi D, Varetto G, Bucci E, Maniero F, Guiot C:Fractal parameters and vascular networks: facts & artifacts. Theor Biol Med Model2008,5:12.
25. Legrand P, Lévy-Vehel J:Signal and image processing with Fraclab.: FRACTAL04, Complexity and Fractals in Nature, 8th International Multidisciplinary Conference Thinking in Patterns: fractals and related phenomena in nature.: ; 2004:321–322.
26. Gonzalez R, Woods R:Digital Image Processing. New York: Addison-Wesley Publishing Company; 1992:471–482. Chap. 4.
27. Sonka M, Michael Fitzpatrick J:Volume 2, Medical Image Processing and Analysis. InHandbook of Medical Imaging. Belligham: SPIE; 2000.
28. Figueriredo M, Leitao J:Bayesian estimation of ventricular contours in angiographic images.IEEE Trans Med Imaging1992,11:416–429.
29. Otsu N:A threshold selection method from gray-level histograms.IEEE Trans. Sys., Man., Cyber1979,9(1):62–66. 30. Staal JJ, Abramoff MD, Niemeijer M, Viergever MA, Ginneken B:Ridge based vessel segmentation in color
images of the retina.IEEE Trans Med Imaging2004,23:501–509.
31. Liew G, Wang JJ, Cheung N, Zhang YP, Hsu W, Lee ML, Mitchell P, Tikellis G, Taylor B, Wong TY:The retinal vasculature as a fractal: methodology, reliability, and relationship to blood pressure.Ophthalmology2008,115 (11):1951–1956.
32. Sng CCA, Sabanayagam C, Lamoureux EL, Liu E, Lim SC, Hamzah H, Lee J, Tai ES, Wong TY:Fractal analysis of the retinal vasculature and chronic kidney disease.Nephrol Dial Transplant2010,25(7):2252–2258.
33. Zhang Y, Hsu W, Lee ML:Detection of retinal blood vessels based on nonlinear projections.J Sign Process Syst 2009,55:103–112.
doi:10.1186/1475-925X-11-35
Cite this article as:Koprowskiet al.:Fully automatic algorithm for the analysis of vessels in the angiographic image of the eye fundus.BioMedical Engineering OnLine201211:35.
Submit your next manuscript to BioMed Central and take full advantage of:
• Convenient online submission
• Thorough peer review
• No space constraints or color figure charges
• Immediate publication on acceptance
• Inclusion in PubMed, CAS, Scopus and Google Scholar
• Research which is freely available for redistribution