Ames Laboratory Accepted Manuscripts
Ames Laboratory
8-31-2018
Probing Surface Defects of InP Quantum Dots
Using Phosphorus Kα and Kβ X-ray Emission
Spectroscopy
Jennifer L. Stein
University of WashingtonWilliam M. Holden
University of WashingtonAmrit Venkatesh
Iowa State University and Ames Laboratory, [email protected]
M. Elizabeth Mundy
University of WashingtonAaron J. Rossini
Iowa State University and Ames Laboratory, [email protected]
See next page for additional authors
Follow this and additional works at:
https://lib.dr.iastate.edu/ameslab_manuscripts
Part of the
Materials Chemistry Commons
This Article is brought to you for free and open access by the Ames Laboratory at Iowa State University Digital Repository. It has been accepted for inclusion in Ames Laboratory Accepted Manuscripts by an authorized administrator of Iowa State University Digital Repository. For more information, please [email protected].
Recommended Citation
Stein, Jennifer L.; Holden, William M.; Venkatesh, Amrit; Mundy, M. Elizabeth; Rossini, Aaron J.; Seidler, Gerald T.; and Cossairt, Brandi M., "Probing Surface Defects of InP Quantum Dots Using Phosphorus Kα and Kβ X-ray Emission Spectroscopy" (2018).Ames Laboratory Accepted Manuscripts. 425.
Probing Surface Defects of InP Quantum Dots Using Phosphorus Kα and
Kβ X-ray Emission Spectroscopy
Abstract
Synthetic efforts to prepare indium phosphide (InP) quantum dots (QDs) have historically generated
emissive materials with lower than unity quantum yields. This property has been attributed to structural and
electronic defects associated with the InP core as well as the chemistry of the shell materials used to overcoat
and passivate the InP surface. Consequently, the uniformity of the core–shell interface plays a critical role.
Using X-ray emission spectroscopy (XES) performed with a recently developed benchtop spectrometer, we
studied the evolution of oxidized phosphorus species arising across a series of common, but chemically
distinct, synthetic methods for InP QD particle growth and subsequent ZnE (E = S or Se) shell deposition.
XES afforded us the ability to measure the speciation of phosphorus reliably, quantitatively, and more
efficiently (with respect to both the quantity of material required and the speed of the measurement) than
with traditional techniques, i.e., X-ray photoelectron spectroscopy and magic angle spinning solid state
nuclear magnetic resonance spectroscopy. Our findings indicate that even with deliberate care to prevent
phosphorus oxidation during InP core synthesis, typical shelling approaches unintentionally introduce
oxidative defects at the core–shell interface, limiting the attainable photoluminescence quantum yields.
Disciplines
Materials Chemistry
Authors
Jennifer L. Stein, William M. Holden, Amrit Venkatesh, M. Elizabeth Mundy, Aaron J. Rossini, Gerald T.
Seidler, and Brandi M. Cossairt
Probing Surface Defects of InP Quantum Dots Using Phosphorus K
α
and K
β
X-ray Emission Spectroscopy
Jennifer L. Stein
a‡, William M. Holden
b‡, Amrit Venkatesh
c,d,
M. Elizabeth Mundy
a, Aaron J. Rossini
c,
Gerald T.
Seidler
b*, and Brandi M. Cossairt
a*.
aDepartment of Chemistry, University of Washington, Seattle, Washington 98195-1700, United States
bDepartment of Physics, University of Washington, Seattle, Washington 98195-1560, United States
cDepartment of Chemistry, Iowa State University, Ames, Iowa 50011, United States
dUS DOE Ames Laboratory, Ames, Iowa 50011, United States
ABSTRACT: Synthetic efforts to prepare indium phosphide (InP) quantum dots (QDs) have historically generated emissive materials with lower than unity quantum yields. This property has been attributed to structural and electronic defects associated with the InP core as well as the chemistry of the shell materials used to overcoat and passivate the InP surface. Consequently, the uniformity of the core-shell interface plays a critical role. Using X-ray emission spectroscopy (XES) performed with a recently developed benchtop spectrometer, we studied the evolution of oxidized phosphorus species arising across a series of common, but chemically distinct, synthetic methods for InP QD particle growth and subsequent ZnE (E=S, Se) shell deposition. XES afforded us the ability to measure the speciation of phosphorus reliably, quantitatively, and more efficiently (with respect to both quantity of material required and speed of the measurement) than traditional techniques, i.e. X-ray pho-toelectron spectroscopy and magic angle spinning solid-state NMR spectroscopy. Our findings indicate that even with deliberate care to pre-vent phosphorus oxidation during InP core synthesis, typical shelling approaches unintentionally introduce oxidative defects at the core-shell interface, limiting the attainable photoluminescence quantum yields.
INTRODUCTION
Indium phosphide (InP) quantum dots (QDs) are the leading cadmium-free emissive material for luminescence downconversion applications, such as LED-backlit displays, and lighting technolo-gies.1–5
Display manufacturers including Samsung, Sony, Vizio, LG, and Apple have devoted significant resources to investigating meth-ods to narrow the size distributions of InP QD samples and increase the photoluminescence quantum yields (PL QYs) up to 100%.6 De-spite these efforts, state of the art syntheses produce QD ensembles that are characterized by luminescence linewidths in the green and red region that range between 40-80 nm and quantum yields that max out at 85% in the most sophisticated shelled samples.7–9 While minimizing defects in the core and shell materials is necessary, per-haps the most crucial aspect of design is at the core-shell interface. InP QDs have been shown to be incredibly susceptible to surface ox-idation from in-situ and ex-situ sources during both core and shell syntheses, resulting in oxidized phosphorus species that likely per-turb conformal shell growth.10–12 We hypothesize that surface phos-phorus oxidation plays a leading role in limiting our ability to access higher quality samples.
Even under synthetic conditions in which extreme care is taken to exclude oxygen and water, surface phosphorus oxidation often arises as the result of undesired side-reactions that occur during the nucle-ation, growth, and shelling of InP QDs. Although there has been de-bate concerning the potential benefits of an amorphous oxidized in-terface between an InP core and its shell material with respect to re-ducing lattice strain between materials,13,14 the detrimental impact
of water on particle nucleation and growth has directed efforts to-wards removing any source of surface oxidation.15–17 Furthermore, oxidized phosphorus that is present at the core-shell interface may serve as an electronic trap site or prevent conformal deposition of shell material, both of which have the effect of reducing PL QYs. In this study, we chose three different synthetic methods that are ex-pected to produce InP QDs with minimal or no oxidation. Further-more, each InP QD was shelled with either ZnS or ZnSe with the hypothesis that samples that are initially more oxidized or that are subjected to processes that oxidize the surface will result in particles with lower PL QYs.
achieving synchrotron-level energy resolution and count rates with a spectrometer illuminated by only a conventional X-ray tube.21 The same instrument was used in a recent study of sulfur speciation in biochars as a first analytical application,22 and the present study rein-forces and, in many ways, exceeds the message of that earlier work in emphasizing new potential for XES for routine application in ana-lytical chemistry.
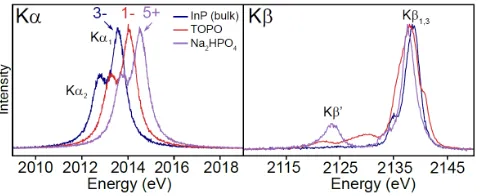
A number of recent studies have demonstrated the capability of synchrotron and laboratory-based XES to measure speciation in phosphorus, sulfur, and chlorine compounds.22–27 In particular, P Kα XES has been used to quantitatively determine the fraction of phos-phorus species with different local charge densities (i.e. oxidation states). The Kα emission line corresponds to a transition of an elec-tron between the deep, atomic-like 2p and 1s orbitals. In the sim-plest treatment, the sensitivity of this transition to changes in the va-lence electron population comes from the different changes in the screening of the nuclear charge as observed from the 2p and 1s or-bitals. As these effects are only weakly perturbative for phosphorus (but can be much more complex for, e.g., 3d transition metals) the Kα emission spectra typically show only a shift of the peak position from lower to higher energy with increasing oxidation state, while the spectral shape remains unchanged (Figure 1). For a compound containing phosphorus in multiple oxidation states, the proportion of each oxidation state can be determined quantitatively by simple linear-combination fitting to multiple line shapes, although this ben-efits from prior knowledge of a suitable reference spectrum set.
For information beyond oxidation state determination by the P Kα emission, P Kβ XES enables a more detailed interrogation of the electronic structure. The Kβ emission line results from electronic transitions from the 3p shell, suitably hybridized with valence and semi-core ligand electrons, to the 1s core hole. Due to the direct rel-evance of such a characterization of the bonding electronic density of states for chemistry, this type of valence to core (VTC) XES is seeing growing use, such as in studies of organometallic systems.28–31 Thus the Kβ emission has increased chemical sensitivity, and can provide information about bonding, symmetry, and ligand type.24 A full interpretation of the various spectral features requires quantum chemistry calculations.24,28,32,33 Here, we focus on the ligand finger-printing capability of the Kβ spectral features, specifically the Kβ’ sat-ellite feature near 2123.5 eV in the phosphate spectrum. This feature results from mixing of P valence states with an O 2s orbital,24,34 and thus serves as a clear indicator of the presence of phosphate. P Kβ
[image:4.612.56.296.541.639.2]spectra are shown for reference compounds in Figure 1.
Figure 1. P Kα and Kβ X-ray emission spectra of reference compounds.
The Kα spectra of the three compounds are nearly identical, with shifts
in energy towards higher energy with increasing oxidation state. Nomi-nal oxidation states of the reference compounds are indicated above the
given spectra. The Kβ spectra is a valence to core transition, and a
num-ber of different spectral features are observed. Of particular importance
is the strong Kβ’ peak at 2123.5 eV in the Na2HPO4 spectra, which is due
to mixing of the P 3p and O 2s orbitals, and thus serves as a fingerprint of P–O bonds from the phosphate.
EXPERIMENTAL
X-ray emission spectroscopy
P Kα and Kβ XES measurements were performed on a recently developed laboratory spectrometer, reported in detail in Holden et al.21 The spectrometer uses a low-powered, unfocused X-ray tube (Varex VF50, 50W) to illuminate the sample, whose emitted X-rays are analyzed by a 10 cm radius of curvature cylindrical crystal ana-lyzer and detected using a new home-made CMOS direct-exposure color X-ray camera.21,35 The spectrometer makes use of the disper-sive refocusing Rowland (DRR) geometry, in which the sample is placed within the Rowland circle and illuminated with an unfocused beam of incident radiation while a position-sensitive detector is placed tangential to the circle at the location of the refocused fluo-rescence. This method of illumination allows efficient collection of signal from the sample, and the entire energy region of interest is measured simultaneously by the CMOS camera functioning as a po-sition-sensitive detector with sufficient single-photon energy resolu-tion to reject background scatter and chamber-wall fluorescence. The wavelength dispersing component is a Si(111) cylindrically-bent Johann analyzer having a 10 cm radius of curvature (XRSTech). The Si(111) analyzer provides Bragg angles of 79° for P Kα (~2014eV) and 67.6° for P Kβ (~2138eV). To prevent air con-tamination during XES measurements, the sample and crystal are in-side a small vacuum chamber which was pumped to <100 mTorr pressure during the measurements. For improved resolution at P Kα, the crystal analyzer was masked using aluminum foil to a 10×2 mm2 region (along Rowland plane × out of Rowland plane). For the weaker P Kβ signal the crystal was unmasked in order to improve count rates at the expense of increased Johann error. The Johann error causes weak tails on the high-energy side of the spectrum. These distortions do not significantly affect the analysis of the P Kβ
spectra used here. The energy scale of P Kα and Kβ measurements is calculated based on the instrumental geometry with Na2HPO4 as a reference standard having Kα1 and Kβ1,3 energy positions at 2014.55 eV and 2137.80 eV, respectively.24
The InP QD samples were prepared for XES measurements by drop-casting onto silicon wafers with a spot size ~3-4 mm in diame-ter with <5 mg of madiame-terial. The drop-cast samples were stored in an inert nitrogen atmosphere and were briefly exposed to air during loading into the instrument. The wafers were mounted in the instru-ment and the drop-cast spot exposed directly to the incident beam. With the current instrumental configuration, switching between Kα
and Kβ measurements requires manually repositioning the crystal analyzer and re-tuning, thus the measurements were done in batches to separately measure Kα and Kβ. Fresh InP QD samples were drop-cast for each measurement.
The primary source of systematic uncertainty in this approach is due to limited prior knowledge of the number of distinct oxidation states in the sample. For the InP QDs, our primary expectation is a superposition of a low-energy Kα1,2 spin-orbit split doublet repre-senting the reduced phosphorus in the InP cores and a higher-energy Kα1,2 doublet due to surface oxidized phosphorus species. If an ap-preciable amount of a third phosphorus species exists in an oxidation state between these two extremes, the energy positions and results of the phosphide-vs-phosphate speciation based on the erroneous two component fit will be skewed. As discussed in the Results, this effect was observed for samples where TOP-Se was used as a precur-sor, producing TOPO as a byproduct. To analyze the spectra for those samples, linear combination fitting was performed with three components, where the energy positions of the reduced and oxidized components were allowed to vary, but the TOPO component was fixed to be at 2014.07 eV, as determined by measurement of a pure reference TOPO sample.
Another source of systematic uncertainty is variations in the de-tailed shape of the Kα1,2 doublet for the components of the fitting procedure. Though these variations have not been reported in detail for phosphorus, variations in the Kα1,2 intensity ratio in the range of 1.7-2.3 have been reported for a variety of sulfur compounds.25 In addition, variations in the Voigt widths of the line shapes on the or-der of 2% are observed for the reference compounds measured here. The effect of these variations on the systematic uncertainty were es-timated by performing the fitting procedure over a range of intensity ratios and widths, and the results are given in Table S1 and S2 in the Supporting Information.
During the P Kα measurements, changes in speciation due to pos-sible radiation damage were checked by performing the speciation calculations on subsets of the accumulated data. The results are shown in Figures S1 and S2. The majority of the samples changed speciation by less than ± 2% during the measurements and vary non-monotonically. For the three samples which show large monotonic changes, C-InP, C/ZnS, and InP/Zn, it is believed that a vacuum leak may have contributed. For those samples, only the first scan was kept for the final results. The vacuum leak was addressed before the remaining samples were measured.
To obtain a final estimate of the uncertainty from the XES fitting results, the uncertainty from signal variation over time was com-bined with the uncertainties estimated by varying the Kα1,2 intensity ratio and Voigt widths and added to the statistical uncertainty. The full details are given in Table S1 and S2, and the final uncertainty es-timates are given in Table 1.
31P MAS solid state NMR spectroscopy
All quantum dot samples were prepared for SSNMR analysis from concentrated colloidal solutions (ca. 50 mg of dried quantum dots in 1 mL anhydrous toluene) by impregnating 150-450 µL of the col-loidal solutions in 8-12 mg of boron nitride, in 50 µL aliquots. The mixture was allowed to dry on a watch glass for an hour before pack-ing into a 1.3 mm rotor. In order to confirm that there is a minimal increase in oxidation induced by this procedure, 31P SSNMR spectra were obtained from InP QDs after 10 days of air exposure (Figure S3). These tests indicated that there should be minimal oxidation over the course of several hours that are required to prepare the sam-ples for SSNMR experiments.
MAS 31P SSNMR spectra were recorded using a Bruker Avance III HD console on a wide-bore 9.4 T magnet (n0(31P) = 162.1 MHz). All experiments were performed using a 1.3 mm fast MAS
broadband HX SSNMR probe and the rotors were spun with nitro-gen gas to prevent additional oxidation of the QDs during the course of the measurements. 31P MAS NMR spectra were obtained using a rotor synchronized Hahn echo (90°-t-180°-t-acquire) pulse se-quence with continuous wave 1H heteronuclear decoupling applied during acquisition. The pulse widths for 90° and 180° pulses were 1.3
µs and 2.6µs, respectively (192 kHz RF field) and the rotor synchro-nized t periods were set such that the total echo delay was 2 rotor cycles. The MAS frequency was 50 kHz in all cases. Fast MAS helps to provide quantitative NMR spectra by eliminating spinning side-bands and focusing signal into the isotropic peaks. The 1H RF power for continuous wave heteronuclear decoupling was set to the HORROR condition [n1(1H) = 25 kHz]. All 31P SSNMR spectra were acquired with 500 s recycle delay to ensure there was adequate relaxation delay ≥ 3×T1 to give quantitative SSNMR spectra. This was confirmed by acquiring a 31P SSNMR spectrum of C-InP QDs with a 750 s recycle delay, which showed a comparable intensity for the phosphide signal. The spectral width was set to 200 kHz and the number of digitized points to 8 k, corresponding to a total acquisi-tion time of 20.48 ms. 31P spectra were acquired in steps of 32 scans (4.4 hour experiment time), and multiple spectra were acquired un-til the sum of all spectra provided a spectrum with reasonable signal to noise ratio. Each spectrum was processed by zero filling up to 8k real data points and by adding a simple exponential window function with 1000 Hz line broadening. All data processing was performed on Topspin 3.5.
X-ray photoelectron spectroscopy
All XPS spectra were taken on a Surface Science Instruments S-Probe photoelectron spectrometer. This instrument has a mono-chromatized Al Kα X-ray source which was operated at 20 mA and 10 kV and a low-energy electron flood gun for charge neutralization. X-ray analysis area for these acquisitions was approximately 800 μm across. Pressure in the analytical chamber during spectral acquisition was less than 5 x 10⁻⁹ Torr. All included figures are high-resolution spectra. The pass energy for high-resolution spectra was 50 eV, and data point spacing was 0.065 eV/step. The takeoff angle (the angle between the sample normal and the input axis of the energy ana-lyzer) was 0°. Service Physics Hawk version 7 data analysis software was used to fit high-resolution spectra. The binding energy scale was calibrated from hydrocarbon ligands using the C 1s peak at 284.6 eV. P2p peaks were analyzed using a linear background and fits were con-strained with a 0.84 eV splitting value.
All InP samples were drop-cast solutions on a Si wafer while solids were brushed onto a strip of double-sided tape on a Si wafer. Sample preparation was performed in a nitrogen glovebox and transported in sealed containers to the instrument but transfer into the instru-ment chamber did require a minor degree of exposure to air/mois-ture.
General Nanoparticle Characterization
imaging were prepared by spotting a 50/50 toluene/pentane solu-tion of nanoparticles onto an ultrathin carbon on holey carbon sup-port film purchased from Ted Pella. Solution NMR spectra were rec-orded on a 700 MHz Bruker Avance III spectrometer.
Synthetic Details: General Considerations
All glassware was dried in a 160 °C oven overnight prior to use. All reactions, unless otherwise noted, were run under an inert atmos-phere of nitrogen using a glovebox or using standard Schlenk tech-niques. Myristic acid (≥99%), indium acetate (99.99%), anhydrous acetonitrile (99.8%), trioctylphosphine (97%), tris(diethyla-mino)phosphine (97%), indium chloride (99.999%), zinc chloride (99.999%), trioctylphosphine oxide (90%), InP (mesh pieces, 99.998%), sulfur powder (99.5% sublimed), and selenium powder (99.99%) were purchased from Sigma-Aldrich Chemical Co. and used without further purification. Diethyl zinc (95%) was purchased from Strem Chemicals and stored in a nitrogen atmosphere glove-box. Toluene purchased from Sigma Aldrich Chemical Co. was col-lected from a solvent still and stored over activated 3 Å molecular sieves in a glovebox. 1-octadecene (90%), oleylamine (70%), and squalane (96%) were purchased from Sigma Aldrich Chemical Co. and were dried by stirring overnight with CaH2, distilled, and stored over activated 3 Å molecular sieves in a glovebox. C6D6 was pur-chased from Cambridge Isotope Labs and similarly dried and stored. Bio-Beads S-X1 were purchased from Bio-Rad Laboratories and were dried under vacuum before storage in a glovebox. Omni Trace nitric acid was purchased from EMD Millipore. 18.2 MΩ water was collected from an EMD Millipore water purification system. Tris(trimethylsilyl)phosphine was prepared by modifying a litera-ture procedure in which Na-napthalene was used in place of Na/K alloy.15
Zinc myristate was prepared from diethyl zinc and myristic acid using a modified literature procedure.37
Synthesis of C-InP QDs
C-InP QDs were prepared following a literature procedure15 in which indium acetate (1. 167 g, 4 mmol) and myristic acid (3.31 g, 14.5 mmol) were heated to 100 °C overnight under reduced pres-sure in 12 mL of ODE. P(SiMe3)3 is a very reactive and pyrophoric source of phosphorus and should be handled with care. P(SiMe3)3 (590 μL, 2 mmol) was measured into ODE (5 mL) and injected into the indium myristate solution at 315 °C. Particle growth was main-tained at 285 °C and monitored by UV-vis spectroscopy. The reac-tion was halted by cooling down to room temperature after ca. 20 minutes of growth and the ODE was removed through distillation under reduced pressure. The resulting QD paste was transferred into a glovebox for purification by re-dissolving in a minimal amount of toluene, centrifuging to remove insoluble products, then precipitat-ing the particles with acetonitrile. The flocculated solution was cen-trifuged at 7,000 rpm and the clear supernatant was discarded. After a single precipitation to remove residual ODE, the particles were dis-solved in toluene and purified by gel permeation chromatography (GPC), which has been demonstrated as an effective purification technique for these types of materials.38,39 For all following quantum dot samples, standard purification entails the removal of high-boil-ing point solvents through distillation and a combination of precipi-tation cycles and GPC.
Synthesis of InP/Zn QDs
InP/Zn QDs were prepared following a literature procedure using C-InP QDs.40 Briefly, zinc myristate (335 mg, 0.64 mmol) was heated to 80 °C in 5 mL of ODE until the solution was a cloudy white suspension. InP QDs (0.42 mmol of In) suspended in 5 mL of ODE
were added to the suspension and heated to 200 °C for 3 hours. Par-ticles were purified by the standard procedure.
Synthesis of M-InP QDs
First, InP magic-sized clusters (MSCs) were synthesized follow-ing a modified preparation from our lab.41 Indium acetate (5.605 g, 19.2 mmol) and myristic acid (15.9 g, 69.6 mmol) were heated neat at 100 °C under reduced pressure overnight. Dry toluene (50 mL) was added to the reaction flask at room temperature under N2 the following day, after which P(SiMe3)3 (2.8 mL, 9.6 mmol) was meas-ured into 10 mL of toluene and injected into the indium myristate solution at 100 °C. Cluster growth was complete within 1 hour as indicated by the characteristic absorbance peak at 386 nm. The par-ticles were concentrated down to a minimal volume of toluene, cen-trifuged to remove insoluble products, and purified by GPC. Follow-ing purification, the absence of free acid was confirmed by 1H NMR spectroscopy and the MSCs were stored as a solid.
M-InP QDs were synthesized from InP MSCs through a modified procedure.41 Myristate-capped InP MSCs (60 mg) were dissolved in 3 mL of ODE and transferred to a syringe. In a 3-neck flask under N2 on a Schlenk line, 12 mL of ODE was heated to 300 °C at which point the MSCs were rapidly injected. Particle growth was held at 285 °C until complete (15-20 minutes) and then cooled down to room tem-perature. Particles were purified by the standard procedure. Synthesis of A-InP QDs
A-InP QDs were synthesized following a modified procedure as described by Brainis et al.42 Indium chloride (50 mg, 0.23 mmol) and zinc chloride (150 mg, 1.1 mmol) were stirred in oleylamine (2.5 mL, 7.5 mmol) under reduced pressure at 120 °C for an hour. The reaction was placed under N2 and at 180 °C, tris(diethyla-mino)phosphine (0.23 mL, 0.8 mmol) was injected and particle growth was complete within approximately 20 minutes. After cool-ing down to room temperature, particles were removed from oleyla-mine by precipitation with ethanol. GPC purification was performed once particles were re-dissolved in toluene.
ZnS shelling of C, M, and A-InP QDs
ZnS shelling of InP QDs was performed following a modified pro-cedure as described by Peng et al.43 A purified solution of InP QDs (0.04 mmol indium) was dissolved in 7 mL of ODE and heated to 150 °C under inert atmosphere. Initial solutions of InP QDs (C, M, and A) were standardized to each other by matching absorption at 310 nm. Stock solutions of zinc myristate (28.8 mg in 10 mL ODE, 5.6 mM) and sulfur (22.4 mg in 10 mL ODE, 0.07 M) were prepared and heated to 100 °C in Schlenk flasks in an oil bath. For the first monolayer, a 2.17 mL aliquot of the zinc myristate stock (0.012 mmol) was added to the InP particles at 150 °C. After 10 minutes, 170 µL (0.012 mmol) of the sulfur stock solution was added, then the reaction was heated at 220 °C for 30 minutes. The second mon-olayer was added in the same fashion with 2.89 mL (0.016 mmol) of zinc myristate and 230 µL (0.016 mmol) of sulfur. After 30 minutes at 220 °C, the reaction was cooled down and purified through the standard procedure.
ZnSe shelling of C, M, and A-InP QDs
ZnSe shelling was performed following a modified procedure as described by Brainis et al.42
of selenium in 10 mL of TOP (2.23 M) and 87 µL (0.192 mmol) of this stock was slowly injected into the reaction flask. After 140 minutes, a second addition of zinc myristate was added (300 mg, 0.576 mmol). At this point, the reaction was set to 320 °C and during heat-up, the second injection of TOP-Se was added drop-wise (262 µL, 0.576 mmol). Particle luminescence was monitored at 320 °C and the reaction was cooled when the PL ceased to change (ca. 1 hour). Particles were purified using the standard procedure.
RESULTS AND DISCUSSION
To validate the use of Kα XES as a method to determine P specia-tion in InP QDs, a series of three samples was used in a head-to-head comparison of oxidation state distributions inferred from P Kα XES and from 31P MAS SSNMR. Notably the InP and InP/ZnS samples have in part been previously characterized by Chaudret et al. via XPS and SSNMR spectroscopies with the primary conclusion that oxida-tion occurs during both synthesis and shell growth.12 Here, samples including InP QDs, InP QDs that have been post-synthetically treated with zinc (InP/Zn), and InP QDs that have been shelled with ZnS (InP/ZnS) were studied. The results for all samples are presented in Table 1 and a comparison of the quantification of phos-phorus oxidation state by both 31
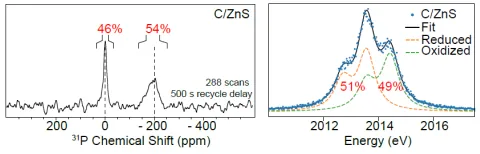
P SSNMR and P Kα X-ray emission spectroscopy for the InP/ZnS sample is shown in Figure 2. Addi-tional spectra are presented in Figure S4. Excellent agreement is found between the two techniques, and the results fall within the range of values reported by Chaudret et al.12 The 31P SSNMR spec-tra generally show resonances centered at ca. 0 ppm, assigned to ox-idized phosphate species, and –200 ppm, assigned to the core phos-phide species. Cross polarization magic angle spinning (CP-MAS) and direct excitation 31P SSNMR experiments have previously demonstrated that the oxidized phosphorus species are located at the surface of the nanocrystals.44,45
Using the fitting procedure de-scribed in the Experimental section, the P Kα XES signal for each of the three samples is fit well using two oxidation state components, one with an average Kα1 energy position of 2013.56 eV identified as InP and one higher in energy with an average position of 2014.41 eV. Although the SSNMR identifies the oxidized species as phosphate-like, the Kα1 energy position is somewhat lower in energy than that of the disodium phosphate reference standard used (2014.55 eV). Though phosphides and sulfides are known to have small shifts in the Kα1 energy position due to differing degrees of covalency,24,25 this hasn’t previously been observed in phosphates or sulfates and could be worthy of future investigation. With the identification of phos-phate from the SSNMR resonance at ca. 0 ppm and the agreement between the SSNMR and XES results, this confirms the oxidized component at 2014.41 eV corresponds to phosphate.
Figure 2. Comparison of 31P SSNMR spectrum (left) and P Kα XES
(right) of the same batch of InP/ZnS QDs. The SSNMR signal near 0 ppm corresponds to surface phosphate, and this component shows up
at a Kα1 energy position of ~2014.41 eV. The relative peak areas in both
[image:7.612.321.555.66.146.2]types of spectra are indicated as percentages.
Table 1. Comparison of SSNMR and P Kα XES for Determination of
Phosphorus Oxidation State in InP QDs.
Sample SSNMR
(% red)
SSNMR
(% ox) P K
aXES (% red)
P KaXES
(% ox)
InP 93 7 89 ± 3 11 ± 3
InP/Zn 87 13 83 ± 4 17 ± 4
InP/ZnS 54 46 51 ± 5 49 ± 5
These measurements demonstrate that P Kα XES is a reliable tool for measuring phosphorus oxidation having significant advantages over 31P SSNMR spectroscopy. Each XES measurement required <5 mg of material and speciation could be determined within the first 30 minutes, though the measurements were extended to improve the resulting spectra and monitor for possible radiation damage (Figures S1 and S2). The SSNMR measurements required ca. 10-20 mg of material to prepare the samples for measurements (although within the 1.3 mm rotor there is likely less than 1 mg of material). Regard-less, the SSNMR spectra typically required multiple days of collec-tion time to obtain spectra that can be reliably integrated. Based on this promising data, we proceeded by measuring the extent of phos-phorus oxidation as a function of synthetic method using XES for rapid feedback, augmented by SSNMR and other methods when ap-propriate. Our goal is to obtain a uniquely detailed picture of the existence and origin of synthesis-specific adventitious phosphorus oxidation and its correlation with QD QY. A detailed understanding of phosphorus speciation and the degree of oxidation induced by dif-ferent synthetic procedures is a critical first step to devising new syn-thetic routes to high performance InP QDs.
Surface oxidation as a function of initial InP synthesis
Here, we evaluate the extent of oxidation that can occur in a core synthesis by studying InP quantum dots synthesized via three differ-ent routes. All reactions were performed under air-free conditions in a nitrogen-atmosphere glovebox or on a Schlenk line. All reagents and glassware were rigorously dried as described in the experimental section. A summary of particle characterization for this series of InP QDs including optical peak positions, composition, particle size, and powder diffraction patterns, can be found in Table S3 and Figure S5.
The first synthesis is the most common approach to produce crys-talline InP QDs through the reaction between indium carboxylates, excess carboxylic acid, and tris(trimethylsilyl)phosphine, P(SiMe3)3, at elevated temperatures.9,43,46 In future reference and plots, InP QDs prepared by this route (indium carboxylates + P(SiMe3)3) will be referred to as C-InP. Although this approach is well-established, water is generated as a by-product from carboxylic acid ketonization at elevated temperatures and thus, the InP QDs are detrimentally impacted through surface oxidation. This oxidation has previously been implicated in the inability to grow InP QDs to large diameters.14,47 Thus far, water has been identified as the most likely primary source of oxygen atoms involved in phosphate for-mation.44,48 Chaudret and co-workers characterized the amorphous surface oxide layer that is produced by the concurrent oxidation through a combination of XPS, IR, and SSNMR spectroscopy.11
[image:7.612.54.294.572.649.2]weak emission features comprised of a peak at 579 nm and a broad red-shifted shoulder that corresponds to band edge and radiative surface defect emission, respectively. The normalized PL spectrum is shown in Figure S6 and corresponds to a PL QY <1%.
In the second synthesis, atomically-precise In37P20(O2CR)51 magic-sized clusters (MSCs) were used as single-source precur-sors.41,50 Carboxylate-capped InP MSCs can be purified to remove any freely diffusing carboxylic acid, ensuring that the reaction solu-tion is a homogeneous mixture of only the MSC. We found this an appealing choice for this study since the removal of acidic protons would ideally prevent decarboxylative coupling and aqueous by-products. In future reference, the quantum dots derived from InP MSCs are referred to as M-InP.
The production of M-InP requires two steps, with the first step being the synthesis and isolation of In37P20(O2CR)51. This can be done by following the conditions to make C-InP QDs as described above but dropping the injection/growth temperature to 100 ºC and running the reaction in toluene.41 The MSCs were purified through gel permeation chromatography (GPC) and analyzed by 1
H NMR spectroscopy to ensure the removal of excess acid (Figure S7). At this point, a portion of MSCs, which exist in the form of a waxy solid, can be dissolved in ODE and injected into a 300 ºC solution of ODE. Depending on the concentration of MSCs in the growth solution, particle size can be modified.41 In this instance, a 60 mg injection of MSC produced particles with a LEET at 555 nm and emission fea-tures similar to C-InP with the band edge emission at 591 nm (Fig-ure 3 and Fig(Fig-ure S6). The advantages to using this 2-step route over traditional indium/phosphorus monomer nucleation are two-fold in that the synthesis can be performed more reproducibly with a homo-geneous precursor and the monodispersity of the resulting sample ensemble is improved. TEM images of M-InP QDs show this with more ordered packing due to the more uniform particle morpholo-gies.
In the final synthesis method, we examined InP QDs prepared from indium halides and aminophosphines in primary amine sol-vent. Aminophosphines have been introduced as reliable phospho-rus precursors for the synthesis of size-tunable InP QDs when paired with indium halides.51 The reaction between metal halides and ami-nophosphines is driven by the dual role of amiami-nophosphines as a phosphorus source and as a reducing agent.19,52 More importantly for the present work, the aminophosphine synthesis does not involve any oxygen-containing reagents, eliminating the possibility of oxida-tion via reagent decomposioxida-tion products. In future reference and plots, InP QDs synthesized with an aminophosphine P-source will be referred to as A-InP.
[image:8.612.318.557.35.189.2]The aminophosphine-based InP QD synthesis diverges from in-dium carboxylate/silylphosphine chemistry in that the solvent, a pri-mary amine, is coordinating and so acts as a solvent, ligand, and even plays a role in the precursor conversion reactions. Furthermore, Zn(II) was added to the precursor mixture prior to particle nuclea-tion and has been observed to improve the resulting particle crystal-linity and monodispersity. Further details can be found in the Exper-imental section but briefly, zinc chloride and indium chloride were heated to 180 ºC in oleylamine followed by injection of tris(diethyl-amino)phosphine. The final A-InP particles have a LEET at 573 nm and an emission peak at 618 nm (3% PL QY) shown in Figure 3 and Figure S6. Replacing carboxylates as surface ligands with chlorides and amines also impacts particle morphology by preferentially bind-ing to the (111) face as seen by the tetrahedral shape of the resultbind-ing particles.14
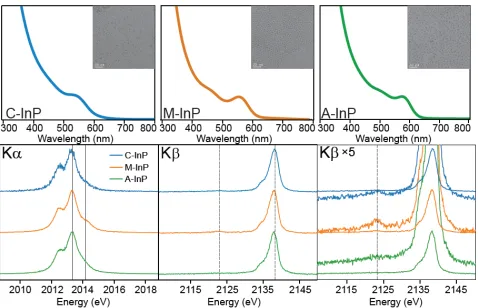
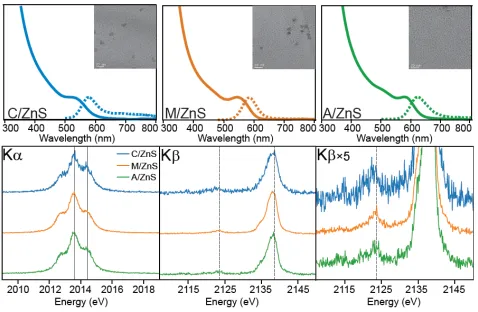
Figure 3. The final absorbance trace (top) of C-InP, M-InP, and A-InP
with TEM image insets (20 nm scale bar) of purified material. P Kα and
Kβ XES spectra (bottom) for the InP QD samples where solid vertical
lines in the Kα spectra indicate the InP component (2013.59 eV) and
the identified phosphate component (2014.41 eV). In the Kβ spectra,
dashed lines indicate the Kβ’ peak of phosphate (2123.5 eV), and the
Kβ1,3 peak of bulk InP (2138.6 eV).
Kα XES measurements were used to measure phosphorus specia-tion as described in the Experimental secspecia-tion. The P Kα emission spectra of C, M, and A-InP QDs are shown in Figure 3 with corre-sponding peak positions and speciation percentages summarized in Table 2. The lower energy component is described as ‘reduced’ and the higher energy component is described as ‘oxidized’. We attribute the 11% oxidized component measured in C-InP to the previously characterized ketonization reaction that occurs during particle growth, which is supported by the two phosphorus resonances in the 31P SSNMR spectrum (Figure 4a). At elevated temperatures, the
ex-cess acid undergoes decarboxylative coupling in which a ketone, car-bon dioxide, and water are products. Our initial expectation from the M-InP was to circumvent water formation through the removal of acid (1H NMR, Figure S7). As can be seen from the 16% oxidized component of M-InP, this process was difficult to avoid. A solution 13C NMR spectrum of the M-InP QDs before purification shows an
apparent peak in the expected region for a ketone carbon at 210 ppm (Figure S8); formation of ketone in the synthesis would be accom-panied by the formation of water. There is a notable lack of an acidic proton in the 1H NMR spectrum of the initial MSCs, suggesting no free carboxylic acid is present prior to synthesis. Furthermore, the P Kα emission spectrum of the stock MSCs shows that the starting ma-terial was not oxidized, which agrees with the single-crystal structure that is fully saturated with surface indium carboxylates (Figure S9).50 However, we hypothesize that in the case of long-chain carboxylate ligands, carboxylic acid is difficult to remove due to hydrogen bond-ing interactions and entanglement of the aliphatic side-chains with the carboxylate ligand shell.
A-InP spectrum implies that the 17% oxidized component is not due to phosphate.
Table 2. Phosphorus Speciation as Determined by Linear Combination Fitting to Kα XES Spectra.
Sample Reduced (%) Oxidized (%)
Estimated Uncertainty (%)
Reduced Kα1
energy (eV)
Oxidized Kα1
energy (eV) Reduced-χ2
C-InP 89 11 ± 3 2013.54 2014.40 1.15
M-InP 84 16 ± 2 2013.57 2014.50 1.17
A-InP 83 17 ± 4 2013.59 2014.29 1.32
C/ZnS 51 49 ± 5 2013.57 2014.42 1.32
M/ZnS 62 38 ± 4 2013.55 2014.44 1.18
A/ZnS 57 43 ± 5 2013.58 2014.42 1.12
C/ZnSe 14 86 ± 9 2013.55 2014.32 1.02
M/ZnSe 16 84 ± 5 2013.53 2014.41 1.24
A/ZnSe 51 49 ± 5 2013.58 2014.45 1.06
For the InP and ZnS-shelled samples, the Kα1 energy positions from two-component fitting are reported. For the ZnSe shelled samples, the Kα1 energy positions of the reduced and oxidized components are reported from three-component fitting.
To investigate the identity of this component, we utilized XPS and solution 31
P NMR spectroscopy to aid in the detection of potential reaction by-products. Following multiple rounds of precipitation and GPC purification, we initially found that the solution 31P NMR spectrum of the stock solution contained no detectable resonances. Over the period of several weeks of storage in a nitrogen atmosphere glovebox however, the solution 31P NMR spectrum revealed P-con-taining impurities at 80 and 30 ppm (Fig S12). The peak at 80 ppm lies in the region of transaminated species produced during this re-action that likely exist in equilibrium with phosphonium salt byprod-ucts.19,52 Phosphonium salts, P(NHR)
4Cl in which R is an oleyl group, is the dominant reaction byproduct, forming 3 equivalents for every InP unit formed, and has been previously identified in the 31P NMR spectrum to have a peak at 29 ppm. Although alternative routes to remove P-containing impurities exist, of which ligand ex-change with thiols has met with success, subjecting the InP particle surface to further modification was not an ideal pathway with the goal of probing the surface defects intrinsic to the synthesis. The di-rect excitation 31
P SSNMR spectrum identified that there was a mixed environment of core InP, 91%, centered at –200 ppm and phosphonium salt, 9%, at 30 ppm with a notable absence of signal at 0 ppm that would correspond to surface phosphate species (Fig 4b). The P2p XPS spectrum shown in Figure S11 further supports the identification of a mixed phosphide/phosphonium environment when compared to the peak position of a commercial phosphonium salt (aminotris(dimethylamino)phosphonium chloride). Lastly, we measured the P Kα XES spectrum of the commercial phosphonium salt, and observed a Kα1 energy position at 2014.35 eV, which agrees well with the shift of Kα1 position to lower energy for the A-InP sam-ple. Taken together, this evidence supports the conclusion that the 17% oxidized component is a result of electrostatically interacting phosphonium impurities and the A-InP particle surface can be con-sidered unsullied P3-.
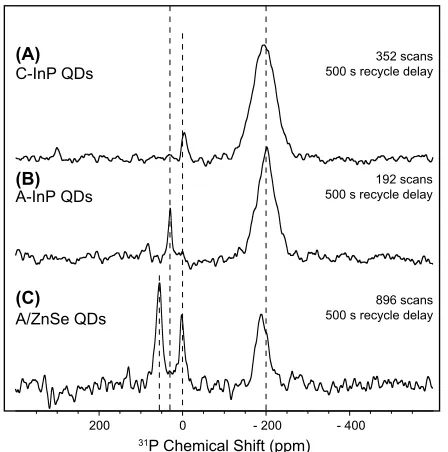
Figure 4. 31P SSNMR spectra of (A) C-InP QDs (B) A-InP QDs and
(C) A/ZnSe QDs. Dashed lines are to guide the eye to -200 ppm (phos-phide resonance), 0 ppm (phosphate resonance), 30 ppm (phospho-nium salt resonance), and 55 ppm (TOPO resonance).
As demonstrated by the P Kα emission spectra of InP QDs formed in the presence of carboxylate groups (C and M samples), ketoniza-tion is difficult to prevent, even following attempts to remove excess acid in the case of MSC precursors. Alternatively, utilizing amino-phosphines effectively reduces in-situ oxidation while also minimiz-ing the cost and hazard of the phosphorus precursor. Progress has been made toward other oxide-free syntheses in which InP is formed by heating indium carboxylates and P(SiMe3)3 in a 1.8 bar H2 atmos-phere.17 The authors conclude that H
2 molecules are activated at the
200 0 - 200 - 400
31P Chemical Shift (ppm)
352 scans 500 s recycle delay (A)
C-InP QDs
(B) A-InP QDs
(C) A/ZnSe QDs
192 scans 500 s recycle delay
[image:9.612.323.547.327.553.2]QD surface and yield P–H bonds which protect the surface through the concurrent water-forming condensation reactions. At this point, oxidative-defect-free surfaces are accessible if running a synthesis under H2 or utilizing aminophosphines with indium halides, while offering different options for surface chemistry or particle morphol-ogies. The general consensus in the field of InP QD chemistry is that the presence of surface phosphorus-oxygen bonds will detrimentally impact subsequent shell growth. We extend the characterization of InP QD oxidation through the addition of ZnE (E=S, Se) shells to gauge the effect further chemical transformations may have on the optical properties and oxidized populations of the InP samples.
Impact of oxidative surface species on optical properties
We chose to examine the resulting properties of the C/M/A-InP series shelled with either a thin ZnS shell or a thick ZnSe shell. With regard to the ZnS shell, we refer back to the work Chaudret and co-workers performed in characterizing the InP/ZnS interface.12 ZnS was grown by the successive ion layer adsorption and reaction (SILAR) approach in which zinc carboxylate and sulfur powder were added separately at elevated temperatures in order to drive reaction with the InP surface and prevent nucleation of ZnS nanoparticles.43 Through extensive optimization, thin ZnS shells (<2 nm) have been able to enhance the QY’s of InP QDs up to 60-70%. The Chaudret group found that InP is even further oxidized during shell growth due to a series of side reactions. First, elemental sulfur has been ob-served to form hydrogen sulfide through activation by the solvent, ODE.53 H
2S then reacts with zinc carboxylate to form carboxylic ac-ids which promote ketonization and water production as seen in the initial InP core syntheses (C-InP). They found that the oxidized per-centage of phosphorus in the core InP increased from 8% to 21% fol-lowing shell growth. This approach to ZnS shell growth was selected to compare the impact of an established oxidation chemistry across the series of InP QDs.
The second comparison we focus on is the growth of a thick (>5 nm) ZnSe shell. In addition to minimizing the surface defects to im-prove the core-shell interface, selecting materials with similar lattice constants aids in reducing strain. ZnSe has a 3.4% lattice mismatch with InP, which is smaller than that for ZnS at 7.7%, and thus may improve InP optical properties. Recently, thicker ZnSe shells have been reported in the literature to suppress the single-dot PL inter-mittency of InP QDs associated with nonradiative Auger processes, with QYs reaching 60%.42,54 While the thick shell effectively cuts off carrier interaction with the environment, the compressive strain in-duced upon the core nanoparticle can often lead to further lattice strain-related defects.55 Some of the detrimental effects of thick shells have been offset by alloying, particularly at the interface, or by stacking materials with a gradient lattice, as observed in chalco-genide-based materials.56–58
Following purification by GPC, solutions of C, M, and A-InP were dissolved in either ODE or squalane for shell growth. Rather than optimize conditions for maximum QY, we emphasized the compar-ison across initial InP syntheses by matching the concentration of the InP samples by standardizing the absorption at 310 nm across pre-shelled solutions to add the same amount of Zn and chalco-genide precursors. It should be noted that the particles are not pre-cisely the same size (TEM and λmax), in addition to particle polydis-persity, which may contribute to differences among the observed shell thicknesses. A summary of particle characterization for this se-ries of InP/ZnE QDs including optical peak positions, composition,
particle size, and powder diffraction patterns, can be found in Table S3 and Figure S5.
[image:10.612.318.557.189.345.2]ZnS shells were grown following a literature procedure in which zinc myristate and sulfur powder were added individually over 10-minute intervals to InP QDs at elevated temperatures. This layer by layer approach was performed a second time for an intended 2 mon-olayer ZnS shell. The resulting InP/ZnS particles exhibit a minor blue-shift in their features which we attribute to etching by H2S pro-duced in the synthesis (Figure 5). The measured PL QYs and emis-sion linewidths for C/ZnS, M/ZnS, and A/ZnS were 7% (66 nm), 28% (56 nm), and 25% (69 nm), respectively. Comparatively, the emission linewidths of highly optimized core-shell InP syntheses are 40-60 nm.9
Figure 5. The final absorbance (solid) and PL (dashed) trace C/ZnS, M/ZnS, and A/ZnS with TEM image insets (20 nm scale bar) of
puri-fied material (top). P Kα and Kβ XES spectra (bottom) for the InP/ZnS
samples where solid vertical lines in the Kα spectra indicate the InP
com-ponent (2013.59 eV) and the identified phosphate comcom-ponent
(2014.41 eV). In the Kβ spectra, dashed lines indicate the Kβ’ peak of
phosphate (2123.5 eV), and the Kβ1,3 peak of bulk InP (2138.6 eV).
The P Kα emission spectra of the InP/ZnS samples demonstrate that each InP core was significantly oxidized (Figure 5). Peak posi-tions, given in Table 2, are in line with our identified phosphate and phosphide components and show that the phosphate population for all samples increased to a range of 38-49%. The P Kβ spectrum sup-ports the identification of the oxidized component as phosphate, with strong Kβ’ peaks at 2123.5 eV (Figure 5). From previous re-ports of a shell growth-coupled oxidation event, we expected a sub-stantial increase in phosphorus oxidation. Surprisingly, the extent of phosphorus oxidation is apparently not dependent on the initial InP surface environment. Along those lines, it is difficult to correlate the extent of phosphorus oxidation with the optical properties since in each case a majority of the surface phosphorus were converted to phosphates. The important conclusion from this series of samples is that even when starting with an ideally oxidative defect-free surface, adventitious side reactions during shell growth will still significantly impact the InP surface and thus the core-shell interface.
Two distinct features arise in the absorbance spectra, one of which is a significant increase in higher energy absorbance due to the thick ZnSe shell. Secondly, the LEET experiences a red-shift due to the near overlap of the InP and ZnSe conduction band edges (Figure 6). The emission linewidths range from 59 to 84 nm with the M-InP giv-ing the narrowest linewidth (59 nm) likely due to the improved monodispersity of the starting InP cores.
Compared to the InP/ZnS samples, the PL QY of these un-opti-mized syntheses were slightly greater with a maximum of 44% from the M/ZnSe and 10% and 30% for C/ZnSe and A/ZnSe, respec-tively. At least in the case of the C/ZnSe, there was a mixture of thick-shelled particles and what could be partially thick-shelled or unthick-shelled InP QDs that limit the measured quantum yield (Figure 6). For a major-ity of the C and M/ZnSe, the morphology of the shelled particles was tetrahedral while the A/ZnSe appeared to shell less uniformly and typically looked bulbous, suggesting shell nucleation occurred sepa-rately at each vertex of the InP tetrahedron as opposed to conformal shell deposition on the more spherical cores observed in C and M. Shell uniformity will also play a role in optimizing emissive proper-ties due to the detrimental impact of structural defects. Furthermore, because of the substantial shell thickness, XPS analysis of the InP/ZnSe only revealed the phosphate peak, most likely because photoelectrons generated in the core phosphide have a lower prob-ability of escaping (Figure S12). In this context, XPS becomes an im-precise and unreliable technique.
Figure 6. The final absorbance (solid) and PL (dashed) trace of C/ZnSe, M/ZnSe, and A/ZnSe with TEM image insets (20 nm scale
bar) of purified material (top). P Kα and Kβ XES spectra (bottom) for
the InP/ZnSe samples where solid vertical lines in the Kα spectra
indi-cate the InP component (2013.59 eV) and the identified phosphate
component (2014.41 eV). In the Kβ spectra, dashed lines indicate the
Kβ’ peak of phosphate (2123.5 eV), and the Kβ1,3 peak of bulk InP
(2138.6 eV).
The P Kα emission spectra of the InP/ZnSe, shown in Figure 6, were distinctive in that the peak positions from two-component fit-ting did not overlap with our identified phosphide and phosphate components. The oxidized Kα1 were shifted lower in energy and the reduced Kα1 were shifted to higher energy (Table S4). These shifts, combined with the higher reduced-χ squared statistic of the A/ZnSe and M/ZnSe fits, suggests that the two-component fitting procedure does not sufficiently explain the observed spectra. Furthermore, we observed several differences in the Kβ emission spectra from typical InP such as the shift of the Kβ1,3 peak to lower energies and a pro-nounced shoulder at 2140.5 eV (Figure 6).
To reconcile these clear changes in the Kα and Kβ spectra for the ZnSe-shelled samples, we considered the possibility of a third
significant phosphorus species present in the sample. Fortunately, the main decomposition product of TOP-Se has been previously identified as trioctylphosphine oxide (TOPO) through precursor evolution studies of cadmium chalcogenide nanocrystals.59,60 The Kβ emission spectrum of TOPO (shown in Figure 1) qualitatively matched the distinctive features observed in the InP/ZnSe samples. Although sample purification focused on the removal of excess lig-ands and by-products, complete removal is often complicated be-cause of entanglement of long chain hydrocarbons, and in this case by weak binding of the TOPO to the particle surface. Thus, in order to evaluate the reduced and oxidized populations excluding the TOPO component, the Kα spectra were fit with three P Kα1,2 dou-blets as described in the Experimental section. This procedure re-sults in improved fits for the A/ZnSe and M/ZnSe samples (Figure S13) and improved Kα1 energy positions for all three samples (Table S5). Our analysis was further supported by the 31P SSNMR spec-trum of the A/ZnSe sample in which three populations of phospho-rus are measured; phosphide at –200 ppm, phosphate at 0 ppm, and TOPO at 55 ppm, of which the integrated areas agree qualitatively with the three-component fitting results (F6). The presence of a sig-nificant phosphate species in each of these samples also agrees qual-itatively with the Kβ spectra, each of which has a significant phos-phate Kβ’ peak near 2123.5 eV, much stronger in proportion than the spectral features exhibited in the TOPO spectrum.
X-ray emission spectra of InP/ZnSe samples shows very high oxi-dized components. In the case of the A/ZnSe, roughly 51% of the phosphorus remain as phosphide while a mere ~15% of the phos-phide component in the C/ZnSe or M/ZnSe was retained. We esti-mated that the core InP particles would have roughly 55-70% of the total phosphorus exposed to the surface, thus while the pathway of oxidation during ZnSe shell growth is unknown, it is reasonable that nearly all surface sites are oxidized. Additionally, we would not ex-pect oxidative defects to penetrate beyond the surface of the InP core so we suggest that anion diffusion occurs during shell growth (in the case of thick shells) that allows core phosphides to migrate to the surface of the shell. Evidence supporting this proposed anion dif-fusion mechanism was presented by Rosenthal et al. in which the en-ergy dispersive X-ray chemical maps of InP/ZnSe particles demon-strate alloying of In/P atoms into the Zn/Se shell.54 They hypothe-sized that alloying helps mitigate the increasing strain induced by the growth of a thick shell.
[image:11.612.58.290.329.480.2]CONCLUSIONS
Using a recently developed benchtop X-ray emission spectrome-ter, we have demonstrated the viability of phosphorus Kα XES meas-urements as a quantitative analytical tool to characterize the extent of oxidation in InP quantum dots through a comparative analysis with 31
P SSNMR spectroscopy. Complemented by measurements of the valence-to-core P Kβ emission using the same spectrometer, we were able to identify the presence of phosphate species and phos-phine/phosphonium salt by-products, which were also confirmed by 31P SSNMR. XES measurements gave us the capability to rapidly measure a high volume of samples with excellent resolution from only a few milligrams of deposited material. This demonstration strongly suggests a future in which benchtop XES serves a role in the routine analysis of phosphorus compounds and materials.
We examined the impact of phosphorus oxidation on InP optical properties by measuring surface phosphorus oxidation as a function of synthetic method and shelling strategy. The high degree of oxida-tion in the shelled compounds limit a careful interpretaoxida-tion of the correlation between QY and oxidized P, while being further compli-cated by various other synthetic factors. In this regard, the use of ul-trafast spectroscopy and high-resolution electron microscopy may aid in elucidating a more apparent relationship. While there are routes to achieving a phosphate-free surface, these result in the spe-cific ligation environment and particle morphology associated with indium halides and aminophosphine precursors. To expand upon the available options, it may serve the field to develop a deeper un-derstanding of the mechanism involving fluoride etching to address surface defects on QD surfaces,61,62 and develop new chemical meth-ods to remove phosphate defects. Side reactions occurring during shell growth further oxidize the interface to the extent that the initial condition of the core surface is inconsequential. Current industry patents cite the usage of the same precursors examined in this study, implicating the presence of oxidized surfaces and rationalizing the lower than expected PL QYs.6 This strongly motivates a push to-wards designing shelling syntheses involving innocent precursors in an effort to minimize interfacial defect sites and optimizing condi-tions to prevent significant diffusion of phosphorus from the QD core.
ASSOCIATED CONTENT
Supporting Information
Additional details regarding X-ray emission spectra fitting and QD char-acterization can be found in the supporting information PDF. The Sup-porting Information is available free of charge on the ACS Publications website.
AUTHOR INFORMATION
Corresponding Author
* [email protected] * [email protected]
Author Contributions
The manuscript was written through contributions of all authors.
‡These authors contributed equally.
Funding Sources
National Science Foundation grant no. DMR-1719797
National Science Foundation and the Department of Energy Grant No. DE-SC0016251.
Notes
The authors declare no competing financial interest.
ACKNOWLEDGMENT
This research (B.M.C. and J.L.S) was partially supported by the U.S. Na-tional Science Foundation through the University of Washington Mo-lecular Engineering Materials Center, a Materials Research Science and Engineering Center (grant no. DMR-1719797). This work (W.M.H. and G.T.S) was partially supported by the Joint Plasma Physics Program of the National Science Foundation and the Department of Energy un-der Grant No. DE-SC0016251. A.J.R and A.V. were supported by the U.S. Department of Energy (DOE), Office of Science, Basic Energy Sci-ences, Materials Science and Engineering Division. The Ames Labora-tory is operated for the U.S. DOE by Iowa State University under con-tract # DE-AC02-07CH11358. Part of this work was conducted at the Molecular Analysis Facility, a National Nanotechnology Coordinated Infrastructure site at the University of Washington, which is supported in part by the National Science Foundation (grant ECC-1542101), the University of Washington, the Molecular Engineering & Sciences Insti-tute, the Clean Energy InstiInsti-tute, and the National Institutes of Health.
ABBREVIATIONS
QD, quantum dot; PL, photoluminescence; QY, quantum yield; MAS, magic angle spinning; SSNMR, solid state nuclear magnetic resonance; XES, X-ray emission spectroscopy; XPS, X-ray photoelectron copy; ICP-OES, inductively coupled plasma optical emission spectros-copy; LEET, lowest energy electronic transition; XRD, X-ray diffrac-tion; TEM, transmission electron microscopy; MSC, magic-sized clus-ter; ODE, 1-octadecene; GPC, gel permeation chromatography.
REFERENCES
(1) Chopra, S. S.; Theis, T. L. Comparative Cradle-to-Gate Energy Assessment of Indium Phosphide and Cadmium Selenide Quantum Dot Displays. Environ. Sci. Nano 2017, 4 , 244–254.
(2) Shirasaki, Y.; Supran, G. J.; Bawendi, M. G.; Bulovic, V. Emer-gence of Colloidal Quantum-Dot Light-Emitting Technologies. Nature
Photon. 2013, 7, 13–23.
(3) Supran, G. J.; Shirasaki, Y.; Song, K. W.; Caruge, J.-M.; Kazlas, P. T.; Coe-Sullivan, S.; Andrew, T. L.; Bawendi, M. G.; Bulović, V. QLEDs for Displays and Solid-State Lighting. MRS Bull. 2013, 38, 703–711.
(4) Steckel, J. S.; Ho, J.; Hamilton, C.; Xi, J.; Breen, C.; Liu, W.; Allen, P.; Coe‐Sullivan, S. Quantum Dots: The Ultimate down-Conversion Mate-rial for LCD Displays. J. Soc. Inf. Disp. 2015, 23, 294–305.
(5) Anc, M. J.; Pickett, N. L.; Gresty, N. C.; Harris, J. A.; Mishra, K. C. Progress in Non-Cd Quantum Dot Development for Lighting Applica-tions. ECS J. Solid State Sci. Technol. 2013, 2, 3071–3082.
(6) Jun, S. A.; Jang, E. J.; Kwon, S. K.; Kim, T. H.; Lee, W. J. Semi-conductor Nanocrystal, and Method of Preparing the Same. US20140117292A1, May 1, 2014.
(7) Kim, S.; Kim, T.; Kang, M.; Kwak, S. K.; Yoo, T. W.; Park, L. S.; Yang, I.; Hwang, S.; Lee, J. E.; Kim, S. K.; et al. Highly Luminescent InP/GaP/ZnS Nanocrystals and Their Application to White Light-Emitting Diodes. J. Am. Chem. Soc. 2012, 134, 3804–3809.
(8) Lim, J.; Bae, W. K.; Lee, D.; Nam, M. K.; Jung, J.; Lee, C.; Char, K.; Lee, S. InP@ZnSeS, Core@Composition Gradient Shell Quantum Dots with Enhanced Stability. Chem. Mater. 2011, 23, 4459–4463.
(9) Tamang, S.; Lincheneau, C.; Hermans, Y.; Jeong, S.; Reiss, P. Chemistry of InP Nanocrystal Syntheses. Chem. Mater. 2016, 28, 2491– 2506.
(10) Jasinski, J.; Leppert, V. J.; Lam, S.-T.; Gibson, G. A.; Nauka, K.; Yang, C. C.; Zhou, Z.-L. Rapid Oxidation of InP Nanoparticles in Air. Solid
State Commun. 2007, 141, 624–627.
(12) Virieux, H.; Le Troedec, M.; Cros-Gagneux, A.; Ojo, W.-S.; Delpech, F.; Nayral, C.; Martinez, H.; Chaudret, B. InP/ZnS Nanocrystals: Coupling NMR and XPS for Fine Surface and Interface Description. J. Am.
Chem. Soc. 2012, 134, 19701–19708.
(13) Ramasamy, P.; Kim, B.; Lee, M.-S.; Lee, J.-S. Beneficial Effects of Water in the Colloidal Synthesis of InP/ZnS Core–Shell Quantum Dots for Optoelectronic Applications. Nanoscale 2016, 8, 17159–17168.
(14) Kim, K.; Yoo, D.; Choi, H.; Tamang, S.; Ko, J.-H.; Kim, S.; Kim, Y.-H.; Jeong, S. Halide–Amine Co-Passivated Indium Phosphide Colloidal Quantum Dots in Tetrahedral Shape. Angew. Chem. Int. Ed. 2016, 55, 3714–3718.
(15) Gary, D. C.; Cossairt, B. M. Role of Acid in Precursor Conversion During InP Quantum Dot Synthesis. Chem. Mater. 2013, 25, 2463–2469.
(16) Xie, L.; Harris, D. K.; Bawendi, M. G.; Jensen, K. F. Effect of Trace Water on the Growth of Indium Phosphide Quantum Dots. Chem.
Mater. 2015, 27, 5058–5063.
(17) Baquero, E. A.; Virieux, H.; Swain, R. A.; Gillet, A.; Cros-Gagneux, A.; Coppel, Y.; Chaudret, B.; Nayral, C.; Delpech, F. Synthesis of Oxide-Free InP Quantum Dots: Surface Control and H2-Assisted Growth.
Chem. Mater. 2017, 29, 9623–9627.
(18) Xi, L.; Cho, D.-Y.; Besmehn, A.; Duchamp, M.; Grützmacher, D.; Lam, Y. M.; Kardynał, B. E. Effect of Zinc Incorporation on the Performance of Red Light Emitting InP Core Nanocrystals. Inorg. Chem. 2016, 55, 8381– 8386.
(19) Buffard, A.; Dreyfuss, S.; Nadal, B.; Heuclin, H.; Xu, X.; Patri-arche, G.; Mézailles, N.; Dubertret, B. Mechanistic Insight and Optimization of InP Nanocrystals Synthesized with Aminophosphines. Chem. Mater.
2016, 28, 5925–5934.
(20) Berends, A. C.; van der Stam, W.; Hofmann, J. P.; Bladt, E.; Meeldijk, J. D.; Bals, S.; de Mello Donega, C. Interplay between Surface Chemistry, Precursor Reactivity, and Temperature Determines Outcome of ZnS Shelling Reactions on CuInS2 Nanocrystals. Chem. Mater. 2018, 30,
2400–2413.
(21) Holden, W. M.; Hoidn, O. R.; Ditter, A. S.; Seidler, G. T.; Kas, J.; Stein, J. L.; Cossairt, B. M.; Kozimor, S. A.; Guo, J.; Ye, Y.; et al. A Compact Dispersive Refocusing Rowland Circle X-Ray Emission Spectrometer for Laboratory, Synchrotron, and XFEL Applications. Rev. Sci. Instrum. 2017,
88, 073904.
(22) Holden, W.; Seidler, G. T.; Cheah, S. Sulfur Speciation in Bio-chars by Very High Resolution Benchtop Kα X-Ray Emission Spectroscopy.
J. Phys. Chem. A 2018, 122, 5153–5161.
(23) Petric, M.; Kavčič, M. Chemical Speciation via X-Ray Emission Spectroscopy in the Tender X-Ray Range. J. Anal. At. Spectrom. 2016, 31, 450–457.
(24) Petric, M.; Bohinc, R.; Bučar, K.; Žitnik, M.; Szlachetko, J.; Ka-včič, M. Chemical State Analysis of Phosphorus Performed by X-Ray Emis-sion Spectroscopy. Anal. Chem. 2015, 87, 5632–5639.
(25) Alonso Mori, R.; Paris, E.; Giuli, G.; Eeckhout, S. G.; Kavčič, M.; Žitnik, M.; Bučar, K.; Pettersson, L. G. M.; Glatzel, P. Electronic Structure of Sulfur Studied by X-Ray Absorption and Emission Spectroscopy. Anal.
Chem. 2009, 81, 6516–6525.
(26) Kavčič, M.; Petric, M.; Vogel-Mikuš, K. Chemical Speciation Us-ing High Energy Resolution PIXE Spectroscopy in the Tender X-Ray Range.
Nucl. Instrum. Methods Phys. Res. Sect. B Beam Interact. Mater. At. 2018,
417, 65–69.
(27) Kavčič, M.; Karydas, A. .; Zarkadas, C. Chemical State Analysis of Sulfur in Samples of Environmental Interest Using High Resolution Meas-urement of Kα Diagram Line. Nucl. Instrum. Methods Phys. Res. Sect. B
Beam Interact. Mater. At. 2004, 222, 601–608.
(28) Pollock, C. J.; DeBeer, S. Insights into the Geometric and Elec-tronic Structure of Transition Metal Centers from Valence-to-Core X-Ray Emission Spectroscopy. Acc. Chem. Res. 2015, 48, 2967–2975.
(29) Kowalska, J.; DeBeer, S. The Role of X-Ray Spectroscopy in Un-derstanding the Geometric and Electronic Structure of Nitrogenase.
Bio-chim. Biophys. Acta BBA - Mol. Cell Res. 2015, 1853, 1406–1415.
(30) Pollock, C. J.; DeBeer, S. Valence-to-Core X-Ray Emission Spec-troscopy: A Sensitive Probe of the Nature of a Bound Ligand. J. Am. Chem. Soc. 2011, 133, 5594–5601.
(31) Lancaster, K. M.; Roemelt, M.; Ettenhuber, P.; Hu, Y.; Ribbe, M. W.; Neese, F.; Bergmann, U.; DeBeer, S. X-Ray Emission Spectroscopy Evi-dences a Central Carbon in the Nitrogenase Iron-Molybdenum Cofactor.
Science 2011, 334, 974–977.
(32) Mori, R. A.; Paris, E.; Giuli, G.; Eeckhout, S. G.; Kavčič, M.; Ž it-nik, M.; Bučar, K.; Pettersson, L. G. M.; Glatzel, P. Sulfur-Metal Orbital Hy-bridization in Sulfur-Bearing Compounds Studied by X-Ray Emission Spec-troscopy. Inorg. Chem. 2010, 49, 6468–6473.
(33) Lee, N.; Petrenko, T.; Bergmann, U.; Neese, F.; DeBeer, S. Prob-ing Valence Orbital Composition with Iron Kβ X-Ray Emission Spectros-copy. J. Am. Chem. Soc. 2010, 132, 9715–9727.
(34) Bergmann, U.; Horne, C. R.; Collins, T. J.; Workman, J. M.; Cramer, S. P. Chemical Dependence of Interatomic X-Ray Transition Ener-gies and Intensities – a Study of Mn Kβ″ and Kβ2,5 Spectra. Chem. Phys.
Lett. 1999, 302, 119–124.
(35) Holden, W. M.; Hoidn, O. R.; Seidler, G. T. A Color X-Ray Cam-era for 2 – 6 KeV Using a Back-Illuminated Mass-Produced CMOS Sensor.
J. Instrum. 2018, In preparation.
(36) Newville, M.; Stensitzki, T.; Allen, D. B.; Ingargiola, A. Lmfit: Non-Linear Least-Square Minimization And Curve-Fitting For Python. Ze-nodo September 21, 2014.
(37) Glassy, B. A.; Cossairt, B. M. Ternary Synthesis of Colloidal Zn3P2 Quantum Dots. Chem. Commun. 2015, 51, 5283–5286.
(38) Shen, Y.; Gee, M. Y.; Tan, R.; Pellechia, P. J.; Greytak, A. B. Puri-fication of Quantum Dots by Gel Permeation Chromatography and the Ef-fect of Excess Ligands on Shell Growth and Ligand Exchange. Chem. Mater.
2013, 25, 2838–2848.
(39) Roberge, A.; Stein, J. L.; Shen, Y.; Cossairt, B. M.; Greytak, A. B. Purification and In Situ Ligand Exchange of Metal-Carboxylate-Treated Flu-orescent InP Quantum Dots via Gel Permeation Chromatography. J. Phys.
Chem. Lett. 2017, 8, 4055–4060.
(40) Stein, J. L.; Mader, E. A.; Cossairt, B. M. Luminescent InP Quan-tum Dots with Tunable Emission by Post-Synthetic Modification with Lewis Acids. J. Phys. Chem. Lett. 2016, 7, 1315–1320.
(41) Gary, D. C.; Terban, M. W.; Billinge, S. J. L.; Cossairt, B. M. Two-Step Nucleation and Growth of InP Quantum Dots via Magic-Sized Cluster Intermediates. Chem. Mater. 2015, 27, 1432–1441.
(42) Chandrasekaran, V.; Tessier, M. D.; Dupont, D.; Geiregat, P.; Hens, Z.; Brainis, E. Nearly Blinking-Free, High-Purity Single-Photon Emis-sion by Colloidal InP/ZnSe Quantum Dots. Nano Lett. 2017, 17, 6104– 6109.
(43) Xie, R.; Battaglia, D.; Peng, X. Colloidal InP Nanocrystals as Ef-ficient Emitters Covering Blue to Near-Infrared. J. Am. Chem. Soc. 2007,
129, 15432–15433.
(44) Baquero, E. A.; Ojo, W.-S.; Coppel, Y.; Chaudret, B.; Urbaszek, B.; Nayral, C.; Delpech, F. Identifying Short Surface Ligands on Metal Phos-phide Quantum Dots. Phys. Chem. Chem. Phys. 2016, 18, 17330–17334.
(45) Tomaselli, M.; Yarger, J. L.; Bruchez, M.; Havlin, R. H.; deGraw, D.; Pines, A.; Alivisatos, A. P. NMR Study of InP Quantum Dots: Surface Structure and Size Effects. J. Chem. Phys. 1999, 110, 8861–8864.
(46) Battaglia, D.; Peng, X. Formation of High Quality InP and InAs Nanocrystals in a Noncoordinating Solvent. Nano Lett. 2002, 2, 1027–1030. (47) Ramasamy, P.; Ko, K.-J.; Kang, J.-W.; Lee, J.-S. Two-Step “Seed-Mediated” Synthetic Approach to Colloidal Indium Phosphide Quantum Dots with High-Purity Photo- and Electroluminescence. Chem. Mater.
2018, 30, 3643–3647.
(48) Cervilla, A.; Pérez-Pla, F.; Llopis, E.; Piles, M. Unusual Oxidation of Phosphines Employing Water as the Oxygen Atom Source and Tris(Ben-zene-1,2-Dithiolate)Molybdenum(VI) as the Oxidant. A Functional Molyb-denum Hydroxylase Analogue System. Inorg. Chem. 2006, 45, 7357–7366. (49) Gary, D. C.; Glassy, B. A.; Cossairt, B. M. Investigation of Indium Phosphide Quantum Dot Nucleation and Growth Utilizing Triarylsi-lylphosphine Precursors. Chem. Mater. 2014, 26, 1734–1744.