www.biogeosciences.net/6/2099/2009/
© Author(s) 2009. This work is distributed under the Creative Commons Attribution 3.0 License.
Biogeosciences
Carbon-nitrogen interactions regulate climate-carbon cycle
feedbacks: results from an atmosphere-ocean
general circulation model
P. E. Thornton1, S. C. Doney2, K. Lindsay3, J. K. Moore4, N. Mahowald5, J. T. Randerson4, I. Fung6, J.-F. Lamarque7,8, J. J. Feddema9, and Y.-H. Lee3
1Environmental Sciences Division, Oak Ridge National Laboratory, Oak Ridge, TN 37831-6335, USA 2Department of Marine Chemistry and Geochemistry, Woods Hole Oceanographic Institution, Woods Hole,
MA 02543-1543, USA
3Climate and Global Dynamics Division, National Center for Atmospheric Research, Boulder, CO 80307-3000, USA 4Department of Earth System Science, University of California, Irvine, CA 92697-3100, USA
5Department of Earth and Atmospheric Sciences, Cornell University, Ithaca, NY 14850, USA
6Department of Earth and Planetary Science, University of California, Berkeley, CA 94720-4767, USA
7NOAA Earth System Research Laboratory, Chemical Sciences Division, 325 Broadway, Boulder, CO 80305-3337, USA 8Atmospheric Chemistry Division, National Center for Atmospheric Research, Boulder, CO 80307-3000, USA
9Department of Geography, University of Kansas, Lawrence, KS 66045-7613, USA
Received: 28 January 2009 – Published in Biogeosciences Discuss.: 26 March 2009 Revised: 12 August 2009 – Accepted: 17 September 2009 – Published: 8 October 2009
Abstract. Inclusion of fundamental ecological interactions between carbon and nitrogen cycles in the land component of an atmosphere-ocean general circulation model (AOGCM) leads to decreased carbon uptake associated with CO2
fertil-ization, and increased carbon uptake associated with warm-ing of the climate system. The balance of these two oppos-ing effects is to reduce the fraction of anthropogenic CO2
predicted to be sequestered in land ecosystems. The primary mechanism responsible for increased land carbon storage un-der radiatively forced climate change is shown to be fertiliza-tion of plant growth by increased mineralizafertiliza-tion of nitrogen directly associated with increased decomposition of soil or-ganic matter under a warming climate, which in this partic-ular model results in a negative gain for the climate-carbon feedback. Estimates for the land and ocean sink fractions of recent anthropogenic emissions are individually within the range of observational estimates, but the combined land plus ocean sink fractions produce an airborne fraction which is too high compared to observations. This bias is likely due in part to an underestimation of the ocean sink frac-tion. Our results show a significant growth in the airborne fraction of anthropogenic CO2 emissions over the coming
Correspondence to: P. E. Thornton ([email protected])
century, attributable in part to a steady decline in the ocean sink fraction. Comparison to experimental studies on the fate of radio-labeled nitrogen tracers in temperate forests indi-cates that the model representation of competition between plants and microbes for new mineral nitrogen resources is reasonable. Our results suggest a weaker dependence of net land carbon flux on soil moisture changes in tropical regions, and a stronger positive growth response to warming in those regions, than predicted by a similar AOGCM implemented without land carbon-nitrogen interactions. We expect that the between-model uncertainty in predictions of future at-mospheric CO2concentration and associated anthropogenic
climate change will be reduced as additional climate mod-els introduce carbon-nitrogen cycle interactions in their land components.
1 Introduction
atmosphere causes a net release or reduced uptake of car-bon dioxide from both land and oceans, contributing to a positive feedback that enhances radiatively-forced climate change (Matthews et al., 2007; Friedlingstein et al., 2006). These studies, however, have not included an explicit treat-ment of nutrient dynamics within land ecosystems.
Carbon uptake in land ecosystems depends on the avail-ability of nutrients such as nitrogen to support new growth, and fertilization studies show that the availability of mineral nitrogen limits primary production in many natural and man-aged ecosystems (Elser et al., 2007; Vitousek and Howarth, 1991; LeBauer and Treseder, 2008). On an annual basis, the large majority of nitrogen in new plant growth derives from the decomposition of plant litter and soil organic matter, re-sulting in a strong coupling in which heterotrophic respira-tion depends on the organic matter produced by plants, and plant growth depends on the mineral nitrogen released from organic mater during decomposition (Vitousek and Howarth, 1991; Melillo et al., 2002). Nitrogen limitation is also ex-pected to become more pronounced in some ecosystems as atmospheric CO2concentration (Ca) increases (the “progres-sive nitrogen limitation” hypothesis) (Luo et al., 2004, 2006; Reich et al., 2006).
Recent modeling results obtained by introducing prognos-tic carbon and nitrogen cycle interactions in the stand-alone land-surface component of an AOGCM (Thornton et al., 2007) or in a reduced-complexity climate model (Sokolov et al., 2008) suggest that the land-atmosphere components of the global climate-carbon cycle feedback are fundamen-tally influenced by carbon-nitrogen cycle (C-N) interactions. Thornton et al. (2007) used a land-surface component of a climate model in an uncoupled mode, forced by a reanal-ysis of historical surface weather, to demonstrate that C-N interactions significantly reduce the stimulation of net car-bon uptake on land associated with increasedCa. This re-duces a negative feedback in the regulation ofCa, and should lead to higherCa for a given level of fossil fuel consump-tion in a coupled climate-carbon cycle simulaconsump-tion. A signifi-cant reduction in simulated land ecosystem CO2fertilization
with the introduction of C-N dynamics was also reported by Sokolov et al. (2008). These two previous studies (Thornton et al., 2007; Sokolov et al., 2008) predict a 53–78% reduction of the effect of elevated CO2on land carbon sink strength due
to C-N coupling.
Thornton et al. (2007) also showed that C-N interaction fundamentally alters the land carbon cycle response to in-terannual variability in temperature and precipitation, sug-gesting that C-N coupling would also affect the land carbon cycle response to transient changes in temperature and pre-cipitation. Sokolov et al. (2008) did not examine the vari-ability issue, but found that the introduction of C-N coupling in a reduced-complexity climate model produced a change in the sign of the terrestrial carbon cycle response to warming, switching from a strong positive feedback in which warming leads to a net release of carbon from the terrestrial biosphere,
to a weak negative feedback in which warming leads to a modest uptake of carbon.
The positive feedback predicted by Sokolov et al. (2008) using the carbon-only version of their model is consistent with previous results using carbon-only models, in which radiatively-forced warming drives a net transfer of carbon from both land and oceans to the atmosphere (Matthews et al., 2007; Friedlingstein et al., 2006). For land, this positive feedback has been attributed to an increase in soil organic matter decomposition and the sensitivity of plant growth (pri-mary production) to both soil moisture status (Fung et al., 2005) and temperature (Matthews et al., 2007). Previous models include the direct dependence of decomposition on plant growth, through the supply of litter, but neglect the de-pendence of plant growth on nutrient availability (Doney et al., 2006). This leads to an incongruous representation of the carbon cycle feedback response to warming, by including the direct influence of warming on respiration and photosynthe-sis, while ignoring the influence of warming on the mineral-ization of nutrients stored in decomposing organic matter and the potential for increased nutrient availability to stimulate plant growth under conditions of nutrient limitation (Melillo et al., 2002).
In the present study we expand on earlier results by intro-ducing a prognostic representation of terrestrial carbon and nitrogen cycles within a fully-coupled AOGCM. This cou-pling provides the opportunity to examine the interactions among changes in land and ocean carbon pools, changes inCa and mineral nitrogen deposition as forced by fossil-fuel consumption, and radiatively-forced transient changes in temperature and precipitation. In addition to framing our study within a full-complexity climate model, the current work improves on the analysis of Sokolov et al. (2008) by employing a land C-N model with prognostic nitrogen in-puts and outin-puts, including inin-puts from biological nitrogen fixation and losses due to prognostic wildfire, as opposed to a specified nitrogen stock for each gridbox (Fig. 1). We use this model to evaluate land carbon and nitrogen cycle re-sponses to three factors: response to climate change driven by radiative coupling with prognostic Ca (denoted 1CC); response to anthropogenic mineral nitrogen deposition (de-noted1N D); and direct physiological response to increasing
Ca (denoted 1Ca). We assess the influence of these inter-actions on the sign and magnitude of climate-carbon cycle feedback parameters.
2 Methods
Our study uses a modified version of the Community Cli-mate System Model (CCSM), which includes ocean biogeo-chemistry and ecosystem dynamics (Moore et al., 2004), and coupled terrestrial carbon and nitrogen cycles (Thornton and Zimmermann, 2007). Using four global simulations we iso-late the effects1CC,1N D, and1Ca, including corrections for differences between simulations inCa (Friedlingstein et al., 2006). Simulations are all 230 years in length, covering the nominal time period 1870 to 2099. Fossil fuel emissions are specified identically for each simulation based on obser-vations for the historical period and following a business-as-usual scenario for future emissions. Fossil fuel, land, and ocean carbon fluxes provide boundary conditions for CO2
tracers in the atmosphere, resulting in a time-evolving (prog-nostic)Ca as a tracer which responds to all of these fluxes. Atmospheric radiative forcing responds either to this prog-nostic Ca or to a specified preindustrial value (radiatively coupled and uncoupled experiments, respectively). Mineral nitrogen deposition from the atmosphere to the land surface is forced either by a transient dataset consistent with pre-scribed fossil fuel emissions (Lamarque et al., 2005), or by a constant-in-time preindustrial dataset. In all cases land and ocean carbon fluxes respond to the prognosticCa.
2.1 Detailed methods 2.1.1 Model description
Our study uses a version of the Community Climate Sys-tem Model (CCSM) modified to include a prognostic car-bon cycle, ocean biogeochemistry and ecosystem dynamics, and coupled terrestrial carbon and nitrogen cycles. Modi-fications were applied to CCSM version 3.0 (Collins et al., 2006), using the low-resolution version of the model (Yeager et al., 2006) to reduce computational cost associated with the lengthy spin-up simulations.
Modifications to the land component (Community Land Model version 3) (Dickinson et al., 2006) include: the intro-duction of prognostic carbon and nitrogen cycles for canopy dynamics, accompanied by a new canopy integration scheme that improves the representation of sunlit and shaded canopy fractions (Thornton and Zimmermann, 2007); prognostic carbon and nitrogen cycles for the litter and soil (Thorn-ton and Rosenbloom, 2005); coupling of plant-litter-soil car-bon and nitrogen cycles (Thornton et al., 2007; Thornton and Rosenbloom, 2005); and several changes to the hydro-logic sub-model to improve partitioning of evapotranspira-tion (Lawrence et al., 2007). Detailed process descripevapotranspira-tions for the carbon and nitrogen cycle components are available (Thornton et al., 2007). The resulting land component is re-ferred to as the Community Land Model with coupled Car-bon and Nitrogen cycles (CLM-CN).
Nitrogen cycle
Atm CO2
Plant
Litter / CWD
Soil Organic Matter
Carbon cycle
Internal (fast)
External (slow)
Soil Mineral N
N deposition
N fixation denitrification
N leaching mineralization
assimilation photosynthesis
litterfall & mortality
[image:3.595.312.545.61.225.2]decomposition (i) respiration
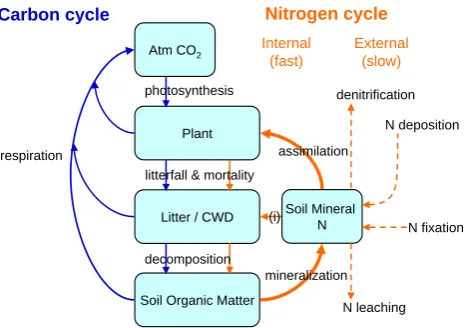
Fig. 1. Schematic illustrating feedback pathways coupling terres-trial carbon and nitrogen cycles in CLM-CN. Blue arrows show, in general, the processes represented in previous carbon-only land model components: plant carbon uptake by photosynthesis draws down atmospheric carbon dioxide (Atm CO2); litterfall and plant mortality pass biomass from plant to litter and coarse woody debris (CWD); decomposition of fresh litter generates soil organic mat-ter; respiration by both plants and heterotrophic organisms returns CO2to the atmosphere. Orange arrows show the additional pro-cesses represented in our coupled carbon-nitrogen land model, dif-ferentiated here between rapid internal cycling (solid arrows), and slower fluxes between land pools, the atmosphere, and ground wa-ter (dashed arrows). The critical feedback pathway connecting het-erotrophic respiration with plant growth is highlighted as a thick or-ange arrow: decomposition of soil organic matter not only releases CO2to the atmosphere, it also releases nitrogen from the organic matter (mineralization) in forms that can then be taken up by plants (assimilation). Plant nitrogen uptake competes with the demand for mineral nitrogen from heterotrophic organisms decomposing fresh litter (immobilization, abbreviated (i) in the Fig.).
Modification to the ocean component of CCSM3 in-cludes incorporation of the Biogeochemical Elemental Cy-cling (BEC) model, with multiple phytoplankton functional groups (diatoms, diazotrophs, smaller phytoplankton, and coccolithophores) and multiple potentially growth-limiting nutrients (nitrate, ammonium, phosphate, silicate, and iron) (Moore et al., 2002, 2004). The model allows for variable Fe/C and Si/C ratios dependent on ambient nutrient avail-ability. The ecosystem is coupled with a carbonate chemistry module based on the Ocean Carbon Model Intercomparison Project (OCMIP) (Doney et al., 2003, 2004), allowing dy-namic computation of surface oceanpCO2and air-sea CO2
flux. The vertical profile of shortwave radiation absorption in the ocean model is determined by the prognostic chlorophyll distribution from the BEC model.
2.1.2 Experimental design
Table 1. Simulation organization and naming convention. All simulations start from steady-state carbon cycle in year 1870, and all simula-tions include the same prescribed trajectory of fossil fuel emissions, creating a time-evolvingCa. All simulations include the direct physical
and biological response of land and oceans to the time-evolvingCa, but only the radiatively-coupled experiments (RN and Rn) experience the greenhouse effect of risingCaon radiative forcing in the atmosphere.
Simulation naming convention Atmospheric mineral nitrogen deposition
Anthropogenic Preindustrial (transient) (fixed)
Radiative effects of PrognosticCa RN Rn
atmospheric CO2 Prescribed (287.0 ppm) rN rn
carbon and nutrient cycling, with a particular focus on the degree to which those interactions influence the global car-bon cycle. Our experimental design focuses on two distinct aspects of the overall carbon-climate interaction: response of land ecosystems to radiatively-forced climate change (warm-ing and changes in precipitation patterns), and land ecosys-tem response to direct fertilization of growth from increasing
Caand increasing nitrogen deposition.
One potential approach to quantifying the C-N interac-tion is to perform two separate sets of simulainterac-tions, one with fully-dynamic C-N interactions and the other using a C-only model configuration. This strategy was used by Thornton et al. (2007) to explore the influence of C-N coupling of CO2
and nitrogen fertilization of land carbon uptake, and also by Sokolov et al. (2008). A disadvantage of that approach is that the inclusion or exclusion of C-N dynamics produces very different conditions for the pre-industrial steady-state control simulations. This difference in base states compli-cates the interpretation and attribution of differences in the transient ecosystem responses toCaand to radiatively forced climate change. Thornton et al. (2007) used multiple C-only simulations to constrain this problem, which for an offline simulation was not prohibitively expensive in terms of com-putation time.
We introduce here a new approach which eliminates all concerns about differences in base state, while still illumi-nating the differences between C-only and C-N dynamics most critical to the interactions with changing surface cli-mate,Ca, and nitrogen deposition. In addition to the N satu-ration mechanism used in Thornton et al. (2007) to emulate the behavior of a C-only model, CLM-CN also includes (on every time step, at every grid cell, and for every sub-grid vegetation type) a calculation of the potential gross primary production (GPP) that could occur in the absence of nutri-ent limitation, given the ecosystem state at that point in time. The calculation of potential GPP is used in conjunction with a dynamic allocation algorithm to express the plant demand for new mineral N. Following the calculation of mineral N supply and the N demand of microbial communities, plant-microbe competition is reconciled and an actual GPP is cal-culated, reflecting the influence of N limitation. Differences
between potential and actual GPP are driven exclusively by the dynamics of N availability, while every other physical and biogeochemical aspect of the land model simulation is maintained in an identical state.
Following model spinup to preindustrial steady-state con-ditions (details in Sect. 2.1.3), a long (1000-year) preindus-trial control simulation was performed, during which the cli-mate as well as ocean and land carbon and nitrogen cycles were stable (unpublished results). The control simulation was followed by four simulation experiments. All experi-ments include prescribed fossil fuel emissions, using histori-cal data for the period 1870–1999 with modifications from a previously published dataset (Andres et al., 1996), and emis-sions from the SRES A2 scenario for the period 2000–2099 (Nakicenovic and Swart, 2000). Revisions of the histori-cal emissions data were performed by Andres (unpublished), and include updates for the period 1990–2003, and modifi-cations for one degree geography and raw carbon emissions data for earlier years.
In all experiments fossil fuel, land, and ocean carbon fluxes provide boundary conditions for CO2tracers in the
at-mosphere, whereCais a tracer which responds to all of these fluxes. Land and ocean carbon fluxes in all cases respond to this prognosticCa. Calculations of radiative transfer in the atmosphere respond either to the prognosticCa(“radiatively coupled” experiments) or to a fixed preindustrial value (“ra-diatively uncoupled” experiments). Experiments also differ in their treatment of nitrogen deposition, using either a tran-sient dataset that represents the anthropogenic influence or a fixed preindustrial distribution. Organization and naming conventions for the four experiments are given in Table 1.
All simulations for this study use a constant representa-tion of land cover (see Sect. 2.5), and so also exclude the representation of carbon fluxes associated with changes in land cover or land use. Previous coupled climate-carbon cycle simulations with AOGCMs have also used constant land use patterns but have specified assumed fluxes due to land use and land cover change (LULCC) as external forc-ing (Friedlforc-ingstein et al., 2006). Imposforc-ing LULCC fluxes as an external forcing factor ignores interactions among dis-turbance, CO2fertilization, and nitrogen availability known
to influence modeled net carbon flux responses (Thornton et al., 2002). Here we are interested in addressing the C-N in-teractions in the absence of potentially confounding anthro-pogenic disturbance effects. We recognize that this exper-imental design hampers direct comparison of our results to measuredCa, and we have tried to mitigate this problem by focusing evaluation efforts on land, ocean, and airborne frac-tions (see Sect. 2.6).
2.1.3 Model spinup
To reduce the magnitude of drifts in the carbon pools when carbon and nitrogen are coupled to the climate of the AOGCM, a sequential spin-up procedure is employed, simi-lar to a previously described procedure (Doney et al., 2006). The land carbon components are spun-up to an approximate preindustrial steady-state, using a repeated 25-year cycle of near-surface weather fields saved from a previous coupled simulation. Initial spinup of carbon and nitrogen pools in the land model follows the accelerated decomposition approach described in Thornton and Rosenbloom, 2005. Surface forc-ing for the initial ocean spinup is from an observationally based climatology (Large and Yeager, 2004), withCa held at a fixed preindustrial value. The ocean spinup was run for 1000 years with no tracer acceleration.
Land and ocean states following preliminary spinup sim-ulations are not necessarily in balance with the climate of the fully-coupled system. A fully-coupled simulation (Sim0) is performed for a few hundred years to get past any initial transients, to assess the potentially offsetting fluxes between land, atmosphere, and ocean, and to generate a climatology ofCafor use in subsequent coupling steps.
Several incremental coupling steps are performed to bring the system efficiently to a stable initial condition. First, a coupled run is done whereCais allowed to vary, but is only forced by air-sea CO2fluxes (Sim1). This enables the
neg-ative feedback between air-sea CO2 fluxes and Ca, effec-tively shortening the equilibration time of the ocean. For the present simulations, the 150-year running mean of the air-sea CO2flux was less than 0.01 PgC y−1after 450 years
in this configuration. Next, the land model is run again in an offline configuration (Sim2), using a repeated 25-year cy-cle of near-surface weather fields saved from Sim1. Sim2 uses the climatology ofCafrom Sim0, adjusted to have the same over-ocean mean to which the ocean is equilibrated in
Sim1. Sim2 is run until the land state is equilibrated with the new sample of coupled climate and the new climatology ofCa (1800 years in the present case). The land state from Sim2 and the ocean state from Sim1 are next used to initi-ate a new coupled run (Sim3), withCa responding to both land and ocean fluxes, but with atmospheric radiative forcing responding to a specified (preindustrial) CO2concentration.
After 200 years, atmospheric radiative forcing is allowed to respond to the prognosticCa.
2.2 Evaluation of forcing factors
Our experiments are analyzed to isolate the effects of radiatively-forced climate change, anthropogenic nitrogen deposition, and increasingCa(1CC,1N D, and1Ca, respec-tively). In calculating 1CC and 1N D, we correct for dif-ferences inCa between pairs of experiments, following the “beta-correction” method (Friedlingstein et al., 2003, 2006). For a generic flux or state variable time series,f (t ):
1CCf (t )= fcoupled(t )−funcoupled(t )
−βf Ca,coupled(t )−Ca,uncoupled(t ) (1) wherefcoupled(t )andCa,coupled(t )are from experiment Rn,
funcoupled(t ) and Ca,uncoupled(t ) are from experiment rn, and βf is the dependence of f on Ca (df/dCa) from a radiatively-uncoupled experiment. Likewise, for1N D:
1N Df (t )= fanthroN D(t )−fpreindN D(t )
−βf Ca,anthroN D(t )−Ca,preindN D(t )
(2) where fanthroN D and Ca,anthroN D are from experiment rN, andfpreindN D and Ca,preindN D are from experiment rn. In practice, we calculateβf as the regression slope of the time seriesf (t )vs.Ca(t )from experiment rn.
Time series of effects on carbon fluxes due to increasing
Caare calculated as:
1Caf (t )= fF F(t )−fF F,0 (3)
where fF F(t ) is from a radiatively uncoupled simulation with prescribed fossil fuel emissions (our experiment rn), andfF F,0is the mean flux from the first decade of
experi-ment rn, when fossil fuel fluxes are very small. Combined effects of1CC,1N D, and1Caare evaluated as the change over time in simulation RN, by subtracting the mean of the first decade of simulation from the entire time series. 2.3 Temperature and soil moisture effects on land
carbon fluxes
For each grid cell, multiple linear regression is used to evalu-ate the partial contributions of changing near-surface air tem-perature over land (Tair) and changing soil moisture on
sev-eral land carbon flux components. Soil moisture is expressed as an empirical moisture scalar, Btran, with values ranging
influence of radiatively forced climate change for flux com-ponentf,as well as the influence of radiative coupling on
Tair(1CCTair) andBtran(1CCBtran) using Eq. (1). The time series of1CCf is regressed against time series of1CCTair
and 1CCBtran, using annual values for the period 2000–
2099 (n=100). Flux components (f) evaluated include po-tential gross primary production (popo-tential GPP), defined as the model-estimated GPP prior to nitrogen limitation, actual GPP, defined as model-estimated GPP following the calcula-tion of nitrogen limitacalcula-tion, total ecosystem respiracalcula-tion (ER), fire (total carbon loss to atmosphere during combustion), and net ecosystem exchange of carbon (NEE=−GPP+ER+fire). 2.4 Transient feedback analysis
We use the analytical framework for diagnosis of climate-carbon cycle feedback as presented in Friedlingstein et al. (2003, 2006), but modified to allow an examination of transients in feedback parameters. An endpoint analysis was used by Friedlingstein et al. (2006), where single summary values of the feedback parameters were based on differences between the values of carbon and temperature state variables at the beginning and end of their simulations. This provided a single estimate of the feedback parameter values, applica-ble to the entire simulation period. Here we are interested also in the temporal variation in the feedback parameters, so we use a somewhat different method and compare results to those obtained with the original method by Friedlingstein et al. (2006). For our transient analysis, we use a moving win-dow, unweighted regression to calculate the relevant slopes. At each annual timestept, wheret≥120, the previous 120 years of data from the global summaries is used as input to a least-squares regression (n=120) to estimate the feedback pa-rameters at timet as the regression slopes. All other aspects of the analysis are as described previously (Friedlingstein et al., 2003, 2006), including the use of simulation differencing to isolate the effects of increasingCaand radiatively-forced climate change on carbon uptake. Overall climate-carbon cy-cle feedback strength, denoted gain (unitless) is defined as:
gain=−α (γL+γO)
(1+βL+βO) (4) whereα(K ppm−1) is the transient sensitivity of the climate model to increasedCa,βLandβO(PgC ppm−1) are the car-bon storage sensitivities toCa for land and ocean, respec-tively, andγLandγO(PgC K−1) are the carbon storage sen-sitivities to climate for land and ocean, respectively. The fol-lowing expressions are used to calculate components of gain, following Friedlingstein et al. (2003, 2006):
α=dTref coupled
dCa coupled
, (5)
βL=
dTotCLuncoupled
dCauncoupled
andβO=
dTotCO uncoupled
dCa uncoupled
, (6)
γL=
dTotCL∗ coupled
dTref coupled andγO=
dTotCO∗ coupled
dTref coupled , (7)
TotCL∗ coupled=TotCLcoupled−βL
Ca coupled−Ca uncoupled and TotCO∗ coupled
=TotCO coupled−βO Cacoupled−Ca uncoupled (8)
whereTref coupledandCa coupledare the global mean air
tem-perature at the model reference height (K) and the global meanCa(ppm), respectively, from a radiatively coupled ex-periment, Ca uncoupled (ppm) is the global mean Ca from a radiatively uncoupled experiment, TotCLuncoupled and
TotCO uncoupled(PgC) are the global total carbon content on
land and in oceans, respectively, for a radiatively uncoupled experiment, TotCLcoupled and TotCO coupled (PgC) are the
global total carbon content on land and in oceans, respec-tively, for a radiatively coupled experiment, and the notation
dy
dx refers to the slope from the moving window regression of
yagainstx, as described above.
A positive value for gain corresponds to a net (ocean and land) positive climate-carbon cycle feedback by which warming stimulates carbon release and an increase in Ca which increases warming, while a negative value of gain corresponds to a negative net feedback by which warming stimulates uptake and a decrease in Ca which suppresses warming. Analysis of previously published modeling re-sults used archived annual global summaries of output from the eleven models included in the recent C4MIP synthesis (Friedlingstein et al., 2006) (http://www.c4mip.cnrs-gif.fr/ diagnostics phase2.html).
2.5 Treatment of landcover
All results reported here use a fixed description of landcover, taken as a time slice circa 1870 from a transient plant func-tional type (PFT) dataset. The transient PFT dataset is cre-ated in two steps. First, a potential vegetation PFT dataset is created based on information about present-day PFT dis-tribution and estimates of potential biome types of vegeta-tion (Ramankutty and Foley, 1999). Second, estimates of crop land fraction (Ramankutty and Foley, 1999) and grazing (Goldewijk, 2001) are used to determine the crop PFT distri-bution through time. It is important to note that because our present simulations have prescribed landcover for the year 1870, they do not include the effects of changing landcover on carbon, nitrogen, water, or energy fluxes. Additional sim-ulations are underway to evaluate the influence of changing landcover on carbon fluxes and C-N interactions.
2.6 Airborne fraction, land sink fraction, and ocean sink fraction
anthropogenic emissions (aE) as the annual change in the carbon stock of the atmosphere expressed as a fraction of the annual total anthropogenic emissions. For our simulations emissions due to land use and land cover change are assumed to be zero, and the anthropogenic emissions consist only of fossil fuel sources. Land and ocean sink fractions (sE,lndand sE,ocn, respectively) are calculated as the annual changes in
total land or ocean carbon stocks as fractions of the annual total anthropogenic emissions. Growth rates for the airborne fraction (r(aE)), land sink fraction (r(sE,lnd)), and ocean sink
fraction (r(sE,ocn)), expressed as % change per year, are
cal-culated as the regression slopes of the log-transformed time series.
2.7 Nitrogen deposition
Nitrogen deposition rates for the period 1870 to 2100 are from the three-dimensional chemistry-transport MOZART-2 (Model for Ozone and Related Tracers, version 2) (Horowitz et al., 2003). In all simulations (pre-industrial, present-day and future), MOZART uses meteorological datasets valid for the period of interest, based on simulations by the Parallel Climate Model (Washington et al., 2000). The MOZART-2 simulations are performed at a horizontal resolution of 2.8◦. All the dynamical and chemical processes simulated by MOZART-2 are performed with a model timestep of 20 min, while the nitrogen deposition fluxes are archived as monthly averages. Additional information on the present-day and fu-ture simulations is available (Lamarque et al., 2005). The pre-industrial simulation is similar to the present-day sim-ulations, except that all emissions associated with anthro-pogenic activities (excluding biomass burning) are explic-itly set to 0. Nitrogen deposition from the MOZART-2 pre-industrial simulation is used for the CLM-CN spin-up simu-lation.
2.8 Fate of additional N
The anthropogenic N deposition experiment (experiment rN, Table 1) provides an opportunity to evaluate the modeled fate of new mineral N additions against results of15N tracer ex-periments. By quantifying and evaluating the fate of added N, we are also able to assess whether the model predictions of carbon storage associated with increases in soil organic mat-ter (low C:N ratio) or increases in wood (high C:N) follow observed patterns. The influence of N deposition was diag-nosed by tracking the changes in N storage in land ecosystem pools as well as cumulative fluxes into and out of the land ecosystem. Results were compared with observations from a
15N tracer study carried out at Harvard Forest (Nadelhoffer
et al., 2004) by extracting information from the nearest point in the global grid. Coordinates of the study site are 42◦300N, 72◦100W. Center coordinates for the model grid box contain-ing this site are 42◦410N, 71◦150W, and the dimensions of the grid box at this location are 3.71◦latitude×3.75◦longitude.
The vegetation cover for this gridcell in the model is dom-inated by trees, with a mixture of temperate deciduous and temperate needleleaf evergreen forest, in general agreement with the presence of oak and pine stands in the tracer study. The influence of anthropogenic nitrogen deposition was iso-lated from the effects of varyingCaby differencing the two radiatively uncoupled experiments: rN–rn (Table 1).
3 Results
Under the IPCC A2 business-as-usual scenario for fossil fuel emissions we estimateCaof 884 ppm by year 2100 AD in our radiatively-uncoupled experiment (Fig. 2a). Radiative coupling reducesCaby about 6 ppm, with a further reduction of about 27 ppm due to anthropogenic N deposition (Fig. 2b and c). Levels ofCain our results may be underestimated, as our simulations do not yet include carbon flux contributions from historic or predicted future landcover change.
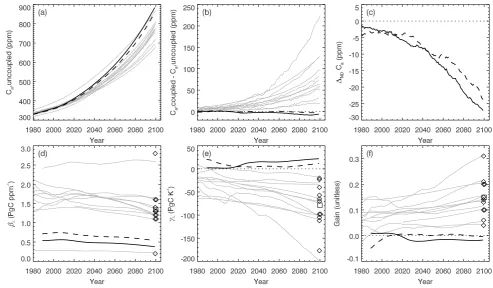
We find that the response of land carbon storage to in-creasingCa(βL) is approximately three times lower than the mean response from previous coupled models lacking a ni-trogen cycle (Fig. 2d). Previous results from the uncoupled land model show that this reducedβL is due mainly to the introduction of C-N interaction (Thornton et al., 2007), and results here from the fully-coupled model are in quantitative agreement, in spite of known biases in the coupled climate. The influence of C-N interaction onβL reported in Thorn-ton et al. (2007) and shown here for the case of coupling to a GCM has also been recently demonstrated by Sokolov et al. (2008) for land model C-N coupling in a climate model of intermediate complexity.
The land carbon storage response to radiatively forced cli-mate change, characterized as the sensitivity to increasing temperature (γL), is small and positive throughout the 21st century in our results, the opposite sign compared to all pre-vious studies using carbon-only models (Fig. 2e), but the same sign and similar magnitude as in Sokolov et al. (2008) for C-N land component in a reduced-complexity climate model. We also find thatγLincreases modestly over the pe-riod 2000–2100 in our results, while it declines over the same period in previous studies (Fig. 2e).
Fig. 2. Predicted atmospheric CO2and climate-carbon cycle feedback parameters. Cafrom uncoupled experiments (a); difference inCa
due to radiative coupling (b); difference inCadue to anthropogenic nitrogen deposition (c); land biosphere response to increasingCa(d);
land biosphere response to increasing temperature (e); and overall global climate-carbon cycle feedback gain (f). Gray lines show archived results from eleven previous studies (Friedlingstein et al., 2006). In all panels except (c), thick solid line is for experiments with preindustrial nitrogen deposition, thick dashed line for anthropogenic nitrogen deposition. In (c), solid and dashed lines are for radiatively uncoupled and coupled experiments, respectively. Diamonds show the feedback parameters estimated at year 2100 for previous studies (Friedlingstein et al., 2006) and square shows their mean. Thin dotted lines indicate zero response.
Fig. 3. Atmosphere and ocean feedback parameters. Climate sensitivity to increasingCa(α) (a); ocean carbon cycle sensitivity toCa(βL)
(b); and ocean carbon cycle sensitivity to climate (γO) (c). In all panels thick solid line is for present experiments with preindustrial nitrogen
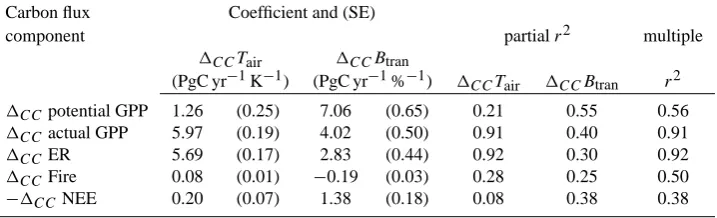
[image:8.595.64.532.460.614.2]Table 2. Influence of temperature and soil moisture on carbon flux components. Multiple linear regression results for1CC of global
total carbon flux components (PgC yr−1) predicted by1CCof global mean surface temperature over land (Tair, K) and global mean plant-available soil water scalar (Btran, converted from proportion (0–1) to 0–100%). Net ecosystem exchange of carbon (NEE, normally negative for uptake on land) has been reversed in sign for this analysis, so that the regression coefficients have the same sense as for GPP. All coefficients are significant at the 95% confidence level. SE: standard error.
Carbon flux Coefficient and (SE)
component partialr2 multiple
1CCTair 1CCBtran
(PgC yr−1K−1) (PgC yr−1%−1) 1CCTair 1CCBtran r2
1CCpotential GPP 1.26 (0.25) 7.06 (0.65) 0.21 0.55 0.56
1CCactual GPP 5.97 (0.19) 4.02 (0.50) 0.91 0.40 0.91
1CCER 5.69 (0.17) 2.83 (0.44) 0.92 0.30 0.92
1CCFire 0.08 (0.01) −0.19 (0.03) 0.28 0.25 0.50
−1CCNEE 0.20 (0.07) 1.38 (0.18) 0.08 0.38 0.38
Simulated ocean carbon stock declines by 35 PgC under the influence of radiatively forced climate change over the period 1870–2100. That decline is more than offset by a net increase of 47 PgC on land over the same period, leading to a small negative climate-carbon cycle feedback gain at year 2100, the opposite sign compared to all previous AOGCM studies (Fig. 2f). TheβL,γL, and gain responses all shift to-ward the carbon-only means under1N D (Fig. 2d–f, dashed lines) as nitrogen limitation is partially relieved by anthro-pogenic N deposition, providing initial evidence that C-N in-teraction is an important factor driving the observed differ-ences from previous models. The influence of anthropogenic N deposition on the feedback parameters mainly conforms to the geographic distribution of the increased deposition (re-sults not shown).
Using a transient feedback analysis, we estimate the in-fluence of C-N coupling onCa in year 2100 by substitut-ing feedback parameter values calculated from the C4MIP archive (Friedlingstein et al. 2006), using multi-model mean parameters as well as single-model parameter substitution from the predecessor C-only CCSM model (CCSM1). Re-duced land CO2fertilization (smallerβL) with the introduc-tion of C-N coupling increasesCa by on average 104 ppm (range +65 to +178 ppm). Stimulation of carbon uptake un-der a warming climate (positiveγL) reducesCa on average 82 ppm (range−133 to−35 ppm). These two effects of C-N coupling together increaseCa on average 16 ppm (range +32 to−8 ppm). Anthropogenic nitrogen deposition gener-ates a land sink of 66±5 PgC over the period 1870–2099, reducingCaby 25±2 ppm with an associated decrease in the ocean sink of 12±2 PgC. Ranges in the nitrogen deposition-driven sink reflect differences between our radiatively cou-pled vs. uncoucou-pled experiments.
Spatial and temporal patterns of 1CC for temperature and soil moisture are similar to results found previously for CCSM3 (Meehl et al., 2006) (Fig. 4 a–d). CLM-CN
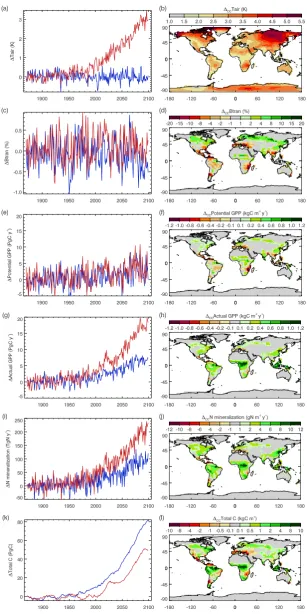
calcu-lates gross primary production (GPP) prior to and following nitrogen limitation at each model timestep (potential GPP and actual GPP, respectively). Any differences between po-tential GPP and actual GPP are directly attributable to the influence of nitrogen limitation in the model, allowing a sys-tematic diagnosis of nitrogen limitation effects on GPP under various forcings. The1CCactual GPP at year 2100 is nearly six times larger than1CC potential GPP (17 vs. 3 PgC y−1) (Fig. 4g and e). Spatial pattern of1CC potential GPP fol-lows closely the pattern of changes in plant-available soil water (1CCBtran) (Fig. 4f and d), consistent with previous re-sults from a carbon-only model (Fung et al., 2005).1CC ac-tual GPP is more uniformly positive, with decreases only in small regions with the most extreme decreases in soil mois-ture (Fig. 4h).
Introduction of nitrogen limitation greatly increases the positive correlation of 1CC GPP with 1CCTair, and
de-creases the positive correlation with1CCBtran(Table 2 and
Fig. 5a–d). Climate-driven change in nitrogen mineralization (1CCNmin, Fig. 4i and j) is significantly correlated with1CC actual GPP and1CCTair(Figs. 5i and 6). IncreasingNminis
driven by direct nitrogen fertilization for the case of1N D and by climate-driven increase in heterotrophic respiration for the case of1CC, but we find that the ratio of increased actual GPP to increasedNminis similar in both cases (Fig. 4i and g).
[image:9.595.120.479.134.243.2]Fig. 4. Effects of radiative coupling and nitrogen deposition. Time series show global means (forTairandBtran) or global totals (for all other quantities) of1CC (red lines) and1N D(blue lines). Maps show1CCaveraged over the final decade of simulation (2090–2099). Panels
Fig. 5. Multiple regression coefficients for1CCof individual carbon flux components ((a–h), upper color scale) and nitrogen mineralization
(i) and (j), lower color scale) predicted by1CCTair and1CCBtran. Land gridcells with non-significant coefficients (at 95% confidence
level) are white.
carbon-only studies which predicted losses of carbon related to drying soils in these same regions (Fung et al., 2005; Friedlingstein et al., 2006). We find that soil moisture sen-sitivity causes carbon losses in a few regions with the most extreme drying, including Central America and the Mediter-ranean region (Fig. 4l and d).
The increase in total carbon for1CC is caused by an in-crease in vegetation biomass that is partly offset by declining stocks of litter and soil organic matter (Fig. 7a and b). This result is consistent with the hypothesis that, with warming, nitrogen mineralization from enhanced decomposition
im-proves plant nitrogen availability and increases primary pro-duction (Stieglitz et al., 2006; McGuire et al., 2000; Arain et al., 2006; M¨akip¨a¨a et al., 1999; Melillo et al., 2002). We find that1N D increases both soil organic matter and vegetation carbon pools, consistent with recent analyses of carbon up-take under nitrogen fertilization and increasingCa(de Graaff et al., 2006; van Groenigen et al., 2006; Gill et al., 2006).
Fig. 6. Scatterplots of1CCGPP vs.1CCNmin (a),1CCNmin vs.1CCHR (b), and1CCHR vs.1CCTair(c). Plots are based on global total flux or global mean temperature over the period 2000–2099 (n=100).
Fig. 7. Changes (due to multiple factors) in global total land carbon stocks for litter and soil organic matter (a), and vegetation (b), and in global mean nitrogen availability index (c). In all panels1CCis shown in red,1N Din blue,1Ca in green, and (1CC+1N D+1Ca) in
gray.
2006). As expected,1N Dresults in increased nitrogen avail-ability (Fig. 7c, blue line). The influence of1CC on ni-trogen availability has the same sign as1N D, and a larger magnitude (Fig. 7c, red line), consistent with our hypothe-sis that radiatively-forced climate change increases the sup-ply of mineral nitrogen to plants. The progressive nitrogen limitation with1Ca in our results is largely mitigated but not completely compensated for by the combination of1N D associated with combustion of fossil fuel (Lamarque et al., 2005) and indirect fertilization due to the influence of1CC on nitrogen mineralization (Fig. 7c, gray line).
3.1 Airborne, land sink, and ocean sink fractions Total airborne fraction of anthropogenic CO2emissions (aE) over the period 1959–2006 in our experiment RN (radiative coupling and anthropogenic N deposition) is 0.56 (Table 3). Raupach et al. (2008) reportaE=0.43 for the same period, while Sabine et al. (2004) give a range foraEof 0.41 to 0.53, with uncertainty arising mainly from assumptions about land use emissions. Our estimates for the land and ocean sink
fractions over this period (0.19 and 0.25, respectively, Ta-ble 3), are individually within the range of estimates from Sabine et al. (2004) (0.10 to 0.41 for the land sink fraction, and 0.18 to 0.36 for the ocean sink fraction), but together they produce an airborne fraction that is outside the range from observations: one or the other, or possibly both, of our sink fraction predictions is too low. Evaluation of the ocean sink against independent observations suggests that the ocean sink strength is too weak, due to weak forma-tion and ventilaforma-tion of intermediate waters in the Southern Ocean (Appendix A). Evaluation of land ecosystem produc-tivity from a similar version of the model indicates a low pro-ductivity bias at high latitudes (Thornton and Zimmermann, 2007), which could lead to a low bias in the land sink strength through an underestimate of the global productivity.
[image:12.595.86.505.260.387.2]Table 3. Airborne fraction, land and ocean sink fractions, and their growth rates. Means and standard deviations over several time periods are shown for the total airborne fraction (aE), land sink fraction (sE,lnd), and ocean sink fraction (sE,ocn). Also shown are the proportional growth rates (% y−1) for airborne fraction (r(aE)), land sink fraction (r(sE,lnd)), and ocean sink fraction (r(sE,ocn)). Proportional growth rates shown in bold are significant at the 95% confidence level.
mean (std. dev) proportional growth rate, % y−1
Time period aE sE,lnd se,ocn r(aE) r(sE,lnd) r(sE,ocn)
1959–2006 0.56(0.10) 0.19(0.11) 0.25(0.03) 0.12 −0.76 0.64
1959–2099 0.60(0.08) 0.18(0.07) 0.23(0.03) 0.16 −0.05 −0.23
2000–2099 0.61(0.05) 0.17(0.04) 0.22(0.03) 0.22 −0.24 −0.43
2000–2050 0.58(0.04) 0.18(0.03) 0.24(0.02) 0.10 0.22 −0.37
2050–2099 0.64(0.04) 0.16(0.03) 0.20(0.02) 0.30 −0.39 −0.66
1960 1980 2000 2020 2040 2060 2080 2100 year
0.0 0.2 0.4 0.6 0.8
airborne and sink fractions
airborne fraction ocean sink fraction land sink fraction
Fig. 8. Simulated airborne fraction, ocean sink fraction, and land sink fraction plotted over the period 1959–2099. Fractions calcu-lated each year as the ratio of the annual increase in the carbon content of the respective pool (atmosphere, ocean, or land) divided by the annual total anthropogenic emissions.
and land cover conversions (McGuire et al., 2001; Friedling-stein et al., 2006). This method does not in any way cap-ture the modeled terrestrial ecosystem response to the distur-bances implicit in the land use and land cover change. These responses have been shown, however, to be an important driver of net land carbon fluxes and to have significant in-teractions with changing CO2and N deposition (Thornton et
al., 2002). In particular, the standard approach does not cap-ture the influence of prior disturbance on present-day carbon uptake for forests re-establishing on abandoned agricultural land, which is suggested to be an important component of the total land sink in temperate regions (Pacala et al., 2001). In-troducing a mechanistic treatment of land cover change could either reduce the predicted land sink fraction through reduc-tion in forest area or increase the land sink fracreduc-tion by
shift-ing forests to younger age-class structures. We are explor-ing this and other C-N-disturbance interactions as a separate study.
In the absence of anthropogenic nitrogen deposition (ex-periment Rn)aEover the period 1959–2006 is 0.59. Relative to the case with anthropogenic nitrogen deposition, the land fraction drops to 0.14, with a compensating increase in the ocean fraction to 0.27. For the period 2050-2099 in the ab-sence of anthropogenic N deposition the airborne, land, and ocean fractions are 0.67, 0.13, and 0.2, respectively.
Our model predicts a significant growth in the airborne fraction (r(aE)) of 0.22% y−1over the period 2000–2099, at-tributable to declining sink fractions for both land and ocean over this period (Table 3 and Fig. 8). Growth rate for the airborne fraction is lower (0.12% y−1) over the period 1959– 2006, but the result is not significant at the 95% confidence level. Raupach et al. (2008) estimater(aE)=0.24% y−1over the period 1959–2006. Variability in aE is driven mainly by variability in the land sink fraction (sE,lnd) in our results
(Fig. 8), with variability decreasing over time. Our results suggest a significant increase in the airborne fraction growth rate in the latter half of the 21st century. This appears to be the result of a steadily declining ocean sink fraction over the 21st century and a declining land sink fraction over the pe-riod 2050–2099 (Fig. 8), although the decline in land sink fraction is not significant at the 95% confidence level (Ta-ble 3).
3.2 Fate of additional N
Our results for the region around the Harvard Forest study site show a 30-40 year lag between the onset of anthro-pogenic N deposition (new mineral N input) and increased losses due to denitrification (Fig. 9a and b). Cumulative den-itrification losses grow rapidly to 50% of cumulative new in-puts after 40–50 years, and eventually stabilize close to 75% of cumulative new inputs (Fig. 9b).
[image:13.595.51.284.254.444.2]2112 P. E. Thornton et al.: Carbon-nitrogen interactions regulate climate-carbon cycle feedbacks
Figure 9.
Fig. 9. Comparison of modeled and observed fate of new mineral N introduced by anthropogenic N deposition near Harvard Forest. An-nual mineral anthropogenic N deposition and cumulative anthropogenic N deposition over the period 1890–2099 (a). Cumulative deni-trification as a % of cumulative anthropogenic N deposition (Ndep) (b). Anthropogenic nitrogen deposition stored in soil organic matter (SOM)+litter+coarse woody debris (CWD) and stored in vegetation, shown as % of cumulative ecosystem N sink (c). Anthropogenic nitro-gen deposition stored in wood, as a % of total vegetation sink for new nitronitro-gen (d). Observed ranges shown as gray bars in cC and d (see text).
additional N is accumulating in soil (results not shown). The differencing of two independent coupled climate simulations required to extract the N deposition signal makes it difficult to quantify the fraction of new input N that accumulates in vegetation during the early years of the simulation – the sig-nal is overwhelmed by variability due to independent climate realizations. After about 90 years the anthropogenic N depo-sition signal is strong enough to begin to resolve the accu-mulation in vegetation vs. litter and soil pools, and also to resolve the fractions accumulating in woody vs. non-woody vegetation pools. Over the period 1980–2100 the fraction of increased N stocks accumulating in vegetation varies in the range 4-25%, with generally higher values early in that pe-riod and lower values later (Fig. 9c). The large majority of new N stocks are still accumulating in soil organic matter during this period. Of the new N accumulating in vegeta-tion, the contribution of woody biomass increases over time
from 40% for the period 1980–1999 to 70% for the period 2080–2099 (Fig. 9d).
[image:14.595.101.495.62.395.2]tissue over time, at least in their control plots where the rates of background nitrogen deposition (reported in Nad04 as 0.8 gN m−2y−1) are in excellent agreement with our mod-eled N deposition rates at present day for this region (Fig. 9a).
4 Discussion
4.1 Influence of C-N coupling on Ca
We predict that introduction of C-N interactions in the land component of a coupled climate-carbon cycle AOGCM causes a reduction in terrestrial carbon sink strength under increasingCa, which is only partly offset by the N-mediated reversal of the land response to radiatively-forced climate change from a net source to a net sink. The overall ef-fect of C-N interaction in the current model results is to re-duce the fraction of anthropogenic emissions stored in land ecosystems, compared to models lacking C-N interactions. Since our simulation did not include any influence of chang-ing landcover, it is likely that the present model configura-tion would result in a significantly higherCaby the end of the 21st century under a business-as-usual scenario for fossil fuel and land use emissions, compared to previous coupled climate-carbon cycle modeling results.
Significant interactions among increasing Ca, anthro-pogenic N deposition, and disturbance history have been documented through site-level measurements and model-measurement comparisons (Ollinger et al., 2002; Thornton et al., 2002; Goodale and Aber, 2001), and we expect that C-N interactions will strongly influence global-scale predictions of net greenhouse gas emissions due to changing land use and land cover. Previous coupled climate system model results found a reasonable match to present-dayCa for some mod-els with much largerβL than predicted here (Friedlingstein et al., 2006). Strong land uptake due to CO2-fertilization in
those models is partly balanced by carbon emissions from landuse change. These earlier simulations used a simple pre-scribed deforestation carbon source term, and did not include the dynamics of land use change and the potential for evolv-ing sources and sinks related to land use history. In particular, we expect that mid-latitude carbon sinks due to reforesta-tion on abandoned agricultural land may help to offset the low CO2fertilization effect in our C-N coupled land model
(Pacala et al., 2001; Hurtt et al., 2006; Stephens et al., 2007). We are currently exploring these interactions.
The magnitude and sign of the overall climate-carbon feedback (gain) predicted here depends on the magnitude and sign of the feedback components as given in Eq. (4). A low value of the transient climate sensitivity to greenhouse gas forcing (α) compared to previous studies tends to reduce the magnitude of gain, regardless of its sign. Ifαis found to have a low bias in this model, the overall negative climate-carbon cycle feedback may have a larger magnitude than predicted here, which would lead to reduction inCa. However, the
negative sign of gain is due to the fact that the small posi-tive value forγL is able to cancel the small negative value forγO. We note thatγO here (−10 PgC K−1) is smaller in magnitude than any of the C4MIP models (Fig. 3c) (range:
−16 to−67 PgC K−1). If the magnitude ofγO is too low, the modest positive value forγL suggests that the true gain may be positive, which would result in higher values forCa. If βO is biased low, as suggested by comparison to other models (Fig. 3b) and comparison against ocean tracers (Ap-pendix A), then the magnitude of gain may be overstated, whatever its sign.
While our current model does include gaseous nitrogen losses from soil as an important process regulating the long-term accumulation of nitrogen stocks, we are not presently accounting for the greenhouse forcing consequences of N2O
emissions. We expect these emissions to scale approximately with total decomposition, and so in general to increase under a warmer climate with more active heterotrophic respiration. 4.2 Representation of nutrient limitations in the tropics An important source of uncertainty for the results presented here has to do with the nature and extent of limitation from nutrients other than nitrogen, and particularly the role of phosphorus limitation in tropical forests. The meta-analysis by LeBauer and Treseder (2008) of nitrogen addition exper-iments shows that N limitation is observed in both upland and lowland tropical forests. In conjunction with additional meta-analysis of combined N and P experiments (Elser et al., 2007) it appears that lowland primary tropical forest is likely more limited by P than by N availability, while lowland sec-ondary and upland forest may exhibit the same degree of N-limitation as observed in temperate forest.
A critical issue is whether the prediction of C-climate feedbacks in the lowland primary tropical forest ecosystem is approximated better by the introduction of C-N interac-tions, or by leaving out the C-nutrient interactions altogether. In Thornton et al. (2007) we set forward the hypothesis that inclusion of C-N dynamics might be a reasonable first-order approximation for both N and P limitations. Since the short-term (years to decades) availability of both N and P incorpo-rated into annual plant growth is dictated mainly by the rate of decomposition of soil organic matter and the associated mineralization of previously organically bound nutrients, we suggest that N limitation serves as a useful lower-bounding nutrient limitation proxy for the case of ecosystems where the P limitation is dominant, or with N-P colimitation.
have tried to mitigate against the possibility of severe biases in this direction by incorporating a prognostic calculation of biological N fixation (BNF) into CLM-CN. This formulation captures the first-order dependencies of BNF on climate and carbon availability by making BNF a saturating function of net primary production (Thornton et al., 2007).
4.3 Influence of C-N interactions on model uncertainty In spite of the potential biases discussed above, we expect that the uncertainty in previous estimates ofβL,γL, and gain (Friedlingstein et al., 2006) (Fig. 2d–f) would be significantly reduced if explicit C-N interactions were introduced in other models. This expectation is based on the following consid-eration of the sign of the effect of C-N interactions on the feedback components and the logical bounds on those pa-rameters.
We consider any reasonable estimate ofβLto be bounded below by zero, since there is no evidence suggesting that in-creasingCa could lead to a global-scale reduction in land carbon storage. We posit that introduction of any new con-straint on vegetation growth response, such as an explicit de-pendence on nitrogen availability to support new growth, can only produce a reduction in the estimated response of land carbon uptake to CO2fertilization. So introduction of C-N
coupling in a model that previously considered only the car-bon cycle will lead to a reducedβL. The range of estimates forβLshown in Fig. 2d will therefore be compressed as more models introduce an explicit treatment of nitrogen limitation, leading to a smaller range in predicted land carbon uptake under a common emissions scenario.
There is not an obvious logical bound on the sign of the land carbon storage response to radiatively-forced climate change, as evidenced by the spatial variability in the sign of the response demonstrated for both carbon-only (Fung et al., 2005) and carbon-nitrogen model results (Fig. 4l). We do expect, however, that a general response to introduction of C-N coupling will be an increased dependence of primary production on heterotrophic respiration. This should damp the tendency, demonstrated by all the previous carbon-only models, to release carbon from land under a warmer climate. C-N coupling should therefore shift the range of model re-sults shown in Fig. 2e in the direction of our C-N coupled result. We also hypothesize that because this response de-pends on a strong coupling between production (carbon up-take) and respiration (carbon release), there is an upper limit to the response at some moderate positive value forγL. In-troduction of C-N coupling is therefore expected to com-press the between-model range ofγL. Results from a cou-pled model of intermediate complexity support this hypothe-sis (Sokolov et al., 2008). A comparison of dynamic global vegetation models suggests that inclusion of dynamic bio-geography might complicate the influence of C-N coupling on the land ecosystem response to warming (Cramer et al., 2001). In addition to the warming-related mechanism of
C-N interaction, other mechanisms related to changing nitrogen status are likely to play an important role, such as changes in species composition and associated changes in ecosystem structure and function (Suding et al., 2005) and changes in allocation patterns (Norby and Iversen, 2006).
Long-term multi-site flux observations (Law et al., 2002), ecosystem manipulation experiments (Norby and Iversen, 2006; Finzi et al., 2007; Melillo et al., 2002), and land carbon fluxes from data-assimilation methods (Peters et al., 2005) provide strong observational constraints that will be criti-cal to the evaluation of the predicted climate-carbon-nitrogen dynamics reported here. Recent work with the CCSM suite of models clearly demonstrates the usefulness of model eval-uation against multiple observational constraints (Randerson et al., 2009) as a way to improve model parameterization and performance, and several additional efforts are currently un-derway.
4.4 Fate of input N
In our simulations, the influence of C-N coupling on the climate-carbon feedback depends on the fate of newly min-eralized N, in particular whether it accumulates mainly in soil organic matter or in woody tissue. Confidence in this result demands that the same model be able to predict the fate of new N introduced directly through fertilization. We are fortunate to have as a point of reference in this regard the results of15N tracer experiments as reported by Nadelhoffer et al. (2004) (Nad04), but a completely consistent compari-son of our results with the Harvard Forest tracer experiments is not possible, due to the other requirements of our exper-imental protocol and limited computational resources. We find, however, that a broad comparison of our results with those of Nad04 shows an encouraging degree of qualitative as well as quantitative correspondence.
Our result showing a nearly complete retention of new in-put N for the first several decades of low-level N addition is consistent with the near-complete recovery of tracer N in the Nad04 control plots after 7 years. Our results suggest that a longer manipulation would be required to see significant gaseous losses on the control plots, but those results may be sensitive to the level of N fertilization. Even at year 2099 the anthropogenic N deposition in our simulations for the Har-vard Forest grid point are well below even the low-N fertil-ization plots in Nad04. Additional modeling experiments are required to evaluate the influence of higher N input rates on this predicted time lag.
organic matter falling within the observed range for most of the period 1980–2099. Fractions of deposited N recovered in vegetation, litter, and soils vary across multiple studies, but in general the total fraction recovered in litter and soil is larger than the fraction recovered in vegetation (Schlesinger, 2009).
We stress that there are some issues with our experimental protocol that leave an imperfect basis for comparison. The values shown for the model in Figure 8 are percentages of the cumulative ecosystem sink, and are significantly smaller and outside the observed range if expressed on the basis of cumulative anthropogenic N deposition inputs. Our results suggest that the modeled denitrification flux associated with the new input N would be very small for the 7-year observa-tion period reported in Nad04 if the modeled N addiobserva-tion were a short pulse over 1991–1992 as in the field experiment. We also note that the qualitative agreement in terms of the large fraction of the modeled N sink going to litter and soil or-ganic matter holds well both before and after the transition to denitrification losses. Ignoring the denitrification component therefore provides the most logical basis for comparison, but we recognize that additional evaluation work should be done to test our model more exactly against the experimental con-ditions of Nad04.
5 Conclusions
Results reported here support the conclusion that tight cou-pling of carbon and nitrogen cycles in the terrestrial bio-sphere has the following important consequences for climate system – carbon cycle feedbacks and resulting changes in
Ca:
1. Terrestrial C-N interaction greatly reduces the capac-ity of land ecosystems to increase net carbon uptake in response to increasing atmospheric CO2
concentra-tion, compared to the same response when nutrient limitations are ignored. This conclusion is supported by previous studies: for stand-alone ecosystem mod-els (McGuire et al., 2001), offline land component of a coupled climate model (Thornton et al., 2007), cou-pled model of intermediate complexity (Sokolov et al., 2008), and now here for the case of a fully-coupled cli-mate system model. We note that each of these studies is based on either the TEM or the CLM-CN model. 2. Terrestrial C-N interaction leads to an increase inγL,
the sensitivity of land carbon uptake to radiatively-forced climate change, moving the overall climate-carbon cycle feedback in the direction of a smaller posi-tive feedback than previously assumed (Friedlingstein et al., 2006; Denman et al., 2007), including the possibil-ity of a modest negative feedback. The mechanism con-trolling this response is the interdependence of primary production and heterotrophic respiration, mediated by
the cycling of mineral and organic forms of nitrogen in the plant-litter-soil system.
3. Decreased CO2 fertilization effect and smaller carbon
losses (or even carbon gain) under radiatively forced cli-mate change have opposing influence on Ca, but our results suggest that the net effect of introducing C-N dynamics is to increase the airborne fraction of anthro-pogenic emissions, and so increase the simulatedCafor a given emissions scenario.
These conclusions are supported by the following lines of evidence, establishing causality in the simulation results and evaluating these results against experimental studies:
– Introduction of anthropogenic nitrogen deposition shifts the predicted climate-carbon cycle feedback parame-ters toward the mean response of previously-reported carbon-only models.
– Introduction of C-N interaction greatly increases the sensitivity of primary production to radiatively-forced climate warming, and this increase is directly associated with a warming-induced increase in nitrogen mineral-ization. This factor increases the importance of temper-ature change and reduces the relative importance of soil moisture change on the spatial pattern of land carbon cycle response to climate change.
– Climate warming drives a transfer of nitrogen out of soil organic matter and into vegetation, influenced by a demand-based competition between plants and mi-crobes for the available mineral nitrogen resource. – The simulated fate of new mineral nitrogen, with
re-spect to ecosystem losses and accumulation in vegeta-tion and soil pools, is in good qualitative and quanti-tative agreement with15N tracer experiments in a tem-perate forest ecosystem. The relative accumulation of new nitrogen in woody vs. non-woody vegetation tissue is less conclusive, but results suggest a good qualitative agreement.
We argue that between-model variation in land carbon cy-cle responses to both CO2 fertilization and climate change
would be reduced by the introduction of C-N interactions in other climate-carbon cycle models, which would tend to re-duce the range of uncertainty in predictions of future climate from the coupled models. Finally, we note that the present simulations have not included the influence of disturbance history and land use. These factors have been shown to inter-act strongly with C-N dynamics. We are currently exploring these interactions in the context of the fully-coupled climate system model, and we expect that these interactions will re-sult in larger values of atmospheric CO2concentration than
anthropogenic DIC, zonal avg, model (umol/L)
anthropogenic DIC, zonal avg, GLODAP (umol/L)
[image:18.595.49.282.68.523.2]bias (umol/L)
Fig. A1. Zonal average of anthropogenic dissolved inorganic car-bon (DIC). See text for discussion of averaging time periods. Model (top), GLODAP measurements (middle), and model bias (bottom).
Appendix A
Ocean CO2and CFC analysis
The sensitivity of ocean carbon uptake to changes in at-mospheric CO2 in the CCSM 3.1-carbon simulations
(re-ported here) is at the low end of published values. Val-ues of the ocean carbon sensitivity, βO, are equal to about 1.0 PgC ppm−1 over the first half of the 21st century, de-clining to 0.8 PgC ppm−1. By comparison, the range of
CFC11, zonal avg, model (pmol/L)
CFC11, zonal avg, GLODAP (pmol/L)
[image:18.595.312.542.68.517.2]bias (pmol/L)
Fig. A2. Zonal average of CFC-11. See text for discussion of aver-aging time periods. Model (top), GLODAP measurements (middle), and model bias (bottom).