w w w . a a s s j o u r n a l . c o m
ISSN (Online): 2322 – 4479
ISSN (Print): 2476–4981
Original Article
www.AESAsport.com Received: 14/09/2017 Accepted: 15/01/2018
Effects of Jump Difficulty on the Final Performance in
Snowboard-Slopestyle-
Winter Olympic Games, Socchi 2014
1,2
Jesús Muñoz,
2Javier García-Rubio,
1David Ramos,
1Kiko León,
1Daniel Collado-Mateo
*1Faculty of Sports Science, University of Extremadura, Cáceres, Spain. 2Facultad de Educación, Universidad Autónoma
de Chile, Santiago de Chile, Chile.
ABSTRACT
Background. Despite the increasing popularity of the snowboard, there is not scientific literature for sport performance indicators in this sport. Objectives. To analyze the effects of jump difficulty on the final performance during snowboarding-slopestyle competition. Methods. All competition sequences (n=214) from the 2014 Winter Olympic Games were analyzed. Of these, 123 were from the men´s competition and 91 were from the women´s competition. The interaction between the final score and number of rotations was calculated using regression models with quadratic or linear equations. All analyses were performed separately for women and men. Results. Quadratic regression had better R2 and mean absolute errors than linear regression. Linear and quadratic regressions showed that the number of
rotations significantly predicts final score in men. However, in the women´s competition, the curve of quadratic regression was almost identical to that from the linear regression. Conclusion. These results have identified the importance of evaluating the jump difficulty versus its efficacy. Athletes and coaches have to weigh pros and cons of increasing the difficulty of jumps or improve jumps that are already fluent in order to master them.
KEY WORDS:Sport, Decisional Balance, Correlates, Elite, Jumps, Snowboard, Slopestyle.
INTRODUCTION
The popularity of Snowboard has been increasing in the last 40 years (1). One Snowboard modality, Slopestyle, was introduced in the Olympic competition in Sochi Winter Games 2014. Snowboard - Slopestyle combines the typical aspects of downhill with obstacles (like Snowboard – Boardercross Olympic competition) and big jumps with a long aerial phase, similar to Olympic competition of Snowboard – Half-pipe. It also includes some characteristics from non-competitive snowboard freestyle, in particular, jibbing actions over the rails. All those modalities require the execution of complex sport techniques and have a high level of
fall risk that influences the final competitive performance, evaluated by a panel of judges.
However, Snowboard research is quite recent and focused on specific fields not related to sport performance analysis. The principal topic in Snowboard research is “Sport injuries”, which contains data about all snowboard modalities, including Slopestyle (2, 3). The biomechanical approach about characteristics of snowboard related with human movement models, is a relevant topic in the literature (1, 4-7). Sociological and Psychological research is another frequent study field (8-10). A few papers have focused on technical performance and
physical conditioning. Specifically, in Snowboard – Halfpipe, only Harding, Toohey (11), Harding, Small (12), Harding and James (13) and Harding, Mackintosh (14) analyzed different technical elements using movement sensors, aims to assist the evaluation of the judges. Gathercole, Sporer (15) investigated the effect of acute fatigue and training adaptation in snowboard athletes and the effect of warm-up practices in snowboard was analyzed by Hilfiker, Hübner (16) and Sporer, Cote (17). Related with this field Platzer, Raschner (18) studied the relationship between physical conditioning and performance in competition.
Despite being a highly developed sport today, there are no relevant references in the scientific literature in Snowboard – Slopestyle. Like other sport disciplines, the search for sport performance indicators in Snowboard is scarce. The context does not allow the development of field experiments due to the large distance over which the activities take place, the specific topography of the slope, surface and so on (6). The Snowboard–Slopestyle track profile in Sochi 2014 was 635 m. length and 151 m. of vertical drop slope. In those conditions, the use of Observational methodology to analyze competitive performance in Snowboard – Slopestyle can solve these limitations and could be useful to find reliable indicators that help coaches and Athletes in training and competition. To the best of our knowledge, there are no studies that analyze performance in snowboard-slopestyle. Therefore, the aim of this paper is, making a first approach in this sporting context across the field of sport performance analysis, to analyze the effects of jump difficult on the final performance during official competition.
MATERIALS AND METHODS
Participants. A total of 214 sequences of the Slopestyle (n=214) from the Winter Olympic Games celebrated in Sochi in 2014. Of these sample, 101 were performed in the classification phase, 65 in the semi-finals and 48 in the finals. There were 123 sequences of the men´s competition (57.5%) and 91 of the women´s event (42.5%). Two of the recordings were not included in the analysis because video footage did not allow the collection of data. Video recordings were obtained from the official website of the Olympic Games (https://www.olympic.org). The local Institutional Review Board approved this study.
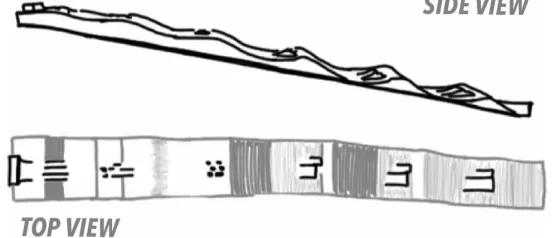
Measures. For each sequence, the following identification variables were collected: an identification code of the rider, sex, round, and competition phase (classification, semifinal and final). The slopestyle modality includes six modules (in addition to another optional module). The first three modules consisted in rails jibbing, whereas the last three modules are defined by three jumps with large aerial phase (figure 1). In this study, only the last three modules were included in the analyses since no significant relation was found between the performance in the first three modules and the final score.
The judges’ Snowboard Manual of FIS establishes a deduction range according to the severity of the mistakes. In this regard, the Manual indicates that small hand touches are considered minor mistakes, heavy hand touches and body contact with snow are medium mistakes, and complete falls are major mistakes. In the current study, the variable “falling” was codified as “yes” or “no” and it included all those mistakes.
Figure 1. Sochi 2014 winter Olympics – Slopestyle Course (www.olympic.org)
The number of rotations in longitudinal and transversal axes were collected. Most tricks are a combination of rotations in more than one axis. Therefore, a new variable was computed as the sum of the number of rotations in the longitudinal axis and the number of rotations in the transversal axis.
Procedures. Before starting with the phase of sample collection, we proceeded to assess the level of intra-observer concordance, essential to ensure the reliability of data (19). An experienced graduate of sport sciences carefully inspected the video recordings to collect data. The reliability of the observer was calculated by an adapted Kappa
value statistical procedure called Multirather
Kappa Free (20). A subsample of 40
Snowboard-slopestyle exercises was observed by one experienced analyst in two different periods separated by two weeks (21). To avoid contamination of the event, the analyst watched videos from a different competition. The test result shows a Kappa value greater than .90 in all variables, indicating a high degree of intra-observer agreement, ensuring the reliability of the data collected.
Statistical Analysis. Differences in number of rotations between those riders who made mistakes (called fallers) and those who did not make mistakes (non-fallers) was calculated using Student´s T test. Also effect sizes were calculated using Cohen´s D. The aim of this analysis was to check whether those riders who made mistakes performed a higher number of rotations or not. In order to analyse the influence of mistakes on the final score, the difference in the final score between the two groups (fallers and non-fallers) were calculated using the Student´s T test, and effect sizes. Additionally, a bivariate correlation was performed to analyse the relation between the total number of rotations and the final score. The Pearson correlation coefficient (R) was calculated. In sum, these three analyses mentioned above would provide information about the interaction between the key variables “mistakes”, “number of rotations”, firstly by comparing rotations and score of those who made mistakes and of those who did not make mistakes, and secondly by computing the correlation between number of rotations and final score.
A linear regression with one independent variable (number of rotations) and one dependent
variable (final score) was performed. However, it was hypothesized that the relationship between number of rotations and final score could be non-linear, since an excessive number of rotations could lead to a high probability of mistakes. Therefore, a regression model with a quadratic equation was also calculated. These analyses allow the comparison of the fitting of the regression model depending on the type of equation used. In order to verify the validity of the model, mean absolute errors of the prediction models were computed. This was calculated as the mean of the differences in absolute terms between the predicted score and the observed one. All analyses were performed separately for women and men using SPSS v22. Significance level was set at p<0.05.
RESULTS
Table 1 shows the distribution of the number of rotations and mistakes in each jump for all competitors according to gender, fallers and non-fallers. Effects sizes in numbers of rotations between fallers and non-fallers, shows an important effect in the last jump in men, and medium effects in all jumps in women.
T
he results of the Pearson correlation
coefficient are presented in the table 2.
Results shows positive correlation between
all jumps and final score for men (p< .05). For
women, the last jump is the only one that is
positively associated with final score
(p< .05). Pearson correlations coefficients are
presented in table 2. Results show that the
number of rotations in jumps one, two and
three are associated with final score for men,
but only the third jump for women.
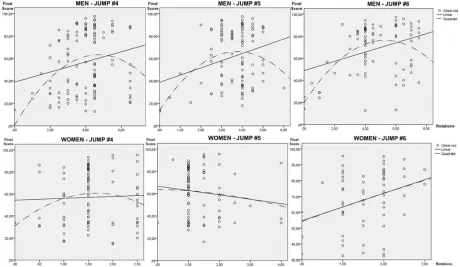
The results of the linear and quadratic regression showed significant positive effects for every jump for men (table 3). It can be observed that quadratic regression have better R2 and mean absolute errors than linear regression, however in total jumps the results are almost the same, for men and women. Figure 2 shows the regression lines of both model, linear and quadratic. It can be observed that for men, in module 4 score decreases close to 5 rotations; in module 5 the decrease occurs around four rotations; and in module 6 near to 6 rotations. In women, the curve of the quadratic regression is almost identical to the linear regression.
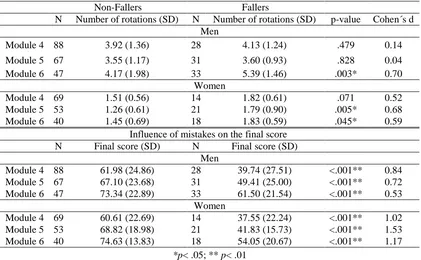
Table 1. Influence of the number of rotations on mistakes and number of mistakes on final score.
Non-Fallers Fallers
N Number of rotations (SD) N Number of rotations (SD) p-value Cohen´s d Men
Module 4 88 3.92 (1.36) 28 4.13 (1.24) .479 0.14
Module 5 67 3.55 (1.17) 31 3.60 (0.93) .828 0.04
Module 6 47 4.17 (1.98) 33 5.39 (1.46) .003* 0.70
Women
Module 4 69 1.51 (0.56) 14 1.82 (0.61) .071 0.52
Module 5 53 1.26 (0.61) 21 1.79 (0.90) .005* 0.68
Module 6 40 1.45 (0.69) 18 1.83 (0.59) .045* 0.59
Influence of mistakes on the final score N Final score (SD) N Final score (SD)
Men
Module 4 88 61.98 (24.86) 28 39.74 (27.51) <.001** 0.84
Module 5 67 67.10 (23.68) 31 49.41 (25.00) <.001** 0.72
Module 6 47 73.34 (22.89) 33 61.50 (21.54) <.001** 0.53
Women
Module 4 69 60.61 (22.69) 14 37.55 (22.24) <.001** 1.02
Module 5 53 68.82 (18.98) 21 41.83 (15.73) <.001** 1.53
Module 6 40 74.63 (13.83) 18 54.05 (20.67) <.001** 1.17
*p< .05; ** p< .01
Table 2. Pearson Correlation Coefficients between final score and jumps
Final score Jump 1 Jump 2 Jump 3
Men .221* .279** .343**
Women .041 -.132 ,313*
*p< .05; ** p< .01
Table 3. R-squared of the linear and quadratic equation models with final score as dependent variable and number of rotations as independent variable.
Module 4 Module 5 Module 6 Total
Men
Linear Quadratic Linear Quadratic Linear Quadratic Linear Quadratic
R2 0.05* 0.12** 0.08** 0.16*** 0.12** 0.27** 0.48** 0.49**
MAE 24.23 23.12 21.93 20.34 18.17 15.97 16.15 16.12
n=115 n=99 n=80 n=121
Women
Linear Quadratic Linear Quadratic Linear Quadratic Linear Quadratic
R2
NS NS NS NS 0.10* 0.10* 0.45** 0.48**
MAE 14.54 14.53 15.71 15.61
n=83 n=74 n=58 n=91
*p< .05; ** p< .01. MAE: Mean Absolute Error
DISCUSSION
The aim of this study was to analyze the effects of jump difficulty on the final performance during official competition. Results showed differences in the final score related to number of mistakes and rotations. Specifically, the regression models showed a positive effect of number of rotations in the
modules 4, 5 and 6, and total rotations on the final score for men, and the module 6 and total rotations for women. Results of the regression models permitted the comparison of results concerning both models of regression analysis. Quadratic regression fits data better, despite the fact that a linear regression of total rotations are similar.
Figure 2. Quadratic and linear regressions of men and women competitions
Research in snowboard-slopestyle is scarce, and only one study that was related to performance indicators (13) was available. This article states that is commonly accepted that degree of rotation in snowboard-half pipe is one of the strongest performance indicators associated with competition success. Results of the present study shows that this is true to some degree. Increasing of the difficulty of the jumps, meaning the number of rotations, led riders to fall and to make mistakes. Mistakes had a great influence in final score, being a key factor in final performance. In all three modules, fallers try more rotations than non-fallers. Risk Sensitivity Theory stated that people take riskier decisions based on need: the higher the need, the higher the risk (22). It seems that riders who want to win gold, make difficult jumps to
achieve it, falling in the attempt and, therefore, losing the medal. Riders who, on the other hand, make a balanced jump between risk and reward, seem to be more effective. In this sense, a study in the gymnastics final of the Beijing Olympic Games of 2008 (23) shows that athletes prefer not to perform the most difficult elements. Instead, they prefer to perform elements that permit them to achieve a better final score.
This study reveals the importance of tactics in competition. It can be observed that the second jump, both for men and women, is the easier one. The three firsts obstacles are easy jibbing tricks and riders are prepared to perform the first jump. After the first jump, balance is compromised, and competitors prefer to secure the second jump and prepare the last one. In fact, the run-up velocity of
the best athletes that competed in the jump in the 2006 World Cup, was significantly higher that the velocity of the rest (24). The riders needed to prepare in order to attain high velocity to achieve the most “air-time” to perform the jump with amplitude (13). For men, the last jump is the most challenging and difficult. For women, by contrast, the last jump of non-fallers has less rotations, however in women fallers, the last jump is more difficult than the first one. Related to this, in all competitors, the last jump is the best predictor of final score. Specifically, in women, the first and second jumps do not predict the final score, but the third jump does. Given that women perform less difficult jumps, variability is scarce in this competition, and that may be the reason why only the last jump was significantly associated with final score. Men perform more rotations in all jumps, and, though the last jump is the most important, the first and second have an impact in the final results.
The importance of this kind of analysis resides in the impossibility of laboratory based performance assessment (13). Video based analysis gives key information about competition in sport, improving competitors´ performance (25, 26). Different methods and instruments are being developed in the sporting context in order to assess in a valid and reliable way. Accelerometers are proven assessment instruments with a high validity and reliability for analysis. Also, these devices are portable, lightweight and accessible in price, easy to use and give feedback in real time (27, 28). Another advantage is the absence of cables, so they are easily adapted for placement on the rider´s body or in the snowboard itself. Future research has to take this into consideration. A major limitation of this study is the inexistence of studies in this sport to allow the comparison of results. Only studies of
other acrobatic sports similar to Snowboard-slopestyle were found and used in the discussion.
CONCLUSION
In summary, these results have identified the importance of evaluating the difficulty of the jump versus the efficacy of it. Riders and coaches have to weigh pros and cons of increasing the difficult of jumps, or improve jumps that are already fluent in order to master them. Thus, these findings would help coaches and riders to choose the most adequate difficulty for their jumps.
This article opens a new line of research trying to explain performance in Snowboard-slopestyle. Implications of findings from this manuscript are relevant for trainers who need to adjust the difficulty of jumps, and for researchers who aim to develop a performance model in this sport. In general terms, a greater difficulty allow the rider to get higher scores, but it also increases the risk of falling and to make mistakes, which had a great influence in final score, being a key factor in final performance.
ACKNOWLEDGMENT
The author DCM is supported by a grant from the Spanish Ministry of Education, Culture and Sport (FPU14/01283).
REFERENCES
1. Brennan SM, Kollár L, Springer G. Modelling the mechanical characteristics and on-snow performance of snowboards. Sports Engineering. 2003;6(4):193-206.
2. Engebretsen L, Steffen K, Alonso JM, Aubry M, Dvorak J, Junge A, et al. Sports injuries and illnesses during the Winter Olympic Games 2010. British journal of sports medicine. 2010;44(11):772-80.
3. Soligard T, Steffen K, Palmer-Green D, Aubry M, Grant M-E, Meeuwisse W, et al. Sports injuries and illnesses in the Sochi 2014 Olympic Winter Games. British journal of sports medicine. 2015;49(7):441-7.
4. Buffinton KW, Shooter SB, Thorpe IJ, Krywicki JJ. Laboratory, computational and field studies of snowboard dynamics. Sports Engineering. 2003;6(3):129-37.
5. Krüger A, Edelmann‐Nusser J. Biomechanical analysis in freestyle snowboarding: application of a full‐body inertial measurement system and a bilateral insole measurement system. Sports Technology. 2009;2(1‐2):17-23.
APPLICABLE REMARKS
The number of rotations is a key predictorof final score in men´s competition. The relation between these two variables is quadratic. This means that there is an optimal number of rotations from which the final score starts to decrease.
6. Klous M, Müller E, Schwameder H. Collecting kinematic data on a ski/snowboard track with panning, tilting, and zooming cameras: is there sufficient accuracy for a biomechanical analysis? Journal of sports sciences. 2010;28(12):1345-53.
7. Wu Q, Sun Q. A comprehensive skiing mechanics theory with implications to snowboard optimization. Medicine and science in sports and exercise. 2011;43(10):1955-63.
8. Arruza JA, Telletxea S, Azurza A, Balagué G, Brustad RJ. A Comparison of Physiological and Psychological Indicators in the Evaluation of the Work Capacity of Snowboarders. Journal of Sport Behavior. 2005;28(2):125. 9. Popovic ML, Morrow D. Stomping the Shadow: The Elevation of Snowboarding to the Olympic Pedestal from a
Jungian Perspective. Sport History Review. 2008;39(2):170-91.
10. Harding J, Lock D, Toohey K. A social identity analysis of technological innovation in an action sport: judging elite half-pipe snowboarding. European Sport Management Quarterly. 2016;16(2):214-32.
11. Harding JW, Toohey K, Martin DT, Hahn AG, James DA. Technology and half-pipe snowboard competition— insight from elite-level judges (p240). The Engineering of Sport 7: Springer; 2009. p. 467-76.
12. Harding J, Small JW, James DA, editors. Feature extraction of performance variables in elite half-pipe snowboarding using body mounted inertial sensors. Microelectronics, MEMS, and Nanotechnology; 2007: International Society for Optics and Photonics.
13. Harding JW, James DA. Performance assessment innovations for elite snowboarding. Procedia Engineering. 2010;2(2):2919-24.
14. Harding JW, Mackintosh CG, Hahn AG, James DA. Classification of aerial acrobatics in elite half-pipe snowboarding using body mounted inertial sensors (p237). The Engineering of Sport 7: Springer; 2009. p. 447-56.
15. Gathercole R, Sporer B, Stellingwerff T, Sleivert G. Alternative countermovement jump analysis to quantify acute neuromuscular fatigue. International journal of sports physiology and performance. 2015;10:84-92.
16. Hilfiker R, Hübner K, Lorenz T, Marti B. Effects of drop jumps added to the warm-up of elite sport athletes with a high capacity for explosive force development. The Journal of Strength & Conditioning Research. 2007;21(2):550-5.
17. Sporer BC, Cote A, Sleivert G. Warm up practices in elite snowboard athletes. Int J Sports Physiol Perform. 2012;7(3):295-7.
18. Platzer H-P, Raschner C, Patterson C, Lembert S. Comparison of physical characteristics and performance among elite snowboarders. The Journal of Strength & Conditioning Research. 2009;23(5):1427-32.
19. Barris S, Button C. A review of vision-based motion analysis in sport. Sports Medicine. 2008;38(12):1025-43. 20. Randolph JJ. Free-Marginal Multirater Kappa (multirater K [free]): An Alternative to Fleiss' Fixed-Marginal
Multirater Kappa. Joensuu Learning and Instruction Symposium 2005; Joensuu, Finland. 2005.
21. Pedhazur E, Pedhazur Schmelkin L. Exploratory factor analysis. Measurement, Design and Analysis: an integrated approach. 1991:590-630.
22. Gonzales J, Mishra S, Camp RD. For the Win: Risk‐Sensitive Decision‐Making in Teams. Journal of Behavioral Decision Making. 2016.
23. Leyton M, García J, Morenas J, Roldán A. Relationship between elements and score in floor exercise, in Artistic Gymnastic, in the Beijing 2008 Olympics Games. E-balonmano com: Revista de Ciencias del Deporte. 2010;6(1):39-47.
24. Veličković S, Petković D, Petković E. A case study about differences in characteristics of the run-up approach on the vault between top-class and middle-class gymnasts. Science of Gymnastics Journal. 2011;3(1):25-34.
25. Kirby R. Development of a real‐time performance measurement and feedback system for alpine skiers. Sports Technology. 2009;2(1‐2):43-52.
26. Fuss FK. Instrumentation of athletes and equipment during competitions. Sports Technology. 2008;1(6):235-6. 27. Casartelli N, Müller R, Maffiuletti NA. Validity and reliability of the Myotest accelerometric system for the
assessment of vertical jump height. The Journal of Strength & Conditioning Research. 2010;24(11):3186-93. 28. Sato K, Smith SL, Sands WA. Validation of an accelerometer for measuring sport performance. The Journal of
Strength & Conditioning Research. 2009;23(1):341-7.