Organized by C.O.E.T, Akola, ISTE, New Delhi & IWWA. Available Online at www.ijpret.com 355
INTERNATIONAL JOURNAL OF PURE AND
APPLIED RESEARCH IN ENGINEERING AND
TECHNOLOGY
A PATH FOR HORIZING YOUR INNOVATIVE WORK
A CASE STUDY ON NOISE POLLUTION FOR VEAVY TRAFFIC ZONE AT
AKOLA CITY
P. M. RAUT
Asstt. Prof, C.O.E &T. Babhulgaon (Jh.), Akola
Accepted Date: 07/09/2016; Published Date: 24/09/2016
Abstract:
Keywords: FRP confined, Column, Circular Column, Square Column, Confinement, Confined strength
Corresponding Author:MR. P. M. RAUT
Co Author:
Access Online On:
www.ijpret.com
How to Cite This Article:
P. M. Raut, IJPRET, 2016; Volume 5 (2): 355-365
PAPER-QR CODE
SPECIAL ISSUE FOR
INTERNATIONAL CONFERENCE ON
Organized by C.O.E.T, Akola, ISTE, New Delhi & IWWA. Available Online at www.ijpret.com 356
INTRODUCTION
Noise is an inevitable part of everyday life - the television, a plane flying overhead, a faulty muffler on the passing car, dogs barking, children laughing. Mild noise can be annoying; excessive noise can destroy a person's hearing. People do not easily become accustomed to noise. The slightest unwanted sound can become very annoying if it continues for any length of time. While some nearby residents may ignore the continuous hum of a busy freeway, others will never be able to ignore it and increasingly will find it irritating. Sound is a form of energy that is transmitted by pressure variations which the human ear can detect. When one plays a musical instrument, say a guitar, the vibrating chords set air particles into vibration and generate pressure waves in the air. People nearby May then hear the sound of the guitar when the pressure waves are perceived by the ear. Sound can also travel through other media, such as water or steel.
The Difference between Sound and Noise
Not all people are affected the same way by the same sounds. Often, we take for granted the sounds we hear every day. On different occasions and in varying situations, howrever, common everyday sounds can interfere with our routine task. When this happens, sounds become noise.
Traffic Noise
Noise is generally described as unwanted sound and wholly subject to personal tastes and tolerance levels. In addition, the sensitivity of the human ear to noise depends on a number of contextual factors which typically include wind factor, humidity, traffic density, etc. Nevertheless, it is generally accepted that a 55 dB(A) sound will be disturbing whereas a 65 dB(A) noise level will be deemed intolerable, causing severe sleep disturbance. Much of this is caused by traffic-related sound originating from all modes of transport. Operational noise from transportation system alone contributes about 70 % of total noise, whereas road traffic noise is responsible for 55 % of total noise. Ambiant Air Quality Noise Standards (Aaqns)
Most of the countries, keeping in view the alarming increase in environmental noise pollution, have given the permissible noise standards. These are depending on the location and period of day. Industrial areas obviously have somewhat higher acceptable sound levels than those prescribed for residential areas. The collected night standards are stringent than the daytime standards.
Standards by Law in India
Organized by C.O.E.T, Akola, ISTE, New Delhi & IWWA. Available Online at www.ijpret.com 357
The Central Pollution Control Board constituted a Committee on Noise Pollution Control. The Committee recommended noise standards for ambient air and for automobiles, domestic appliances and construction equipment, which were later notified in Environment (Protection) Rules, 1986 as given below in Table 1.2.
Table 1.2. Noise Standards for Different Category of Area
Area Code Category of Area Limits in dB(A), Leq
Day time Night time
A Industrial area 75 70
B Commercial area 65 55
C Residential area 55 45
D Silence Zone 50 40
Ambient noise level standards as prescribed by World Health Organization (WHO)
Recommended noise exposure limits are shown in Table 1.6.
Table 1.6. Recommended Noise Exposure Limits (WHO-1990)
1 Indoor/domestic night time 35 dB(A) Increased awakening at higher levels
2 Indoor/domestic day time 45 dB(A) Speech communication deteriorates at higher levels
3 Community /Urban night time 45 dB(A) Difficulties in falling asleep at higher levels
4 Community /Urban day time 55 dB(A) Annoyance increases at higher levels
5 Industrial occupational 75 dB(A) Predictable risk of hearing impairment at higher level
Case Study for Heavy Traffic Zone
Heavy Traffic zone include the following location code and monitoring place.
Location Code Place
13-H Railway Station Square
14-H Buss-Stand (Dhingra Square)
15-H Shindi Camp
16-H Akot –File
The observation reading are taken at a distance 1.2 meter from the edge of road and at right angle to the centerline of road.
The average of these noise level reading as shown in Table 4.153 to Table 4.156.
The Cumulative percentage of these noise level reading as shown in Table 4.173 to Table 4.176.
The value of noise level Leq, L10, L50, L90, TNI, LNP, NC, Lmax, and Lmin as shown in Table
Organized by C.O.E.T, Akola, ISTE, New Delhi & IWWA. Available Online at www.ijpret.com 358
The average value of noise level Leq, L10, L50, L90, TNI, LNP, NC, Lmax, and Lmin as shown in
Table 4.182.
Histogram for Leq, TNI, LNP, NC, as shown in Fig. 5.33 to Fig. 5.36.
Histogram for Lmax, and Lmin as shown in Fig. 5.41.
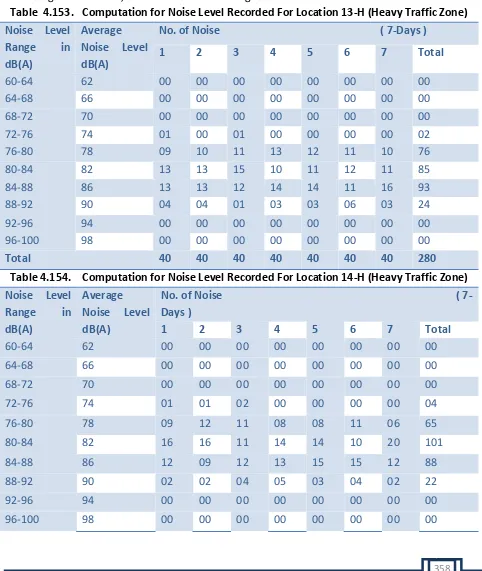
Table 4.153. Computation for Noise Level Recorded For Location 13-H (Heavy Traffic Zone)
Noise Level Range in dB(A)
Average Noise Level dB(A)
No. of Noise ( 7-Days )
1 2 3 4 5 6 7 Total
60-64 62 00 00 00 00 00 00 00 00
64-68 66 00 00 00 00 00 00 00 00
68-72 70 00 00 00 00 00 00 00 00
72-76 74 01 00 01 00 00 00 00 02
76-80 78 09 10 11 13 12 11 10 76
80-84 82 13 13 15 10 11 12 11 85
84-88 86 13 13 12 14 14 11 16 93
88-92 90 04 04 01 03 03 06 03 24
92-96 94 00 00 00 00 00 00 00 00
96-100 98 00 00 00 00 00 00 00 00
Total 40 40 40 40 40 40 40 280
Table 4.154. Computation for Noise Level Recorded For Location 14-H (Heavy Traffic Zone)
Noise Level Range in dB(A)
Average Noise Level dB(A)
No. of Noise ( 7-Days )
1 2 3 4 5 6 7 Total
60-64 62 00 00 00 00 00 00 00 00
64-68 66 00 00 00 00 00 00 00 00
68-72 70 00 00 00 00 00 00 00 00
72-76 74 01 01 02 00 00 00 00 04
76-80 78 09 12 11 08 08 11 06 65
80-84 82 16 16 11 14 14 10 20 101
84-88 86 12 09 12 13 15 15 12 88
88-92 90 02 02 04 05 03 04 02 22
92-96 94 00 00 00 00 00 00 00 00
Organized by C.O.E.T, Akola, ISTE, New Delhi & IWWA. Available Online at www.ijpret.com 359
Total 40 40 40 40 40 40 40 280
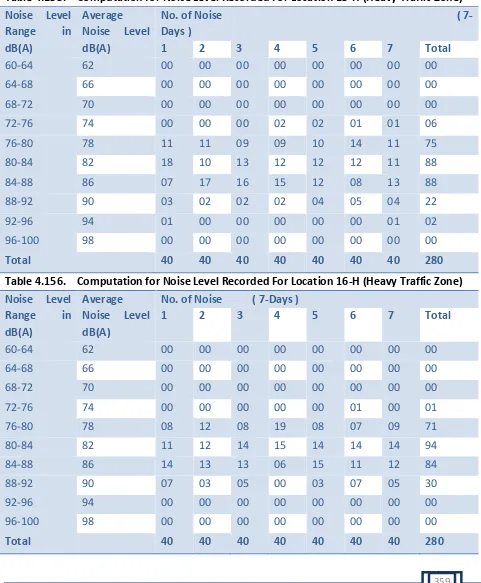
Table 4.155. Computation for Noise Level Recorded For Location 15-H (Heavy Traffic Zone)
Noise Level Range in dB(A)
Average Noise Level dB(A)
No. of Noise ( 7-Days )
1 2 3 4 5 6 7 Total
60-64 62 00 00 00 00 00 00 00 00
64-68 66 00 00 00 00 00 00 00 00
68-72 70 00 00 00 00 00 00 00 00
72-76 74 00 00 00 02 02 01 01 06
76-80 78 11 11 09 09 10 14 11 75
80-84 82 18 10 13 12 12 12 11 88
84-88 86 07 17 16 15 12 08 13 88
88-92 90 03 02 02 02 04 05 04 22
92-96 94 01 00 00 00 00 00 01 02
96-100 98 00 00 00 00 00 00 00 00
Total 40 40 40 40 40 40 40 280
Table 4.156. Computation for Noise Level Recorded For Location 16-H (Heavy Traffic Zone)
Noise Level Range in dB(A)
Average Noise Level dB(A)
No. of Noise ( 7-Days )
1 2 3 4 5 6 7 Total
60-64 62 00 00 00 00 00 00 00 00
64-68 66 00 00 00 00 00 00 00 00
68-72 70 00 00 00 00 00 00 00 00
72-76 74 00 00 00 00 00 01 00 01
76-80 78 08 12 08 19 08 07 09 71
80-84 82 11 12 14 15 14 14 14 94
84-88 86 14 13 13 06 15 11 12 84
88-92 90 07 03 05 00 03 07 05 30
92-96 94 00 00 00 00 00 00 00 00
96-100 98 00 00 00 00 00 00 00 00
Organized by C.O.E.T, Akola, ISTE, New Delhi & IWWA. Available Online at www.ijpret.com 360
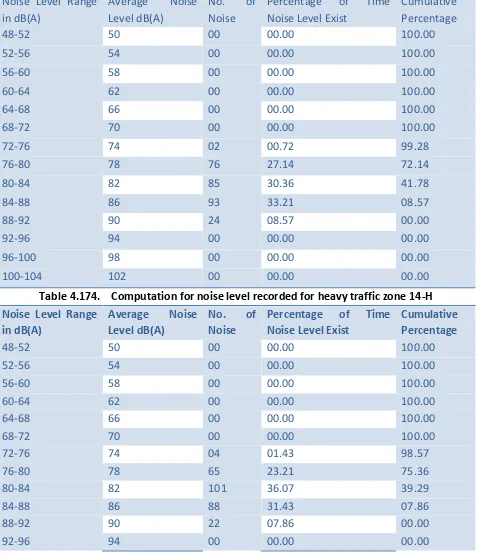
Table 4.173. Computation for noise level recorded for heavy traffic zone 13-H
Noise Level Range in dB(A)
Average Noise
Level dB(A)
No. of
Noise
Percentage of Time
Noise Level Exist
Cumulative Percentage
48-52 50 00 00.00 100.00
52-56 54 00 00.00 100.00
56-60 58 00 00.00 100.00
60-64 62 00 00.00 100.00
64-68 66 00 00.00 100.00
68-72 70 00 00.00 100.00
72-76 74 02 00.72 99.28
76-80 78 76 27.14 72.14
80-84 82 85 30.36 41.78
84-88 86 93 33.21 08.57
88-92 90 24 08.57 00.00
92-96 94 00 00.00 00.00
96-100 98 00 00.00 00.00
100-104 102 00 00.00 00.00
Table 4.174. Computation for noise level recorded for heavy traffic zone 14-H
Noise Level Range in dB(A)
Average Noise Level dB(A)
No. of Noise
Percentage of Time Noise Level Exist
Cumulative Percentage
48-52 50 00 00.00 100.00
52-56 54 00 00.00 100.00
56-60 58 00 00.00 100.00
60-64 62 00 00.00 100.00
64-68 66 00 00.00 100.00
68-72 70 00 00.00 100.00
72-76 74 04 01.43 98.57
76-80 78 65 23.21 75.36
80-84 82 101 36.07 39.29
84-88 86 88 31.43 07.86
88-92 90 22 07.86 00.00
Organized by C.O.E.T, Akola, ISTE, New Delhi & IWWA. Available Online at www.ijpret.com 361
96-100 98 00 00.00 00.00
100-104 102 00 00.00 00.00
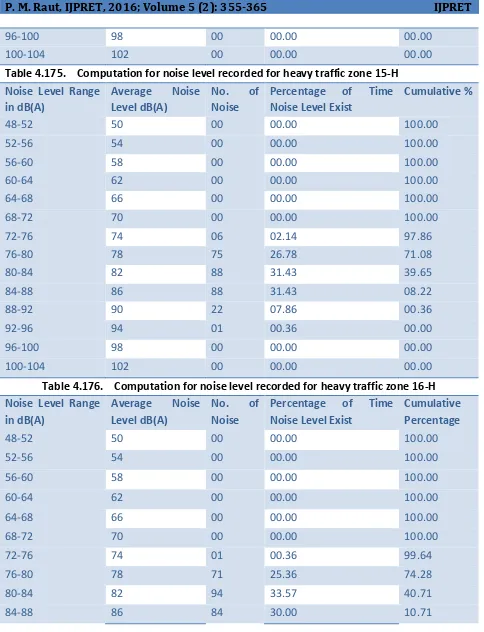
Table 4.175. Computation for noise level recorded for heavy traffic zone 15-H
Noise Level Range in dB(A)
Average Noise Level dB(A)
No. of Noise
Percentage of Time Noise Level Exist
Cumulative %
48-52 50 00 00.00 100.00
52-56 54 00 00.00 100.00
56-60 58 00 00.00 100.00
60-64 62 00 00.00 100.00
64-68 66 00 00.00 100.00
68-72 70 00 00.00 100.00
72-76 74 06 02.14 97.86
76-80 78 75 26.78 71.08
80-84 82 88 31.43 39.65
84-88 86 88 31.43 08.22
88-92 90 22 07.86 00.36
92-96 94 01 00.36 00.00
96-100 98 00 00.00 00.00
100-104 102 00 00.00 00.00
Table 4.176. Computation for noise level recorded for heavy traffic zone 16-H
Noise Level Range in dB(A)
Average Noise Level dB(A)
No. of Noise
Percentage of Time Noise Level Exist
Cumulative Percentage
48-52 50 00 00.00 100.00
52-56 54 00 00.00 100.00
56-60 58 00 00.00 100.00
60-64 62 00 00.00 100.00
64-68 66 00 00.00 100.00
68-72 70 00 00.00 100.00
72-76 74 01 00.36 99.64
76-80 78 71 25.36 74.28
80-84 82 94 33.57 40.71
Organized by C.O.E.T, Akola, ISTE, New Delhi & IWWA. Available Online at www.ijpret.com 362
88-92 90 30 10.71 00.00
92-96 94 00 00.00 00.00
96-100 98 00 00.00 00.00
100-104 102 00 00.00 00.00
Noise Climate (NC)
It is the range over which the sound levels are fluctuating in an interval of time
Noise parameter like Leq, TNI, LNP and NC are calculated using the formulae as given below (R.G.White,1986)
i) Equivalent Sound Energy Level (Leq) = Leq = L50+[ (L10-L90)2/56] dB(A)
ii) Noise pollution level (LNP)=LNP = Leq + (L10-L90) dB(A)
iii) Traffic Noise Index (TNI)=TNI = 4 (L10-L90)+L90-30 dB(A)
iv) Noise Climate (NC) =NC = L10 - L90 dB(A)
Table 4.181. Noise Parameter for
Types of Zone
Location Code
L10 L50 L90 TNI LNP Leq NC Lmax
(Avg)
Lmin (Avg) Heavy
Traffic Zone
13-H 85.83 80.92 75.37 87.21 93.33 82.87 10.46 90.1 76.5
14-H 85.73 80.81 75.48 86.48 92.94 82.69 10.25 89.9 77.0
15-H 85.77 80.68 75.17 87.57 93.29 82.69 10.60 89.7 76.5
16-H 86.27 80.89 75.52 88.52 93.70 82.95 10.75 89.9 76.4
Table 4.182. Average of Noise Levels
Types of Zone
L10 L50 L90 TNI LNP Leq NC Lmax Lmin
Heavy Traffic Zone
Organized by C.O.E.T, Akola, ISTE, New Delhi & IWWA. Available Online at www.ijpret.com 364
RESULT
Sound level meter placed at a distance (d=1.2 meter) from the pavement edge and a height of 1.2 meter from the ground level .Its microphone was right angle to the direction of traffic flow. In the present study, a noise sample size f 10 minute in each hour at a particular selected distance from the edge of the pavement was taken. Noise samples were collected in dB(A) scale at every interval (4 counts per minute) or total 40 reading in one sample size.
The average of noise level Leq, L10, L50, L90, TNI, LNP, NC, Lmax, and Lmin for Silence zone.
Residential zone, Commercial zone, Heavy Traffic zone and Industrial zone are as follows
Heavy Traffic Zone
It has been found that in the Heavy Traffic Zone, the average of noise level (Leq) was found to be 82.80 dB(A). The average of L10, L50, L90, TNI, LNP, NC, Lmax, and Lmin values were found to
be 85.90 dB(A), 80.83 dB(A), 75.39 dB(A), 87.45 dB(A), 93.32 dB(A), 10.52 dB(A), 89.9 dB(A),and 76.6 dB(A), respectively.
CONCLUSION
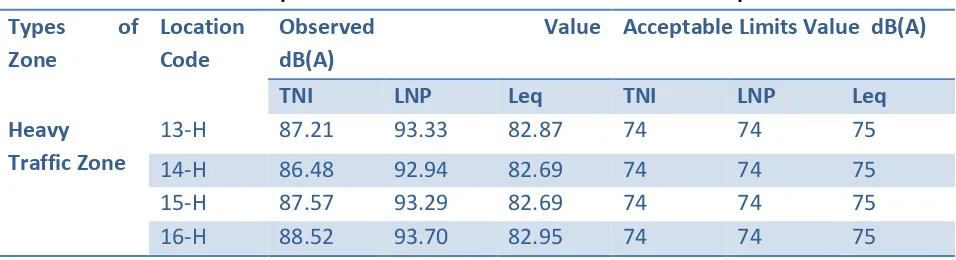
The various parameter of noise level were recorded in the selected areas and noise parameters in different areas are compared with acceptable limits using histogram as in Fig. and its comparison as shown in Table 4.183
Table 4.183. Comparisation between Observed Value and Acceptable value
Types of Zone
Location Code
Observed Value dB(A)
Acceptable Limits Value dB(A)
TNI LNP Leq TNI LNP Leq
Heavy Traffic Zone
13-H 87.21 93.33 82.87 74 74 75
14-H 86.48 92.94 82.69 74 74 75
15-H 87.57 93.29 82.69 74 74 75
16-H 88.52 93.70 82.95 74 74 75
BIBLIOGRAPHY
1. Allin St John Holt (Josh Publishing) Principles of Health and Safety at work.
Organized by C.O.E.T, Akola, ISTE, New Delhi & IWWA. Available Online at www.ijpret.com 365
3. C. C. Bhattacharya, Dr. S. S. Jain, S. P. Sing, Dr. M. Parida, Ms. Namita Mittal, “Development of Comprehensive Highway Noise Model for India Condition” Indian Road Congress Journal, Paper No. 481, 2001, pp 453-488.
4. Digvijay Sing, B. D. Joshi “Study of noise pollution for three consecutive years during Deepawali festival in Meerut City”, Utter Pradesh. New York Science Journal.
5. E.Georgiadou, K. Kourtidis, I. Ziomas “Expolatory traffic noise measurements at five main streets of Thessaloniki, Greece”. Global Nest : The Int. J. Vol. 6, No. 1 53-61, 2004.
6. Gupta, A. K., Khanna S. K., Gopal Madan, “Nomographic Proceducer for Road Traffic Noise Evaluation”, Indian Highway, Vol. 12 No. 1, pp 5-11, Jan 1984.
7. Gupta, A. K., Nigam S. P., Hansi J. S., “A Study on traffic Noise for various land uses for mixed Traffic Flow” Indian Highways, Indian Road Congress, Jamnagar House, Shahjehan Road. New Delhi, 1990, pp 30-48.