Statistical Analysis for Solving Quality Issue in Green Sand Casting
1 S. S. Jamkar, 2 S. S. Kalmegh , 3 Dr. S. S. Ingole
1 , 2, 3 Faculty of Mechanical Engineering, Sipna College of Engineering & Technology,
Email - 1 [email protected]
1. INTRODUCTION:
Taguchi method is a scientifically disciplined mechanism for evaluating and implementing improvements in products, processes, materials, equipment, and facilities. These improvements are aimed at improving the desired characteristics and simultaneously reducing the number of defects by studying the key variables controlling the process and optimizing the procedures or design to yield the best results. The method is applicable over a wide range of engineering fields that include processes that manufacture raw materials, sub systems, products for professional and consumer markets. in fact, the method can be applied to any process be it engineering fabrication, computer-aided-design, banking and service sectors etc. Taguchi method is useful for 'tuning' a given process for 'best' results. Taguchi proposed a standard 8-step procedure for applying his method for optimizing any process,
8-steps in Taguchi methodology:
Step-1: Identify the main function, side effects, and failure mode
Step-2: identify the noise factors, testing conditions, and quality characteristics
Step-3: identify the objective function to be optimized
Step-4: identify the control factors and their levels
Step-5: select the orthogonal array matrix experiment
Step-6: conduct the matrix experiment
Step-7: analyze the data; predict the optimum levels and performance
Step-8: perform the verification experiment and plan the future action
Table1. Process parameters and their levels (range)
Process Parameters Level 1 Level 2 Level 3
A: Moisture (%) 4.5-4.9 5.0-5.4 ---
B : Green Compression strength (kg/cm2)
1000-1100 1101-1200 1201-1300
C : Permeability
(number)
115-125 126-135 136-145
2. EXPERIMENTAL PLANNING:
The first step in Taguchi method is to select an appropriate OA (orthogonal array). The choice of a suitable OA
Abstract: Metal casting is one of the direct methods of manufacturing the desired geometry of component. As the number of process parameters involved in casting process so it is difficult maintain the quality of casting. Out of different casting methods, green sand casting is the commonly used method for producing Ginning Components. The quality of a green sand casting depends upon great number of parameter which influences the casting defects. This study analyses various significant process parameters of the green sand casting process. An effort has been taken to obtain optimal settings of the green sand casting process in order to improve the quality characteristics of green sand casting. The process parameters considered are moisture content, green compression strength and permeability. An orthogonal array, the signal- to-noise (S/N) ratio, and analysis of variance are used to analyze the effect of selected process parameters and their levels on the casting defects. The results indicate that the selected process parameters significantly affect the casting defects of grey cast iron ginning machine castings. A confirmation run is used to verify the results, which indicated that this method is more efficient in determining the best casting parameters for cotton ginning component.
INTERNATIONAL JOURNAL OF RESEARCH CULTURE SOCIETY ISSN: 2456-6683 Volume - 3, Issue - 8, Aug – 2019
Monthly, Peer-Reviewed, Refereed, Indexed Journal Scientific Journal Impact Factor: 4.526 Received on : 20/08/2019 Accepted on : 30/08/2019 Publication Date: 31/08/2019
main effect and interaction effects, resource availability and time constraints. Amongst the standard OA’s L4, L8, L16, L18 etc, L18 was found most appropriate to study 3 factors in which one at two levels and rest of at three levels as this OA covers both main effects of factors, two factors and three factors interaction as well. The OA selected, process parametr4s and interaction assigned are given in table 2.
Table2. Experimental Orthogonal Array
Trial No. A B C
1 2 3 4 5 6 7 8 9 10 11 12 13 14 15 16 17 18 4.8 4.8 4.8 4.8 4.8 4.8 4.8 4.8 4.8 5.3 5.3 5.3 5.3 5.3 5.3 5.3 5.3 5.3 1050 1050 1050 1150 1150 1150 1250 1250 1250 1050 1050 1050 1150 1150 1150 1250 1250 1250 120 130 140 120 130 140 120 130 140 120 130 140 120 130 140 120 130 140
3. TAGUCHI OPTIMISATION:
A. Experimental Procedure
The experiments are conducted against the trail condition tabulated in table 2, with three responses. .The quality
characteristics is Casting defects and so “Lower is better” analysis is performed.
Avg.Casting defects= 4.38 Standard deviation= 0.86
Avg S/N ratio=-12.78 B. Analysis of experimental results
Analysis of experimental results was performed using Minitab 14 software and ANOVA and AOM plots obtained are given in Table 3 and Figure 1 respectively.
Table3.ANOVA for % rejection at 95 % confidence limit
Parameter DoF seqSS AdjSS AdjMS F P (%)
A 1 14.2131 14.2131 14.2131 53.34 0.002 21.78
B 2 16.1135 16.1135 8.0568 30.24 0.004 24.65
C 2 7.4000 7.4000 3.7000 13.89 0.016 11.32
A*B 2 0.6385 0.6385 0.3179 1.19 0.392 0.9
A*C 2 11.6999 11.6999 5.8499 21.95 0.007 17.90
B*C 4 14.2020 14.2020 3.5505 13.32 0.014 21.73
Error 4 1.0659 1.0659 0.2665 1.63
Total 17 65.3302 100
AOM plot in Figure 1 indicates that % rejection is minimum at the first level of moisture content (A1), the first level of green compression strength (B1), and the second level of permeability (C2).
Fig.1 Pie chart of % contribution
Figure 2 Bar Chart of Percentage Contribution
Table 4: Response Table for S/N Ratio (Smaller is Better)
Level Moisture GCS Permeability
1 -12.14 -12.03 -12.68
2 -13.67 -12.71 -12.42
3 —- -13.97 -13.61
Delta 1.53 1.94 1.19
rank 2 1 3
INTERNATIONAL JOURNAL OF RESEARCH CULTURE SOCIETY ISSN: 2456-6683 Volume - 3, Issue - 8, Aug – 2019
Monthly, Peer-Reviewed, Refereed, Indexed Journal Scientific Journal Impact Factor: 4.526 Received on : 20/08/2019 Accepted on : 30/08/2019 Publication Date: 31/08/2019
Fig.3 Main effects for S/N ratio
Fig.4 Interaction Plot of Moisture Vs GCS for S/N Ratio
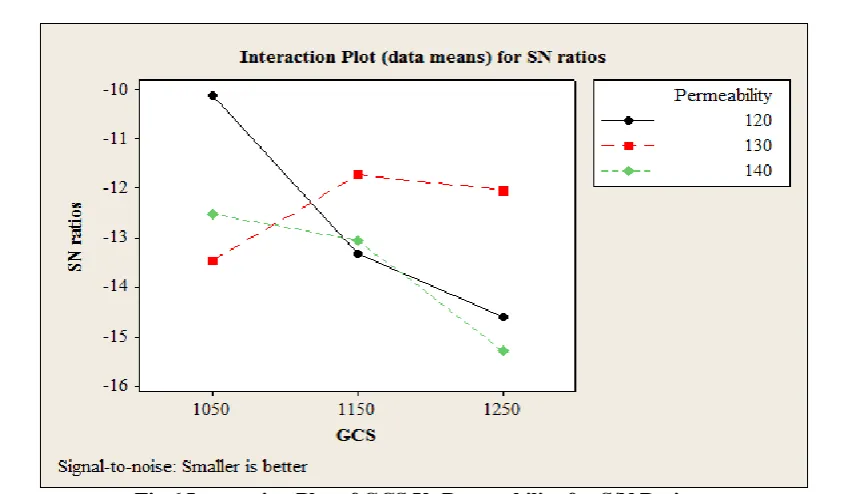
Fig.6 Interaction Plot of GCS Vs Permeability for S/N Ratio
4. Comparison of Statistical and Experimental Result:
Once the optimal combination of process parameters and their levels was obtained, the final step was to verify the estimated result against experimental value. It may be noted that if the optimal combination of parameters and their levels coincidently match with one of the experiments in the OA, then no confirmation test is required. Confirmation test was required in the present case study because the optimum combination of parameters and their levels i.e. A1B1C2 did not correspond to any experiment of the orthogonal array. Three confirmation experiments were performed at the optimized settings of the process parameters, results of which are recorded. Prior to the application of Taguchi method rejection due to sand related defects was 4.38% which is reduced to maximum up to 3.37 %.
Table 5: Results of confirmation Experiment
Expt Rejection Avg % of
No. 1 2 3 Rejection
1 3.1 3.3 3.4 3.27
2 2.88 4.1 3.18 3.39
3 3.28 2.5 4.1 3.29
Total average of % = 3.27+3.29+3.29 rejection =9.85/3 = 3.32
Table 6: Experimental Error Calculation
Optimal Estimation Experimental Condition
Level A1B1C2 A1B1C2
Rejection (%) 3.26 3.32
S/N Value -10.3467 -10.4227
Actual Rejection (%) = Experimental Condition - Optimal Estimation
= 3.32 - 3.26
INTERNATIONAL JOURNAL OF RESEARCH CULTURE SOCIETY ISSN: 2456-6683 Volume - 3, Issue - 8, Aug – 2019
Monthly, Peer-Reviewed, Refereed, Indexed Journal Scientific Journal Impact Factor: 4.526 Received on : 20/08/2019 Accepted on : 30/08/2019 Publication Date: 31/08/2019
5. CONCLUSION:
The optimized levels of selected process parameters obtained by Taguchi methods are: moisture content (A):
4.8 %, green compression strength (B): 1050 gm/cm2, and permeability number (C): 130.
With Taguchi optimization method the % rejection of castings due to sand related defects is reduced from 4.38
% to a maximum up to 3.32%.
Taguchi method has proved its success in prediction the optimum casting parameters to reach the best properties.
REFERENCES:
1. Mekonnen Liben Nekere, Ajit Pal Singh “ Optimization of Aluminium blank sand casting process by using
Taguchi’s Robust Design Method ” International Journal for Quality Research UDK – 669.716.
2. Adarsh Kumar, Jagjit Singh “ Optimization of sand casting process parameter for Ferrous Material by using
Design of Experiments ”, International Journal on Emerging Technologies 2(2): 122-127(2011)
3. Satish Kumar, Arun Kumar Gupta, PankajChandna “ Optimization of process parameter of pressure die casting
using Taguchi Methodology ”, World Academy of Science, Engineering and Technology 68, 2012.
4. Achamyeleh A. Kassie, Samuel B. Assfaw “Minimization of Casting Defects”,IOSR Journal of Engineering (IOSRJEN) e-ISSN: 2250-3021, p-ISSN: 2278-8719 Vol. 3, Issue 5 (May. 2013), PP 31-38.
5. Ravneetkakria, Chandandeep Singh, Priyavrat Thareja “Quality Improvement Of Aluminium Alloy (LM-6)
Casting Using Taguchi Method ” Transactions 2007, Proceedings of the 55th Indian Foundry Congress, Agra, Feb. 2-4, pp.420-431.
6. Uday A. Dabade , Rahul C. Bhedasgaonkar “Casting Defect Analysis using Design of Experiments (DoE) and
Computer Aided Casting Simulation Technique” , Forty Sixth CIRP Conference on Manufacturing Systems 2013.
7. CharnnarongSaikaew , Sermsak Wiengwiset “Optimization of molding sand composition for quality
improvement of iron castings ”,Applied Clay Science 67-68 (2012) 26–31
8. Laksyhmanan Singaram “ Improving Quality Of Sand Casting Using Taguchi Method And ANN Analysis ”,
International Journal On Design and Manufacturing Technologies, Vol.4, No.1 , January 2010.
9. B.Senthikumar, S.G. Ponnambalan, N. Jawahar “ Process factor optimization for controlling pull-down defects
in iron casting ”, Journal Of Material Processing Technology 209 (2009) 554-560.
10. G.P. Syrcos “Die casting process optimization using Taguchi methods”, Journal of Material Processing Technology 135 (2003) 68-74.
11. A.Pavan Kumar, B. Jyothu Naik, CH. Venkata Rao, Sadineni Rama Rao “ Optimization of casting parameter
for casting of AL/RHA/RM Hybrid Composites using Taguchi Method ”, International Journal of Engineering trends and Technology (IJETT)– Volume4 Issue - August 2013.
12. M. Narasimha, R. Rejikumar, K. Sridhar “Statistical Methods to optimize process parameters to minimize