R E S E A R C H A R T I C L E
Open Access
Lights, camera, path splitter: a new
approach for truly simultaneous dual
optical mapping of the heart with a
single camera
Rafael Jaimes III
1,2, Damon McCullough
1, Bryan Siegel
2, Luther Swift
1,2, James Hiebert
1, Daniel McInerney
1and
Nikki Gillum Posnack
1,2,3*Abstract
Background:Optical mapping of transmembrane voltage and intracellular calcium is a powerful tool for
investigating cardiac physiology and pathophysiology. However, simultaneous dual mapping of two fluorescent probes remains technically challenging. We introduce a novel, easy-to-use approach that requires a path splitter, single camera and excitation light to simultaneously acquire voltage and calcium signals from whole heart
preparations, which can be applied to other physiological models–including neurons and isolated cardiomyocytes. Results:Complementary probes were selected that could be excited with a single wavelength light source. Langendorff-perfused hearts (rat, swine) were stained and imaged using a sCMOS camera outfitted with an optical path splitter to simultaneously acquire two emission fields at high spatial and temporal resolution. Voltage (RH237) and calcium (Rhod2) signals were acquired concurrently on a single sensor, resulting in two 384 × 256 images at 814 frames per second. At this frame rate, the signal-to-noise ratio was 47 (RH237) and 85 (Rhod2). Imaging experiments were performed on small rodent hearts, as well as larger pig hearts with sufficient optical signals. In separate experiments, each dye was used independently to assess crosstalk and demonstrate signal specificity. Additionally, the effect of ryanodine on myocardial calcium transients was validated–with no measurable effect on the amplitude of optical action potentials. To demonstrate spatial resolution, ventricular tachycardia was induced– resulting in the novel finding that spatially discordant calcium alternans can be present in different regions of the heart, even when electrical alternans remain concordant. The described system excels in providing a wide field of view and high spatiotemporal resolution for a variety of cardiac preparations.
Conclusions:We report the first multiparametric mapping system that simultaneously acquires calcium and voltage signals from cardiac preparations, using a path splitter, single camera and excitation light. This approach eliminates the need for multiple cameras, excitation light patterning or frame interleaving. These features can aid in the adoption of dual mapping technology by the broader cardiovascular research community, and decrease the barrier of entry into panoramic heart imaging, as it reduces the number of required cameras.
Keywords:Optical mapping, Calcium cycling, Transmembrane voltage, Electrophysiology
© The Author(s). 2019Open AccessThis article is distributed under the terms of the Creative Commons Attribution 4.0 International License (http://creativecommons.org/licenses/by/4.0/), which permits unrestricted use, distribution, and reproduction in any medium, provided you give appropriate credit to the original author(s) and the source, provide a link to the Creative Commons license, and indicate if changes were made. The Creative Commons Public Domain Dedication waiver (http://creativecommons.org/publicdomain/zero/1.0/) applies to the data made available in this article, unless otherwise stated. * Correspondence:[email protected]
1Sheikh Zayed Institute for Pediatric and Surgical Innovation: Children’s
National Health System, 6th floor, M7708, 111 Michigan Avenue NW, Washington, DC 20010, USA
2Children’s National Heart Institute: Children’s National Health System, 111
Michigan Avenue NW, Washington, DC 20010, USA
Background
Cardiovascular research has been propelled by the advent of parameter-sensitive probes, which can be used to monitor transmembrane voltage and intracellular cal-cium within live cardiac preparations [1–5]. Optical map-ping is an imaging technique that measures fluorescence signals across a cardiac preparation with high spatiotem-poral resolution. Optical mapping of voltage-sensitive probes [6–8] allows for the measurement of action poten-tial morphology and the spread of electrical activity, as well as the identification of tissue heterogeneities that can promote arrhythmias. Whereas intracellular calcium probes [9] are used to investigate modifications in excita-tion-contraction coupling, which can alter action potential duration, elicit after-depolarizations, and promote elec-trical/mechanical alternans. Accordingly, simultaneous imaging of both transmembrane voltage and intracellular calcium is a powerful integrative tool for cardiac research (for extensive reviews see [1–4]). Yet, assembling a dual optical mapping system remains technically challenging [4,10,11], which has limited the use of this technique to a relatively small number of research laboratories.
Dual camera configurations
Simultaneous dual mapping systems have traditionally used a dual-sensor design, wherein the emission of each complementary probe (voltage, calcium) is sepa-rated by wavelength and diverted to two separate de-tectors [1, 5, 12–16]. Such a design was described by Fast and Ideker, in which cardiomyocytes monolayers
were stained with complementary probes (RH237 –
voltage, Fluo-3 AM – calcium) and the emitted
fluor-escent signals were focused onto two 16 × 16
photo-diode arrays [15]. A similar approach was employed
by Choi and Salama to simultaneously record trans-membrane voltage (RH237) and intracellular calcium (Rhod2) signals from isolated, whole guinea pig hearts [13]. Subsequently, dual-sensor optical configurations have been expanded to include EMCCD and sCMOS
sensors with improved spatial resolution (see Table 1
for example configurations [4, 5, 17]).
RH237/Rhod2-AM probes are still commonly used for dual imaging [1, 18–22], although dual-dye combinations that sep-arate fluorescence signals by emission have also been developed. They include: Di-4-ANEPPS with Indo-1
[16], Di-2-ANEPEQ and Calcium green [23], and
RH237 with Fluo-3/4/5 N [12, 15, 24, 25]. Import-antly, these dye combinations can have spectral over-lap, which necessitates non-ideal emission bandpass to negate spectral overlap and/or the inclusion of a calcium probe with an inferior dissociation constant
[26]. A dual-sensor optical mapping system offers
many advantages, including the full spatial and tem-poral resolution of each individual camera. However, a dual-camera optical setup can be both technically challenging and cost-prohibitive for basic-science and teaching laboratories (see Table 1 [3, 4, 10, 11]). Dual-sensor systems also require proper alignment to ensure that fluorescence signals are being analyzed from the same tissue region on each individual de-tector, which could lead to erroneous results. Finally, the physical footprint of two cameras in a 90 degree orientation can be limiting and reduce its versatility.
Single camera configurations
An alternative optical mapping approach includes the use of a single sensor tosequentiallyimage each comple-mentary probe (voltage, calcium) in time using excita-tion light patterning [10, 11, 27, 28] (see Table 2). A single-sensor, sequential imaging approach was de-scribed by Lee et al., which achieved rapid excitation light switching by utilizing recently developed high-power light emitting diodes [10]. Accordingly, single-sensor designs use dual-dye combinations that require two (or more) excitation light sources, but share a single emission band, including: di-4-ANBDQPQ and Fura-2
[10] or Rhod2-AM [29], Di-4-ANBDQBS and Fluo-4
[28], or Di-4-ANEPPS and X-Rhod-1 [11] (for review see [26]). Single-sensor optical mapping systems offer a cost advantage, since the camera sensor is often one of the most expensive components of an optical mapping setup. However, a single-sensor platform design is
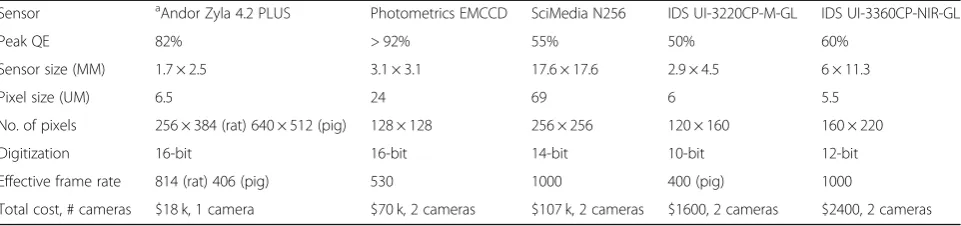
Table 1Example of optical mapping configurations using dual sensors
Sensor aAndor Zyla 4.2 PLUS Photometrics EMCCD SciMedia N256 IDS UI-3220CP-M-GL IDS UI-3360CP-NIR-GL
Peak QE 82% > 92% 55% 50% 60%
Sensor size (MM) 1.7 × 2.5 3.1 × 3.1 17.6 × 17.6 2.9 × 4.5 6 × 11.3
Pixel size (UM) 6.5 24 69 6 5.5
No. of pixels 256 × 384 (rat) 640 × 512 (pig) 128 × 128 256 × 256 120 × 160 160 × 220
Digitization 16-bit 16-bit 14-bit 10-bit 12-bit
Effective frame rate 814 (rat) 406 (pig) 530 1000 400 (pig) 1000
Total cost, # cameras $18 k, 1 camera $70 k, 2 cameras $107 k, 2 cameras $1600, 2 cameras $2400, 2 cameras
a
technically challenging since the use of two different ex-citation light wavelengths necessitates light source trig-gering, camera synchronization and frame interleaving [10,27,28]. A microcontroller is typically used to prop-erly time light triggering and to coordinate image acqui-sition, since each (alternating) probe signal is acquired in sequential frames. This alternating configuration de-creases the frame rate for each fluorescent probe of interest, since voltage/calcium signals typically reside on odd/even images. Excitation light ramp up/down times and shutter open/close times also have to be taken into consideration to avoid overlap. Accordingly, single-sen-sor setups (with interleaved frames per dye of interest) necessitate shortened exposure times compared with dual-sensor setups. The latter can diminish signal-to-noise quality, without offering the same temporal fidelity.
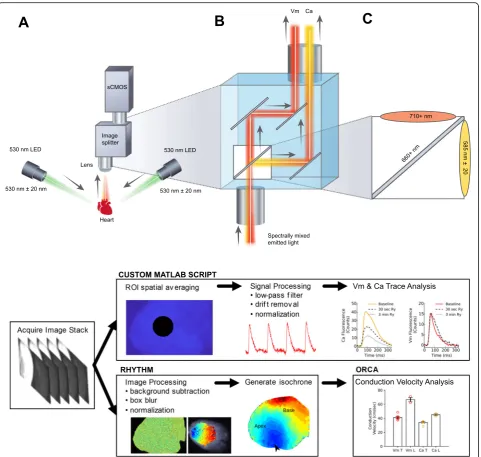
In the described study, we describe the first multipara-metric mapping system that simultaneously acquires cal-cium and voltage signals from cardiac preparations, using a commercially available optical path splitter, sin-gle camera and sinsin-gle excitation light (Figs. 1 and 2). Specifically, we have taken advantage of recently devel-oped large field of view sCMOS sensors that are faster
and more sensitive (2048 × 2048 pixels, 18.8 mm
diagonal, Zyla 4.2 plus, Andor Technology PLC, Belfast, UK). Our configuration separates the two emission bands for Rhod2 and RH237, however, we negate the need for a bulkier footprint and costly two camera setup by simultaneously directing each emission band to different sides of the single, large camera sensor. To date, optical path splitters have largely been limited to
microscopy applications that allow for a slow speed of acquisition (longer exposure time) and utilize bright im-munofluorescent samples. However, such an approach has not yet been described for multiparametric imaging of whole heart preparations that require 1) fast acquisi-tion speeds, 2) high spatial resoluacquisi-tion, and 3) utilize fluorescent probes with low signal to noise ratios.
Notably, the described approach enables truly
simultaneous dual imaging of cardiac preparations, while eliminating the need for two cameras and/or multiple excitation light sources, light patterning and frame inter-leaving. The described imaging platform is composed entirely of off-the-shelf components, which can aid in the adoption and successful assembly of this setup by other laboratories. The described protocol also employs
a commonly used dual-dye combination (RH237,
Rhod2-AM) that is widely available, thereby negating the need for genetically-encoded indicators [32–34] or fluor-escent probes that are not yet commercially available [35, 36]. We validate the utility of our approach by performing high-speed simultaneous dual imaging with sufficient signal-to-noise ratio for calcium and voltage signals and specificity of emission signals with negligible cross-talk. Ventricular tachycardia was induced to dem-onstrate high spatiotemporal resolution, which resulted in a novel finding that spatially discordant calcium alter-nans can be present in different regions of the heart, even when electrical alternans remain concordant. Furthermore, we highlight the versatility of our imaging platform by seamlessly maneuvering our optical setup between a Langendorff-perfused rat heart setup (2–3 cm in length, laying down) and Langendorff-perfused piglet
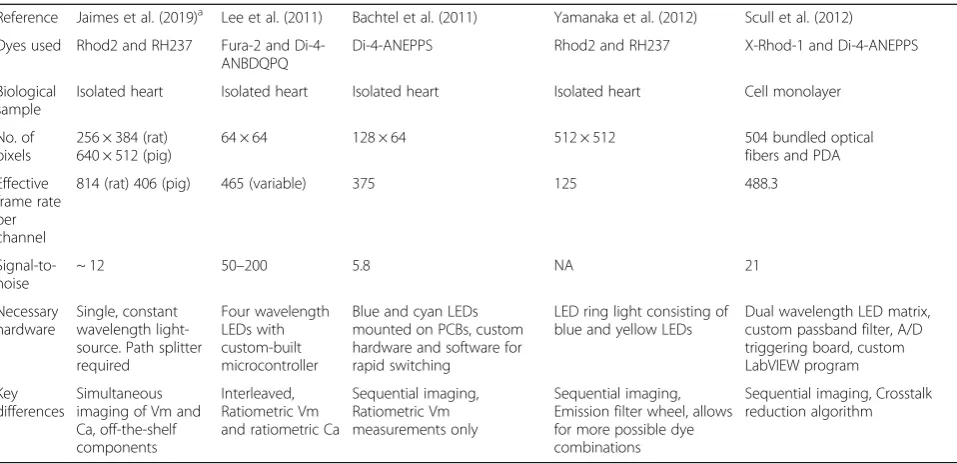
Table 2Comparison of novel single sensor optical mapping system to dual sensor configurations
Reference Jaimes et al. (2019)a Lee et al. (2011) Bachtel et al. (2011) Yamanaka et al. (2012) Scull et al. (2012)
Dyes used Rhod2 and RH237 Fura-2 and Di-4-ANBDQPQ
Di-4-ANEPPS Rhod2 and RH237 X-Rhod-1 and Di-4-ANEPPS
Biological sample
Isolated heart Isolated heart Isolated heart Isolated heart Cell monolayer
No. of pixels
256 × 384 (rat) 640 × 512 (pig)
64 × 64 128 × 64 512 × 512 504 bundled optical fibers and PDA
Effective frame rate per channel
814 (rat) 406 (pig) 465 (variable) 375 125 488.3
Signal-to-noise
~ 12 50–200 5.8 NA 21
Necessary hardware
Single, constant wavelength light-source. Path splitter required
Four wavelength LEDs with custom-built microcontroller
Blue and cyan LEDs mounted on PCBs, custom hardware and software for rapid switching
LED ring light consisting of blue and yellow LEDs
Dual wavelength LED matrix, custom passband filter, A/D triggering board, custom LabVIEW program
Key differences
Simultaneous imaging of Vm and Ca, off-the-shelf components
Interleaved, Ratiometric Vm and ratiometric Ca
Sequential imaging, Ratiometric Vm measurements only
Sequential imaging, Emission filter wheel, allows for more possible dye combinations
Sequential imaging, Crosstalk reduction algorithm
a
heart setup (5–8 cm in length, suspended) with different orientations. Due to technical challenges, dual optical mapping of a larger pig heart has only been previously described by one other group [37]; albeit this study employed a traditional dual camera configuration with limited spatial resolution (see Table 1). Taken together, the described dual imaging platform may be of interest to a wide variety of basic science and clinical researchers who utilize diverse models.
Results
Demonstration of distinct optical emission paths
Multiparametric imaging depends upon negligible cross-talk between probes, since interference between two fluorescent dyes can lead to erroneous calculations from the acquired signals. Lack of optical crosstalk along the light path was evaluated using a blanking plate, which was used to block either the short/585 nm light path or long/710 nm light path (Fig. 2d). To test for potential
dye crosstalk, experiments were performed in which Langendorff-perfused rat hearts were loaded with a
single fluorescent probe (Rhod2-AMorRH237), and the
degree of cross-talk between the two optical paths was assessed independently (Fig.2e, f). Representative optical signals recorded after staining with Rhod2 are shown in Fig.2e. Note that calcium transients are distinctly visual-ized with no detectable signal in the 710 nm long-pass
channel (RH237 channel). Conversely, staining with RH237 only resulted in robust voltage signals with negli-gible signal in the 585/40 nm channel (Rhod2 channel) with only a small max amplitude of < 3 counts (Fig.2f). There was no detected fluorescence from Rhod2 on the 710 nm long pass channel (0 ± 0 counts) compared to the maximum of 17 ± 1 counts on the 585 nm centered channel (p < 0.0001). With RH237 staining only, there
was an average maximum of 37 ± 5 counts compared to the 2 ± 1 counts on the 710 nm longpass and 585 nm centered band, respectively, p< 0.0001). These tests demonstrate that RH237 and Rhod2 signals selectively correspond to transmembrane voltage and intracellular calcium, respectively, with minimal cross-talk between the two probes. The latter is comparable to previously reported dual-sensor configurations [5,13].
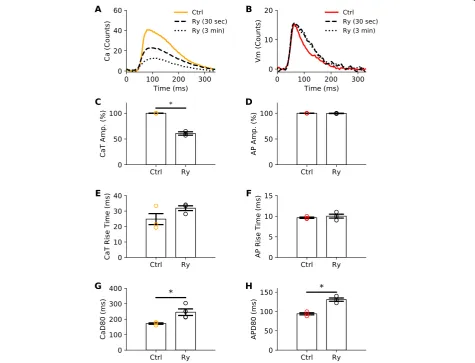
Use of ryanodine receptor antagonist to demonstrate signal specificity
Ryanodine, a ryanodine receptor antagonist, is known to significantly impact intracellular calcium transients [38] triggered by action potentials, with minimal effect on ac-tion potential morphology [13]. To further demonstrate signal specificity, a subset of experiments were performed on juvenile rats to illustrate the effect of ryanodine on cal-cium transient versus action potential characteristics
(Fig. 3). As anticipated, ryanodine-supplementation
resulted in a marked reduction in the calcium transient peak amplitude by 60% (Fig.3a, c) with no effect on action potential amplitude (Fig.3b, d). Also expected [39], ryano-dine-treatment lengthened both the calcium transient duration by 42% (CaD80, Fig.3g) and the action potential
duration by 40% (APD80, Fig. 3h). This study further
demonstrates the specificity of our optical configuration, and that the acquired RH237 and Rhod2 signals are accur-ately separated.
Simultaneous optical mapping of transmembrane voltage and intracellular calcium
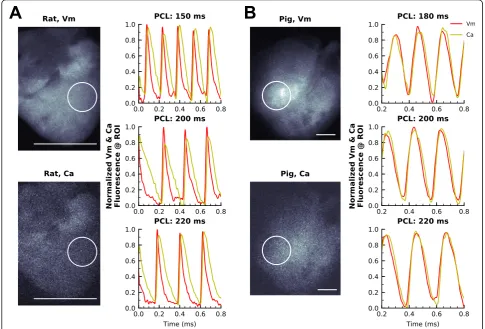
Experimental studies were performed to demonstrate the spatiotemporal performance of our optical mapping system, with suitable signal-to-noise ratio (SNR) for simultaneous dual mapping. Langendorff-perfused rat (2–3 cm length, laying down) or piglet hearts (5–8 cm
length, suspended) were loaded with both fluorescent probes (RH237, Rhod2) and optical signals were
acquired concurrently (Fig. 4). Dye loading can be
quickly verified by measuring regions on either image without de-interlacing, which is necessary with other sin-gle sensor systems. Following image acquisition (1 msec exposure time, 1000 fps, 768 × 208), optical signals were spatially averaged using a pixel radius of 30 for SNR mea-surements. These acquisition settings resulted in a SNR of 74 for Rhod2 and 39 for RH237. A slight increase in the exposure time (1.2 msec, 814 fps, 768 × 256) improved the SNRs to 85 for Rhod2 and 47 for RH237 (see Additional file 5: Table S2 for SNR calculations). In comparison, when the exposure time was doubled (2 msec, 500 fps, 768 × 384), the SNR improved to 121 for Rhod2 and 58 for RH237. No difference in fluorescence signal quality was observed within the short image acqui-sition time (2 s). Repetitive imaging over the course of 1 h
reduced the voltage peak fractional fluorescence (ΔF(p)/
F0) from 3 to 1.9%, and the calcium peak fractional
fluorescence from 4 to 3% (data not shown,n= 3). Examples of voltage and calcium signals acquired simultaneously from an isolated rodent heart are shown
in Fig. 4a, and in Additional file 1: Video S1 &
Additional file 2: Video S2. As expected, action potential activation preceded calcium transients for all pacing rates (150, 200, 220 msec cycle length). To demonstrate the versatility of our optical mapping system, supplemen-tary studies were performed on isolated piglet hearts that were imaged in an upright and suspended orientation (180, 200, 220 msec cycle length, Fig.4b, Additional file 3: Video S3 & Additional file 4: Video S4). These experimen-tal studies highlight the utility of our setup for simultan-eous transmembrane voltage and intracellular calcium recordings of cardiac preparations, with excellent SNR and temporal resolution.
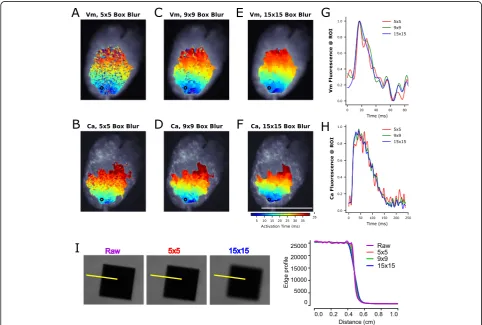
Requisite spatiotemporal resolution for whole heart optical mapping
To demonstrate spatiotemporal resolution of our optical mapping system, we assessed excitation-contraction coupling and measured epicardial conduction velocity. Calcium and voltage images were briefly processed by convolution with a uniform kernel for box blurring of increasing size (Fig. 5a-h), as previously described [30]. The blurring process decreased salt and pepper noise and improved the overall quality of isochronal maps and videos with minimal effect on spatial resolution (Fig.5i). Box blurred images were used for subsequent image analysis, such as conduction velocity measurements (Fig. 6a-d). Calcium and voltage signals were acquired with high temporal resolution upstrokes (Fig.6c), and as expected, isochrones show an elliptical pattern of action potential activation and calcium release that originated at the pacing site (Fig. 6a, b). A shorter time delay was
observed between voltage and calcium signals at the apex of the heart compared with the base (Fig. 6c) - an anatomical difference in excitation-contraction coupling that has previously been described [13]. Notably, apex-to-base differences can result in slower conduction velocity measurements when calcium measurements are used as a surrogate for voltage wavefront velocity in isolated whole heart preparations (Fig.6d), as compared to cell monolayer preparations [11,40].
As an example, an isolated rat heart preparation is shown wherein longitudinal voltage conduction velocity was 67 ± 4.6 cm/sec compared to the 45 ± 2.0 cm/sec for calcium (Fig. 6). Transverse voltage and calcium veloci-ties were 41 ± 2.3 and 34 ± 1.6 cm/sec. In this example, spatial heterogeneity was readily observed as the aniso-tropic ratio (longitudinal/transverse) was 1.62 for voltage conduction velocity, compared to 1.32 for calcium velocity, which illustrates discontinuity in wavefront
propagation (Fig. 6e, f). Indeed, viewing the time course of the voltage and calcium activation patterns of this heart pinpointed the activity in left, basal region. At t = 40 msec, an area showed a discontinuity activation/repolarization pattern (Fig. 6e), with a wavebreak clearly visible on the calcium channel (Fig. 6f). This anatomical region was consistent with the increased lag of the calcium release following depolarization, and may suggest underlying myocardial damage. Indeed, the described imaging platform provides sufficient spatial resolution to visualize the spread of electrical activity and calcium cycling in cardiac preparations.
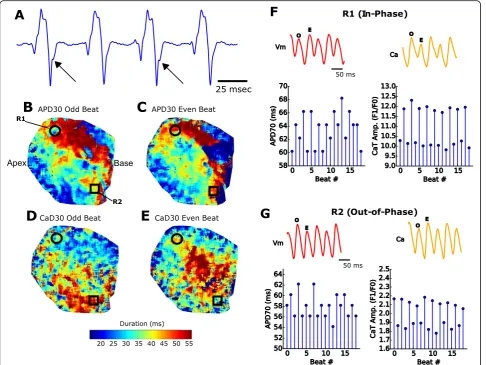
Induction of cardiac alternans to demonstrate spatial resolution
Arrhythmias are relatively uncommon in the rodent heart under basal conditions, due to species differences in car-diac size and ion channel expression [41]. Therefore, a burst pacing protocol was employed to induce ventricular
tachyarrhythmias for subsequent pathophysiological
imaging. Following burst pacing, concordant alternans were readily observed, wherein an alternating rhythm was observed in the action potential duration and/or intracel-lular calcium concentration [42–45] (data not shown). Alternans can be detected as T-wave alternans on an
electrocardiogram (Fig. 7a), or identified optically, from voltage and/or calcium signals acquired from a single region of interest (Fig. 7b-g). Conversely, discordant alternans arise when alternating rhythms in different spatial regions are out of phase. Such heterogeneities can be identified with optical mapping of fluorescence signals from multiple sites across a cardiac preparation with high
spatiotemporal resolution [46]. One such example is
shown in Fig.7, in which ventricular tachycardia was en-countered concomitantly with spatially discordant calcium transient alternans following dynamic pacing (S1-S1, 70 msec cycle length, isolated rat heart). With higher spatio-temporal resolution than previously reported (Table 1), different tissue regions can be identified and investigated using the described single-sensor setup.
Studies suggest that calcium alternans are mechanis-tically responsible for action potential duration alternans
[47], however the association has not been fully
elucidated. Depending on the underlying condition and cellular function, two different variants of alternans can manifest. “Positive coupling” describes the scenario in which a small calcium transient amplitude occurs after a shortened action potential [43]. Conversely, “negative coupling” describes a tall calcium transient amplitude that is associated with a shortened action potential. In the current study, we show examples of both positive and negative electromechanical coupling (in- and out-of-phase, respectively, Fig.7e, f). We report a novel finding that calcium transient alternans can be spatially discord-ant, while electrical alternans remain concordant. The
described system excels in providing both a wide field of view and high spatial resolution, which facilitated the de-tection of discordant alternans. Importantly, discordant alternans are considered a precursor for reentry arrhyth-mias [42], as repolarization gradients become amplified when neighboring cells are out of phase [42,44].
Discussion
In the current study, we present a novel and innovative approach to dual mapping of cardiac tissue that employs
recent advancements in imaging technology. Key
advantages include the simplicity of construction (path splitter, single sensor, single light), the elimination of ar-tifacts common for dual light sources and dual camera designs, use of optically compatible dyes, and reduced cost barrier. This dual mapping platform does not re-quire the coordination of exposure frame rate and LED light triggering, which can be technically challenging and also divides the acquisition frame rate by the number of probes (e.g. dual mapping calcium and voltage would otherwise decrease the effective frame rate by 50%). With this configuration, individual images of calcium or voltage are each acquired, simultaneously, at 384 × 256 resolution at 814 fps. If necessary for a specific applica-tion, the acquisition rate can be increased with vertical cropping or the field of view can be expanded to decrease the frame rate, all while maintaining SNR for the detection of calcium and voltage signals.
We validated the spatial and temporal performance of our optical mapping system using isolated whole rat and
piglet hearts. Proof-of-principle experiments were
performed to measure optical action potentials and calcium transients, spatial distribution of excitation-con-traction coupling, conduction velocity measurements in transverse/longitudinal directions, and spatiotemporal resolution of electrical and mechanical alternans. Im-portantly, accurate separation of transmembrane voltage and calcium signals was shown with single-dye loading experiments and also by application of ryanodine. In the latter, ryanodine administration decreased calcium tran-sient amplitude – with no discernible effect on action potential amplitude [13]. We also demonstrated that a larger heart size (piglet, 5–8 cm length) could be accom-modated without sacrificing acquisition speed by using wider strips (1024 × 256) and/or utilizing a wide-angle lens. Notably, the described system has a small footprint that expands its versatility of use between cardiac prepa-rations of different size and orientation. The system configuration can also be outfitted with other camera models to achieve specific temporal and spatial reso-lution needs. As an example, the N256 camera (SciMe-dia, Costa Mesa, CA) has a 256 × 256 sensor at a frame rate of 1818 fps, which could result in dual 256 × 128 images using the described configuration. Finally, the
described approach reduces the investment for a panoramic imaging setup [48–50] by decreasing the total number of required cameras.
One limitation of our approach is the sensitivity of the front-illuminated sCMOS sensor, which peaks at 82% quantum efficiency, but has a roll-off at 700 nm, in the emission spectrum of RH237. We see this limitation as an acceptable trade-off compared to the increased speed that the camera provides compared to back-illuminated options. We did not characterize the loss in quantum yield from the optical path splitter, though we anticipate losses that are comparable to other dichroic based emis-sion splitting systems. The optical path was optimized by using high transmission band (> 95%) filters and a high-speed lens (f/0.95 or f/1.2). Another potential limitation of the camera is the small pixel size of 6.5μm, which is not necessarily required for applications at the tissue level, such as whole heart preparations. We have mitigated the small pixel size by employing box blur algorithms during post-acquisition processing when necessary to improve signal fidelity (binning could also be used). A single excitation light source, single camera platform can complicate the control of dual emission in-tensities; although we did not encounter this problem due to the similar SNR of the dyes and wide (16-bit) dy-namic range of the camera. Finally, a slight difference in the focal plane between 585 nm versus 710 nm can occur
due to chromatic focal shift – although this did not
impact fluorescence signals at the tissue level. Color-cor-rected lenses can be employed to minimize chromatic aberration.
Conclusion
investigation of voltage/calcium kinetics, conduction velocity and arrhythmia incidence.
Methods
Animal procedures were approved by the Institutional
Animal Care and use Committee of the Children’s
Research Institute, and followed the National Institutes of Health’sGuide for the Care and Use of Laboratory
Ani-mals. All animals were euthanized by exsanguination
under anesthesia during heart excision, as detailed below.
Isolated rodent heart preparation
Unless otherwise noted, experiments were conducted
using adult male Sprague-Dawley rats (2–3 months of
age, 250-350 g, n = 11, Taconic Biosciences). Animals
were anesthetized with 3–5% isoflurane, the heart was excised and then transferred to a temperature-controlled
(37 °C) constant-pressure (70 mmHg) Langendorff
perfusion system. Excised hearts were perfused with Krebs-Henseleit buffer throughout the duration of the experiment, as previously described (< 1 h) [12, 51, 52]. Three electrodes were positioned to acquire a far-field electrocardiogram in the lead II configuration. In a subset of experiments, male juvenile rats (postnatal day 5, 10 g,
n= 6) were used to demonstrate the effects of ryanodine-supplementation on electromechanical coupling.
Isolated piglet heart preparation
Yorkshire piglets (2–4 weeks of age,n= 4) were used in a supplementary study to demonstrate the versatility of the optical setup. Briefly, an intravenous bolus injection
of fentanyl (50μg/kg) and rocuronium (1 mg/kg) was
administered, and anesthesia was maintained with iso-flurane (1–3%), fentanyl (10-25μg/kg) and pancuronium (1 mg/kg). The heart was excised and submerged in cardioplegia (4 °C) and then flushed with Krebs-Hen-seleit solution by aortic cannulation. The heart was transferred (~ 10 min at room temperature) to a temperature-controlled (37 °C) constant-pressure (70 mmHg) Langendorff-perfusion system. To avoid is-chemic-injury in these larger tissue preparations, the
heart was suspended in contrast to the “laying” rat
heart. Accordingly, the dual mapping platform
(camera, path splitter) was relocated in proximity to the larger capacity perfusion system.
Once a baseline heart rate was established (10 min),
the perfusate was supplemented with 10μM (−/−)
blebbistatin (Sigma-Aldrich) to reduce motion artifact for subsequent imaging experiments [53, 54]. Fluores-cent dyes were added sequentially, as a bolus, through a bubble trap located proximal to the aortic cannula. Based on predetermined myocardial staining time for each dye, 50μg Rhod-2 AM [1, 51] was added first and allowed to stabilize for 10 min, followed by 62.1μg
RH-237 staining for 1 min [12]. The myocardial tissue was re-stained by RH237 if needed throughout the duration of the experiment [55]. Homogenous dye loading is shown in Additional file5: Figure S1. For electrical stimulation, a coaxial stimulation electrode was positioned on the ven-tricular epicardium, which was driven by a Bloom Classic electrophysiology stimulator (Fischer Medical). Pacing current was set to 1.5x the threshold (resulting in typically 1.8 mA), with 1 msec monophasic pulses.
Ryanodine administration
To demonstrate negligible cross-talk between voltage and calcium signals, a subset of experiments was per-formed in the presence of ryanodine (n = 3). Ryanodine has previously been shown to selectively affect calcium transient upstroke and amplitude [13]. 10μM ryanodine was added as a bolus, through a bubble trap located proximal to the aortic cannula. Hearts were subjected to continuous pacing during imaging (180 msec), and im-ages were captured before and immediately after applica-tion of ryanodine (30 s, 1 and 3 min).
Instrumentation
The overall system configuration is shown in Fig.1. The epicardium was illuminated using broad light emitting diode (LED) spotlights centered at 530 nm (Mightex), equipped with an optical filter to constrict the excitation band (ET530/40x nm, Chroma Technologies). LED radiant power varied between 50 and 200 mW, as needed. At the onset of imaging, the excitation LEDs were automatically enabled via a direct TTL connection from the camera output. Due to the use of a single light source for excitation, complex light triggering was not needed to coordinate alternating LED light sources with individual frames.
An image splitting device (OptoSplit II, Cairn Re-search, Ltd) was positioned in front of a sCMOS camera (Andor Technology, PLC, Zyla 4.2 PLUS); the corre-sponding light path is shown in Fig.1b. The beam split-ter was configured with a dichroic mirror (660 + nm, Chroma Technologies, see Additional file 5: Table S1) that passed RH237 emission and reflected Rhod2 fluor-escence. High transmission emission filters were used for Rhod2 (ET585/40 m, Chroma Technologies) and RH237 emitted light (long pass ET710, Chroma Tech-nologies). A fixed focal length 17 mm/F0.95 lens was attached to the front of the imaging splitting device (Schneider, #21–010456) for rat hearts, and a wide-angle 6mm f/1.2 lens (Fujinon, #DF6HA-1B) was used for pig hearts. Details of the optical configuration are shown in Fig.1b, c and the experimental workflow is displayed in Fig.1d.
MetaMorphv7.10.2.240 (Molecular Devices, LLC) was
alignment and LED on/off triggering. To guide manual optosplit alignment,MetaMorph overlays the live images as contrasting colors or as subtractive greyscales to high-light misalignment. With this live feedback, images are quickly aligned (< 1 min) using the optosplit’s“long”and “short”control knobs (Fig.2). As an alternative to Meta-Morph, images could also be aligned with the free
soft-ware μManager [56]. After alignment, any standard
image acquisition software can be used such as
Meta-Morph, μManager, or Solis (Andor Technologies, soft-ware supplied with camera). The acquired image will include two fields, which can be separated using Meta-Morph, μManager, or alternative imaging software that includes automated tools. LEDs were attached to a con-troller (SLC-SA04-U/S, Mightex) that was triggered “on” 1 s prior to image acquisition. The computer consisted of a Xeon CPU E3–1245 v5 3.50 GHz (Intel corporation), 32 GB of RAM, and a non-volatile memory express solid state disk (NVMe SSD, Samsung 960 Pro). A frame grab-ber was used for imaging control and acquisition (Karbon #KBN-PCE-CL4-F, BitFlow). Because of the high data rate of acquisition (due to high spatial and temporal resolution and bit depth), the NVMe SSD disk was essential for redu-cing data rate bottlenecks. The frame grabber with 10-tap
CameraLink™ connection was necessary to achieve the
fastest frame rates possible; a USB connection would result in much slower frame rates.
To maximize spatiotemporal resolution, the sCMOS camera sensor was cropped and set to an acquisition rate of 814 frames per second (fps). The exposure time to achieve this frame rate was 1.206 msec, with a 98.4% duty cycle. This configuration resulted in two images from the splitting device, each 384 × 256 pixels, with a 16 pixel boundary between each image to negate optical crosstalk (Fig.2d). The field of view was approximately 2.1 × 1.4 cm, which was sufficient to fully image pediatric rat hearts (0.3 g average weight, 1.7 cm length from aortic root to apex). For the larger adult rat hearts (1 g average weight, 2.7 cm in length), the field of view was extended by in-creasing the working distance. The actual pixel size on the sensor is 6.5μm with a spatial resolution typically 45– 80μm–depending on working distance and field of view from a given lens. The front of the image splitter is a standard C-mount, which allows a user to select any standard lens to use in combination with accessories (back extension tubes, diopters) to adjust field of view and work-ing distance. The projected image size was measured for each study and spatial resolution was calibrated for con-duction velocity measurements. If needed, the frame rate could be increased further by vertical cropping; the feasi-bility of which was tested with 208 vertical pixels at 1000 fps, which resulted in adequate SNR on the epicardial sur-face (see results section for details). For supplemental pig-let heart studies (80–120 g average weight, 5–8 cm
length), a wide-angle lens was used in conjunction with a larger area of the sensor to attain a field of view approxi-mately 5.9 × 4.7 cm.
Signal and image processing
Following image acquisition, signal or image processing was performed as outlined in Fig.1d. Signal processing and data analysis were performed using a custom MATLAB script [26, 52]. A circular region of interest was taken in the center of the raw image with a 30-pixel radius (5–20 mm2area on the heart, depending on lens), averaged, and plotted against time. Drift removal and temporal smooth-ing were applied when necessary. Drift removal was per-formed by subtraction of a polynomial fit (0th, 1st, or 2nd order). To remove high frequency noise, a 5th order But-terworth low-pass filter was applied to the resulting signals with a cut-off frequency adjusted between 50 and 150 Hz. After pre-processing, a peak detector was used to measure the total number of action potentials or calcium transients in the file across time. Characteristics from each event are measured and averaged, including action potential dur-ation, calcium transient durdur-ation, time to 90% peak, and amplitude as described previously [26,51,57,58].
Image processing was performed and isochrone maps were constructed in therhythmsoftware [30]. The back-ground was removed, convolved with a uniform kernel for box blurring [30] and then time signals were low-pass fil-tered below 100 Hz. A similar approach was previously de-scribed by Laughner, et al. 2012 in which a 3 × 3 kernel size was used to process images acquired from a MiCAM ULTIMA (100 × 100 pixels, 100μm pixel size). We chose a larger uniform kernel size (15 × 15) since our camera sensor (Zyla 4.2) has sharper resolution (6.5μm pixel size). The activation time of every pixel on the heart was defined as the maximum derivative of the action potential or tran-sient upstroke, which was plotted for both voltage and cal-cium, respectively. As proof of concept, we also tested the feasibility of measuring conduction velocity across the epi-cardial surface by exporting the activation maps and
ana-lyzing via ORCA [31]. Subsequent electrical wave
propagation images were constructed using custom Py-thon scripts and plotted with matplotlib [59]. Signal-to-noise ratio (SNR) of the time-series was calculated as the action potential amplitude (ΔF) over the standard devi-ation of the baseline during the diastolic interval [37]. The number of pixels used to calculate the SNR was noted when necessary; importantly, the SNR can be improved considerably after box blurring and/or spatial averaging.
Statistical analysis
Additional files
Additional file 1: Video S1.Transmembrane voltage mapping of rat heart epicardium. An adult rat heart was imaged during ventricular pacing at cycle length 250 msec. The voltage wavefront can be seen originating from the center of the posterior ventricle and propagating across the surface, followed by a slight delay and retrograde atrial conduction. Calcium imaging was performed simultaneously (see Additional file 2: Video S2). The images were box blurred using a 15 × 15 uniform kernel and the length of the heart is approximately 2.5 cm from base to apex. (MP4 7953 kb)
Additional file 2: Video S2.Simultaneous calcium mapping of rat heart epicardium. The calcium activity of the adult rat heart was mapped concurrently with transmembrane voltage. The calcium wavefront can be seen following the voltage propagation from Additional file 1: Video S1. The images were box blurred using a 15 × 15 uniform kernel and the length of the heart is approximately 2.5 cm from base to apex. (MP4 7541 kb)
Additional file 3: Video S3.Transmembrane voltage mapping of pig heart epicardium. A juvenile pig heart was imaged during an episode of ventricular tachycardia (cycle length = 150 msec). Circus movement with wave collision can be observed. Calcium imaging was performed simultaneously (see Additional file 4: Video S4). The images were box blurred using a 15 × 15 uniform kernel and the length of the heart is approximately 5.0 cm from base to apex. (MP4 11591 kb)
Additional file 4: Video S4Simultaneous calcium mapping of pig heart epicardium. A juvenile pig heart was imaged during an episode of ventricular tachycardia (cycle length = 150 msec). Circus movement with wave collision can be observed. Transmembrane voltage imaging was performed simultaneously (see Additional file 3: Video S3). The images were box blurred using a 15 × 15 uniform kernel and the length of the heart is approximately 5.0 cm from base to apex. (MP4 16120 kb)
Additional file 5:Lights, Camera, Path Splitter: A New Approach for Truly Simultaneous Dual Optical Mapping of the Heart with a Single Camera.Figure S1.Single dye loading homogeneity. Fractional fluorescence was calculated by dividing each fluorescent image in the series by the average baseline image (ΔF/F0). The resultant fractional fluorescence images show near-black during baseline and bright during peak activity (peak of the action potential or calcium transient). The lookup table was not modified between baseline and peak images. A threshold was performed to show highest area of staining in pseudo-color. (A) RH237 was independently loaded to the heart. (B) Rhod-2 was independently loaded to a different heart to ensure specificity of the dye-loading. Examples of both anterior and posterior orientation are shown. LA = left atrium, LV = left ventricle, RV = right ventricle.Table S1.Major components, specifications, part numbers, and manufacturers for dual mapping system.Table S2.Quantified performance by signal-to-noise ratio measurements with different exposure times and image processing. (DOCX 200 kb)
Abbreviations
APD30:Action potential duration at 30% repolarization; Ca: Intracellular calcium signal; CaD30: Calcium transient duration at 30% relaxation; MEHP: Mono-2-ethylhexyl phthalate; Rr: Ryanodine; SNR: Signal to noise ratio; Vm: Transmembrane voltage
Acknowledgements
The authors gratefully acknowledge Narine Sarvazyan, Charles Berul, and Yu-Ling Shao for helpful discussions, Manelle Ramadan and Morgan Burke for technical assistance, and Nobuyuki Ishibashi and Takuya Maeda for biological materials.
Authors’contributions
RJ, DM, BS, LS, JH, DM, NGP performed experiments; RJ, DM, BS, NGP analyzed data; RJ, DM, NGP prepared figures; RJ and NGP drafted manuscript, RJ and NGP conceived and designed experiments; RJ, DM, BS; LS, JH, DM and NGP approved manuscript. All authors read and approved the final manuscript.
Funding
This work was supported by the National Institutes of Health (R00ES023477 to N.G.P., R01HL139472 to N.G.P), Children’s Research Institute and Children’s National Heart Institute. We thank the generosity of the NVIDIA corporation for the graphics processing unit to perform CUDA-enabled image processing. Funding sources had no role in the design of the study, collection, analysis, interpretation of the data or writing the manuscript.
Availability of data and materials
The datasets used and/or analyzed during the current study available from the corresponding author on reasonable request.
Ethics approval and consent to participate
Animal procedures were approved by the Institutional Animal Care and use Committee of the Children’s Research Institute, and followed the National Institutes of Health’sGuide for the Care and Use of Laboratory Animals.
Consent for publication
Not applicable.
Competing interests
The authors declare that they have no competing interests.
Author details
1Sheikh Zayed Institute for Pediatric and Surgical Innovation: Children’s
National Health System, 6th floor, M7708, 111 Michigan Avenue NW, Washington, DC 20010, USA.2Children’s National Heart Institute: Children’s
National Health System, 111 Michigan Avenue NW, Washington, DC 20010, USA.3Department of Pediatrics, Department of Pharmacology & Physiology,
School of Medicine and Health Sciences: George Washington University, 2300 I Street NW, Washington, DC 20037, USA.
Received: 21 March 2019 Accepted: 23 August 2019
References
1. Lang D, Sulkin MS, Lou Q, Efimov IR. Optical mapping of action potentials and calcium transients in the mouse heart. J Vis Exp. 2011;(55).https://www. ncbi.nlm.nih.gov/pubmed/21946907.
2. Efimov IR, Nikolski VP, Salama G. Optical imaging of the heart. Circ Res. 2004;95(1):21–33.
3. Herron TJ, Lee P, Jalife J. Optical imaging of voltage and calcium in cardiac cells & tissues. Circ Res. 2012;110(4):609–23.
4. Entcheva E, Bien H. Macroscopic optical mapping of excitation in cardiac cell networks with ultra-high spatiotemporal resolution. Prog Biophys Mol Biol. 2006;92(2):232–57.
5. Salama G, Hwang SM. Simultaneous optical mapping of intracellular free calcium and action potentials from langendorff perfused hearts. 2009/07/04. Vol. Chapter 12, Current Protocols in Cytometry; 2009. p. Unit 12 17. 6. Salama G, Morad M. Merocyanine 540 as an optical probe of
transmembrane electrical activity in the heart. Science. 1976;191(4226):485–7. 7. Fluhler E, Burnham VG, Loew LM. Spectra, membrane binding, and
potentiometric responses of new charge shift probes. Biochemistry. 1985; 24(21):5749–55.
8. Efimov IR, Huang DT, Rendt JM, Salama G. Optical mapping of repolarization and refractoriness from intact hearts. Circulation. 1994;90(3):1469–80. 9. Fabiato A, Fabiato F. Use of chlorotetracycline fluorescence to demonstrate
Ca2+−induced release of Ca2+ from the sarcoplasmic reticulum of skinned cardiac cells. Nature. 1979;281(5727):146–8.
10. Lee P, Bollensdorff C, Quinn TA, Wuskell JP, Loew LM, Kohl P. Single-sensor system for spatially resolved, continuous, and multiparametric optical mapping of cardiac tissue. Heart Rhythm. 2011;8(9):1482–91. 11. Scull JA, McSpadden LC, Himel HD, Badie N, Bursac N. Single-detector
simultaneous optical mapping of V(m) and [ca (2+)](i) in cardiac monolayers. Ann Biomed Eng. 2012;40(5):1006–17.
12. Swift L, Martell B, Khatri V, Arutunyan A, Sarvazyan N, Kay M. Controlled regional hypoperfusion in Langendorff heart preparations. Physiol Meas. 2008;29(2):269–79.
14. Atherton PJ, Babraj J, Smith K, Singh J, Rennie MJ, Wackerhage H. Selective activation of AMPK-PGC-1alpha or PKB-TSC2-mTOR signaling can explain specific adaptive responses to endurance or resistance training-like electrical muscle stimulation. FASEB J. 2005;19(7):786–8.
15. Fast VG, Ideker RE. Simultaneous optical mapping of transmembrane potential and intracellular calcium in myocyte cultures. J Cardiovasc Electrophysiol. 2000;11(5):547–56.
16. Laurita KR, Singal A. Mapping action potentials and calcium transients simultaneously from the intact heart. Am J Physiol Heart Circ Physiol. 2001;280(5):H2053–60.
17. Omichi C, Lamp ST, Lin S-F, Yang J, Baher A, Zhou S, et al. Intracellular ca dynamics in ventricular fibrillation. Am J Physiol Heart Circ Physiol. 2004;286(5):H1836–44.
18. Lang D, Holzem K, Kang C, Xiao M, Hwang HJ, Ewald GA, et al. Arrhythmogenic remodeling of Beta2 versus Beta1 adrenergic signaling in the human failing heart. Circ Arrhythmia Electrophysiol. 2015;8(2):409–19. 19. Myles RC, Wang L, Kang C, Bers DM, Ripplinger CM. Local $β$-Adrenergic
Stimulation Overcomes Source-Sink Mismatch to Generate Focal Arrhythmia. Circ Res. 2012;110(11):1454–64.
20. Lou Q, Li W, Efimov IR. Multiparametric Optical Mapping of the Langendorff-perfused Rabbit Heart. J Vis Exp. 2011;(55).
21. Holcomb MR, Woods MC, Uzelac I, Wikswo JP, Gilligan JM, Sidorov VY. The potential of dual camera systems for multimodal imaging of cardiac electrophysiology and metabolism. Exp Biol Med (Maywood). 2009;234(11):1355–73.
22. Hwang G-S, Hayashi H, Tang L, Ogawa M, Hernandez H, Tan AY, et al. Intracellular calcium and vulnerability to fibrillation and defibrillation in Langendorff-perfused rabbit ventricles. Circulation. 2006;114(24):2595–603. 23. Bullen A, Saggau P. Indicators and optical configuration for simultaneous
high-resolution recording of membrane potential and intracellular calcium using laser scanning microscopy. Pflugers Arch. 1998;436(5):788–96. 24. Wang L, Myles RC, De Jesus NM, Ohlendorf AKP, Bers DM, Ripplinger CM.
Optical mapping of sarcoplasmic reticulum Ca2+ in the intact heart: ryanodine receptor refractoriness during alternans and fibrillation. Circ Res. 2014;114(9):1410–21.
25. Kong W, Walcott GP, Smith WM, Johnson PL, Knisley SB. Emission ratiometry for simultaneous calcium and action potential measurements with coloaded dyes in rabbit hearts: reduction of motion and drift. J Cardiovasc Electrophysiol. 2003;14(1):76–82.
26. Jaimes R, Walton RD, Pasdois PLC, Bernus O, Efimov IR, Kay MW. A Technical Review of Optical Mapping of Intracellular Calcium within Myocardial Tissue. Am J Physiol Heart Circ Physiol. 2016;310(11):H1388–401.
27. Yamanaka T, Arafune T, Shibata N, Honjo H, Kamiya K, Kodama I, et al. Single camera system for multi-wavelength fruorescent imaging in the heart. In: Proceedings of the Annual International Conference of the IEEE Engineering in Medicine and Biology Society, EMBS. IEEE; 2012. p. 3716–9. PMID: 23366735.https://www.ncbi.nlm.nih.gov/pubmed/23366735.https:// doi.org/10.1109/EMBC.2012.6346774.
28. Lee P, Yan P, Ewart P, Kohl P, Loew LM, Bollensdorff C. Simultaneous measurement and modulation of multiple physiological parameters in the isolated heart using optical techniques. Pflugers Arch. 2012;464(4):403–14. 29. Lee P, Taghavi F, Yan P, Ewart P, Ashley EA, Loew LM, et al. In situ optical mapping of voltage and calcium in the heart. PLoS One. 2012;7:e42562. 30. Laughner JI, Ng FS, Sulkin MS, Arthur RM, Efimov IR. Processing and analysis
of cardiac optical mapping data obtained with potentiometric dyes. Am J Physiol Circ Physiol. 2012;303(7):H753–65.
31. Doshi AN, Walton RD, Krul SP, de Groot JR, Bernus O, Efimov IR, et al. Feasibility of a semi-automated method for cardiac conduction velocity analysis of high-resolution activation maps. Comput Biol Med. 2015;65:177–83. 32. Vogt CC, Bruegmann T, Malan D, Ottersbach A, Roell W, Fleischmann BK, et
al. Systemic gene transfer enables optogenetic pacing of mouse hearts. Cardiovasc Res. 2015;106(2):338–43.
33. Bruegmann T, Malan D, Hesse M, Beiert T, Fuegemann CJ, Fleischmann BK, et al. Optogenetic control of heart muscle in vitro and in vivo. Nat Methods. 2010;7(11):897–900.
34. Ambrosi CM, Sadananda G, Klimas A, Entcheva E. Adeno-associated virus mediated gene delivery: Implications for scalable in vitro and in vivo cardiac optogenetic models. bioRxiv. 2017;31:183319.
35. Matiukas A, Mitrea BG, Pertsov AM, Wuskell JP, Wei M, Watras J, et al. New near-infrared optical probes of cardiac electrical activity. Am J Physiol Heart Circ Physiol. 2006;290(6):H2633–43.
36. Matiukas A, Mitrea BG, Qin M, Pertsov AM, Shvedko AG, Warren MD, et al. Near-infrared voltage-sensitive fluorescent dyes optimized for optical mapping in blood-perfused myocardium. Heart Rhythm. 2007;4(11):1441–51. 37. Lee P, Calvo CJ, Alfonso-Almazán JM, Quintanilla JG, Chorro FJ, Yan P,
et al. Low-cost optical mapping Systems for Panoramic Imaging of complex arrhythmias and drug-action in translational heart models. Sci Rep. 2017;7:43217.
38. Escobar AL, Ribeiro-Costa R, Villalba-Galea C, Zoghbi ME, Pérez CG, Mejía-Alvarez R. Developmental changes of intracellular Ca2+ transients in beating rat hearts. Am J Physiol Heart Circ Physiol. 2004;286(3):H971–8. 39. Fauconnier J, Bedut S, Le Guennec J-Y, Babuty D, Richard S. Ca2+
current-mediated regulation of action potential by pacing rate in rat ventricular myocytes. Cardiovasc Res. 2003;57(3):670–80.
40. Gillum N, Karabekian Z, Swift LMM, Brown RPP, Kay MWW, Sarvazyan N. Clinically relevant concentrations of di (2-ethylhexyl) phthalate (DEHP) uncouple cardiac syncytium. Toxicol Appl Pharmacol. 2009;236(1):25–38. 41. Kaese S, Verheule S. Cardiac electrophysiology in mice: a matter of size.
Front Physiol. 2012;3:345.
42. Wilson LD, Rosenbaum DS. Mechanisms of arrythmogenic cardiac alternans. Europace. 2007;9(Supplement 6):vi77–82.
43. Sato D, Shiferaw Y, Garfinkel A, Weiss JN, Qu Z, Karma A. Spatially discordant alternans in cardiac tissue: role of calcium cycling. Circ Res. 2006;99(5):520–7. 44. Qu Z, Xie Y, Garfinkel A, Weiss JN. T-wave alternans and arrhythmogenesis
in cardiac diseases. Front Physiol. 2010;1:154.
45. Garfinkel A. Eight (or more) kinds of alternans. J Electrocardiol. 2007;40(6 Suppl):S70–4.
46. Uzelac I, Ji YC, Hornung D, Schröder-Scheteling J, Luther S, Gray RA, et al. Simultaneous quantification of spatially discordant Alternans in voltage and intracellular calcium in Langendorff-perfused rabbit hearts and
inconsistencies with models of cardiac action potentials and ca transients. Front Physiol. 2017;8:819.
47. Chudin E, Goldhaber J, Garfinkel A, Weiss J, Kogan B. Intracellular ca (2+) dynamics and the stability of ventricular tachycardia. Biophys J. 1999;77(6):2930–41. 48. Gloschat C, Aras K, Gupta S, Faye NR, Zhang H, Syunyaev RA, et al. RHYTHM:
an open source imaging toolkit for cardiac panoramic optical mapping. Sci Rep. 2018;8(1):2921.
49. Kay MW, Amison PM, Rogers JM. Three-dimensional surface reconstruction and panoramic optical mapping of large hearts. IEEE Trans Biomed Eng. 2004;51(7):1219–29.
50. Lou Q, Ripplinger CM, Bayly PV, Efimov IR. Quantitative panoramic imaging of epicardial electrical activity. Ann Biomed Eng. 2008;36(10):1649–58. 51. Jaimes R, Kuzmiak-Glancy S, Brooks D, Swift LM, Posnack NG, Kay MW.
Functional response of the isolated, perfused normoxic heart to pyruvate dehydrogenase activation by dichloroacetate and pyruvate. Pflügers Arch -Eur J Physiol. 2016;468(1):131–42.
52. Posnack NG, Jaimes R, Asfour H, Swift LM, Wengrowski AM, Sarvazyan N, et al. Bisphenol a exposure and cardiac electrical conduction in excised rat hearts. Environ Health Perspect. 2014;122(4):384–90.
53. Swift LM, Asfour H, Posnack NG, Arutunyan A, Kay MW, Sarvazyan N. Properties of blebbistatin for cardiac optical mapping and other imaging applications. Pflugers Arch Eur J Physiol. 2012;464(5):503–12.
54. Fedorov VV, Lozinsky IT, Sosunov EA, Anyukhovsky EP, Rosen MR, Balke CW, et al. Application of blebbistatin as an excitation-contraction uncoupler for electrophysiologic study of rat and rabbit hearts. Hear Rhythm. 2007;4:619–26. 55. Del Nido PJ, Glynn P, Buenaventura P, Salama G, Koretsky AP. Fluorescence measurement of calcium transients in perfused rabbit heart using rhod 2. Am J Phys. 1998;274(2 Pt 2):H728–41.
56. Edelstein AD, Tsuchida MA, Amodaj N, Pinkard H, Vale RD, Stuurman N. Advanced methods of microscope control usingμManager software. J Biol Methods. 2014;1(2):10.
57. Posnack NG, Idrees R, Ding H, Jaimes R, Stybayeva G, Karabekian Z, et al. Exposure to phthalates affects calcium handling and intercellular connectivity of human stem cell-derived cardiomyocytes. PLoS One. 2015;10(3):e0121927. 58. Ramadan M, Sherman M, Jaimes R, Chaluvadi A, Swift L, Posnack NG.
Disruption of neonatal cardiomyocyte physiology following exposure to bisphenol-a. Sci Rep. 2018;8(1):7356.
59. Hunter JD. Matplotlib: a 2D graphics environment. Comput Sci Eng. 2007;9(3):90–5.
Publisher’s Note