R E S E A R C H
Open Access
Integrative regression network for genomic
association study
Reddy Rani Vangimalla, Hyun-hwan Jeong and Kyung-Ah Sohn
*From
The 5th Translational Bioinformatics Conference (TBC 2015)
Tokyo, Japan. 7-9 November 2015
Abstract
Background:The increasing availability of multiple types of genomic profiles measured from the same cancer patients has provided numerous opportunities for investigating genomic mechanisms underlying cancer. In particular, association studies of gene expression traits with respect to multi-layered genomic features are highly useful for uncovering the underlying mechanism. Conventional correlation-based association tests are limited because they are prone to revealing indirect associations. Moreover, integration of multiple types of genomic features raises another challenge.
Methods:In this study, we propose a new framework for association studies called integrative regression network that identifies genomic associations on multiple high-dimensional genomic profiles by taking into account the associations between as well as within profiles. We employed high-dimensional regression techniques to first identify the associations between different genomic profiles. Based on the resulting regression coefficients, a regression network was constructed within each profile. For example, two methylation features having similar regression coefficients with respect to a number of gene expression traits are likely to be involved in the same biological process and therefore we define an edge between two methylation features in the regression network. To extract more reliable associations, multiple sparse structured regression techniques were applied and the resulting multiple networks were merged as the integrative regression network using a similarity network fusion technique. Results:Experiments were carried out using four different sparse structured regression methods on five cancer types from TCGA. The advantages and disadvantages of each regression method were also explored. We find there was large inconsistency in the results from different regression methods, which supports the need to extract the proposed integrative regression network from multiple complimentary regression techniques. Fusing multiple regression networks by using similarity measurements led to the identification of significant gene pairs and a resulting network with better topological properties.
Conclusions:We developed and validated the integrative regression network scheme on multi-layered genomic profiles from TCGA. Our method facilitates identification of the strong signals as well as weaker signals by fusing information from different regression techniques. It could be extended to integrate results obtained from different cancer types as well.
Keywords:Genomic association, Sparse regression, Similarity fusion network, Integrative analysis, TCGA
* Correspondence:[email protected]
Department of Information and Computer Engineering, Ajou University, Suwon 443-749, Republic of Korea
Background
Ongoing efforts by the The Cancer Genome Atlas (TCGA) [1] or the International Cancer Genome Consortium (ICGC) [2] have provided an exceptional opportunity for biomedical researchers and practitioners to explore the mechanisms and to identify important biomarkers under-lying cancer. Large-scale analysis of the available datasets that cover genomic, transcriptomic, and epigenomic, and clinical profiles have revealed important characteristics of genomic associations in cancer. Additionally,‘cancer stat fact sheets’have revealed new cases and the expected mor-tality rate of cancer are rapidly increasing [3]. Ongoing studies of gene expression with respect to multi-layered genomic features are highly useful for overcoming the poor prognosis of cancer.
In this study, we identified genomic associations using multiple genomic profiles. Given the high level of noise and extremely large data dimension, simple correlation-based association tests are prone to revealing indirect or false-positive genomic associations. Instead, we employed high-dimensional multivariate regression techniques to identify genomic associations between different high-dimensional genomic profiles. Moreover, we constructed a regression network utilizing the regression coefficient vec-tor or matrix. The regression network was constructed within each profile such as mRNA expression or methyla-tion, but takes into account the association between the two different genomic profiles. To extract more robust and statistically significant results, we used multiple gression techniques and then integrated the resultant re-gression networks into an integrative rere-gression network by using a network fusion technique.
Various sparse structured regression techniques have been proposed to address the challenges arising in a high-dimensional regression setting, both for the input and output variables. A widely usedL1-regularized linear regression known as Lasso [4] produces sparse regres-sion coefficients when the number of features is large. Variants of Lasso have been proposed to incorporate structural information of genomic features in input and expression traits as output. Graph-guided Fused Lasso (GFLasso) [5], for example, utilizes the network struc-ture among output variables in multiple output regres-sion setting. This is particularly suitable for association studies that consider gene expression traits as output variables because gene expression traits are under a nat-ural network structure. In Sparse Group Lasso (SGL) [6], input variables (genomic features) are assumed to behave in groups; thus, by utilizing grouping information of the features such as pathway groups, the method identifies important genes in common pathways of inter-est. For problems, such as grouped covariates, this method can impose sparse effect on the group level and within the group level. The more recently described
Structured Input–output Lasso (SIOL) method com-bines structural constraints on both the inputs and the outputs [7]. Similar to GFLasso, this method considers output structural information, and similar to SGL, con-siders input group information. SIOL predicts true non-zero coefficients using both structural information and grouping effect on the inputs and output variants.
Each of these sparse structured regression methods exhibits advantages and disadvantages. Rather than selecting the single best method, we build an integrative regression network by fusing multiple regression net-works. We adopted the existing approach of Similarity Network Fusion (SNF) [8] for network integration. The final fused network could compile shared information as well as complementary information from all different datasets used in the fusion by identifying similarities in all of the networks. Given the natural propagative beha-vior of SNF, the produced output showed less noise and captured important signals (both stronger and weaker signals). We demonstrate the proposed approach for an association study using methylation and gene expression data for five cancer datasets from TCGA.
Methods
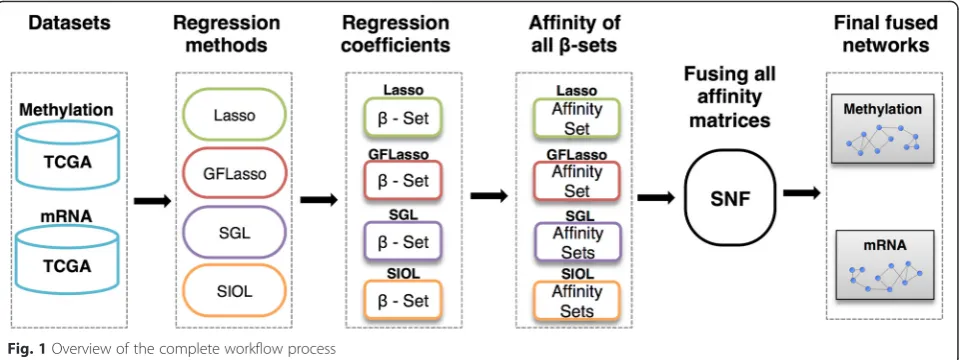
Overview of the proposed method
The complete flow of the process is depicted in Fig. 1. Methylation data and mRNA expression traits from TCGA were used in this study. Multiple regression methods were performed on the data by treating methylation data as fea-tures and expression traits as outputs. Resulting regression coefficients matrices were used to construct affinity or similarity networks on each profile. The constructed works were finally fused as an integrative regression net-work using the similarity netnet-work fusion technique.
Data & pre-processing
We downloaded gene expression data and methylation data used in a previous study [8] that were collected for five different cancer profiles from TCGA: glioblastoma multiforme (GBM), breast invasive carcinoma (BIC), lung squamous cell carcinoma (LSCC), kidney renal clear cell carcinoma (KRCCC), and colon adenocarcin-oma (COAD). Acquisition platforms of the expression traits and methylation data are shown in Table 1 [8, 9].
with 10,299 expression traits of BIC, GBM, LSCC, KRCCC, and COAD. Table 2 summarizes the final datasets for all cancer types used in this experiment. The feature values of each individual dataset were standardized such that the mean of each feature was zero and the standard deviation (SD) of each feature was one, which in turn resulted in the representation of different genomic features on expression traits without bias. For ease of understanding, the cancer profile names are as follows: BIC as breast, KRCCC as kid-ney, GBM as GBM, LSCC as lung, and COAD as colon.
High-dimensional regression methods
Least absolute shrinkage and selection operator (Lasso)
Lasso is a sparse regression framework that is a highly ef-fective method for detecting associations in high dimen-sional data with the ability for simultaneous feature selection and regression [4]. This regression method is used to identify methylation features that are associated with gene expression traits. For the available methylation featuresX1i,X2i,X3i, andXJi,(whereJis the total number of features andiis the index of the samples), the effect to
Yi, the expression level of a given gene in sampleiis mo-deled in a multivariate liner regression setting as follows:
Yi¼β0þβ1X1iþβ1X2iþ⋯βJXJi
þεi; εi eN0;σ2 ð1Þ
TheL1-penalized objective function is used to optimize and identify comparatively lesser genomic features that affect the expression trait.
minX
i
Yi−β0þβ1X1iþβ1X2iþ⋯βJXJi
2
þλX
j
βj
ð2Þ
The second term of equation (2) induces a sparse so-lution by driving many irrelevant beta coefficients to exact zeros. The result of Lasso is a set of features that are highly affined to the given expression trait and the implication power of each feature j is given by its re-gression coefficient βj, which provides a measure of how strongly or weakly each feature influences the traits. This procedure is applied to each of the multiple gene expression traits independently. Lasso is widely ef-fective, when J (features) > >N (number of samples), and only a small number of inputs are expected to in-fluence outputs. This is implemented in R using the
glmnet package [11]. The optimal parameter λ was chosen by cross-validation.
Graph guided fused lasso (GFLasso)
GFLasso, an extension of Lasso for multiple output re-gression, fuses regression coefficients across correlated output variables, which is particularly suitable for
Table 1Data acquisition platforms
Cancer type Expression data Methylation data
GBM Broad Institute HT-HG-U133A Platform JHU-USC-Illumina-DNA-Methylation Platform
LSCC JHU-USC-Human-Methylation-27 Platform
BIC UNC-Agilent-G4502A-07 Platform
COAD
KRCCC UNC-Illumina-Hiseq-RNASeq Platform
analyzing gene expression traits with an inherent net-work structure as output traits [5]. The method includes a fusion penalty along with a Lasso penalty such that the regression coefficients across correlated traits are fused using weighted connectivity. For any featurej, if any two traitsm andlare connected with an edge, then an add-itional penalty is imposed on the regression coefficients
βjm and βjl. The fusion penalty encourages the sizes of the effects βjm and βjl of each marker j on correlated traits m and l to be similar [12]. Experiments demon-strated that taking output structural information im-proved the sensitivity and specificity for recovering sparse structure and also increased the prediction accu-racy [13]. The method deals with multiple correlated traits rather than multiple independent traits as Lasso. In equation (3),yk ∈Rn represents the expression levels of gene k, X∈Rn×Jis the feature matrix, andβk∈RJis the regression coefficient vector for gene k, λ is a regularization parameter for sparsity, γ is a GFLasso regularization parameter andf(rml) is the correlation be-tween the two traits being fused. GFLasso was imple-mented in Matlab, with the help of the code present at ‘Sailing Lab’[14].
minX
k
yk−Xβk
T y
k−Xβk
þλX
k X j βjk
þ γ X
m;l
ð Þ∈E
f rð Þml
X
j
βjm−sign rð Þml βjl
ð3Þ
To select optimal regularization parameters, we first identified the median of non-zero beta coefficients and multiplied it by the total count of gene expression traits. The obtained value was assigned to lambda as an initial value. The initial gamma was fixed as 1. The observation was carried out using different λ and γ values, for ex-ample fixingγ and applying different values ofλ asλ/2,
λ, and 2λ, then fixing λand changingγtoγ/2,γ, and2γ, to verify the mean squared error, regression coefficients density, and time to execute the dataset. Through empir-ical study, we derived lambda and gamma values as those with the smallest MSE. Based on previous studies [5], the correlation threshold was fixed as 0.7 for all datasets throughout the experiments, and thusf(rml) was
always greater than or equal to 0.7 considering only very highly correlated gene expression features.
Sparse group lasso (SGL)
SGL in an input-structured spare regression, which utilizes a clustering or sub-group structure in feature variables, whereas GFLasso is based on the graph structure among output variables [6]. Both SGL and GFLasso were developed based on Lasso by considering the structural information in either input or output variables. SGL is a regularized model for linear regression with L1 (Lasso) and L2penalties that imposes sparsity both at the individual feature and group levels [15]. In equation (4),X(l)is the sub-matrix ofXwith columns corresponding to the predictors in groupl,β(l)the coefficient vector of that group, andplis the length ofβ(l). The Sparse Group Lasso can be used to identify genes that are particularly important in the pathways of interest.
min 1 2njjy−
Xm l¼1
Xð Þlβð Þljj2 2
þð1−αÞλX
m l¼1
ffiffiffiffi pl
p jjβð Þljj
2þαλjjβjj1
ð4Þ
Here,α∈[0, 1] is a parameter for convex combination of the Lasso and group Lasso penalties (α= 0 gives the group Lasso fit,α= 1 gives the Lasso fit). And n and m represents the number of samples and the number of feature groups, respectively. This is implemented in R using the‘SGL’package [16].
To define the grouping of features, we applied clustering techniques to feature data. The hierarchical clustering was chosen after observing k-means and k-median clustering techniques. The function hclust in R was used with Euclid-ean distance measurement and Ward’s linkage method for experiments. The number of groups was verified with dif-ferent trials such as 10, 20, 50, and 80, and 20 groups was chosen because of its better clustering results and MSE. For regularization parameter selection, the minimum value of the penalty parameter, as a fraction of the maximum value, was chosen to be 0.8 andαwas set as 0.1.
Structured input–output lasso (SIOL)
SIOL is a jointly structured input–output Lasso to sim-ultaneously take advantage of both input and output
Table 2Details of all cancer profiles before and after filtration process Cancer
type
Total samples
DNA Methylation mRNA Expression
Before filtering After filtering Before filtering After filtering
GBM 215 1,491 597 12,042 385
BIC 105 23,094 17,814
KRCCC 124 24,532 20,532
LSCC 105 27,578 12,042
structures. The method considers the occurrence of grouping effects on the inputs and outputs, which can be considered as a priori information [7]. Similar to GFLasso, this method considers output structural informa-tion; like SGL, this method considers group information. Experiments demonstrated that the models with either in-put or outin-put structure were less effective for suppressing noisy signals, resulting in many false-positives compared to when both input and output structural information were considered [17]. SIOL can produce significantly more accurate and faster results compared to other models. Grouping structure over inputs and output groups will be available as G = {g1, . . . , g|G|}and H = {h1, . . . , h|H|}, re-spectively. Group Lasso uses L1/L2penalization to enforce that all members in each group of input/output variables are jointly relevant or irrelevant to each output/input. SIOL is formulated as in equation (5). SIOL is imple-mented in Matlab, with the help of the code present at ‘Sailing Lab’[18].
min1
2jjY−BXjj 2
Fþλ1jjBjj1þλ2 XK k¼1
X
g∈G
jjβg
kjj2
þλ3 XJ
j¼1 X
h∈H
jjβj
hjj2 ð5Þ
Similar to SGL, the number of clusters/groups was chosen as 20. Parameter tuning was performed
individually on each dataset through cross-validation. The identified λ1 was 0.1,λ2 ranged from 0.25 to 0.35,
andλ3ranged from 0.15 to 0.25 for all cancer profiles.
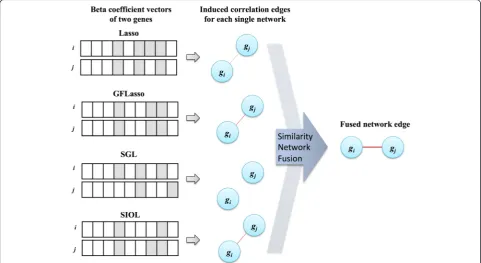
Construction of regression network and its integration Considering that two features with similar regression co-efficients over expression traits have equally prominent weightage for the traits, or the traits affected by a similar set of features may be regulated by common biological processes, we constructed a regression network based on regression coefficient similarity. To obtain an un-biased result, the regression coefficient weights were normalized in SNF. Suppose that both gene giand gene gjhave similar regression coefficients with respect to the
considered features as illustrated in Fig. 2. We thus de-fined an edge between gi and gj. This led to a network among the output variables, in our case a gene expres-sion network. We defined the methylation feature net-work using a similar idea. The edge weight was defined as the affinities of the regression coefficient vectors in SNF. In this study, to obtain more reliable true-positive signals, the results of all regression methods were com-bined as the integrative regression network, which easily revealed highly influential features, genes, and their as-sociations. The final fused network was constructed by identifying such gene pairs, as shown in Fig. 2. SNF was mainly used for integration of different similarity net-works into a single network [8]. The final fused network
can be used to apprehend shared information as well as complementary information of all datasets used for fu-sion by observing similarities of each network. Weaker similarities disappeared in the fused network, which in turn decreased noise, while also allowing for low weighted edges supported by all networks, increasing the signal strength.
In SNF, the edge weight matrixW is converted into a full kernel normalized weight matrixP=D−1W, where D is the diagonal matrix whose entriesD(i, j) =ΣjW(i, j). The local affinitySis measured usingKnearest neighbors on the weight matrixW. For the given two similarity matrices in a general SNF setting, an important step is to iteratively update the matrix corresponding to each of the affinity matrices as in equation (6).
Pð Þ1
tþ1¼Sð Þ1 P 2
ð Þ
t Sð Þ1 T
Pð Þ2
tþ1¼Sð Þ2 P 1
ð Þ
t Sð Þ2T
Pð Þc ¼Pð ÞT1 þPð ÞT2
2
ð6Þ
where Pt(1)+ 1is the similarity matrix for the first data type
after t iterations,Pt(2)+ 1is a similarity matrix of second data
type, andP(c)is overall status matrix. Note that the equa-tion (6) determines the similarity fusion of two data types, and the method ensembles are equally good for more than 2 datasets. In our experiments, we used four datasets, one from each regression result, and 20 iterations (t = 20) for applying a propagating effect on the fused network. Given the propagation effects of SNF, if two nodes do not have greater similarity in one network but possess strong simi-larity in another network, then the pairs will be propa-gated by SNF to the final fusion network. SNF was implemented in R using the ‘SNFtool’package, and both the affinity measurement and fusion techniques were sup-ported by this package [19]. Network fusion was carried out using a non-linear method that works on message-passing theory [20]. The number of neighbors (K) and hyper parameter (alpha) are the two parameters deter-mined by SNF. We considered the range of K to be 2–20 and forαto be 0.3–0.8. For all combinations of K andα, affinity measurement was performed using SNFtool and correlation was measured using equation (7).
f W ;wf¼
XN i¼1
SIM w f;wi
N
þ P
N−1
i¼1 XN j¼iþ1
1−SIM w i;wj
N 2
ð7Þ
whereN= 4,w1,w2,w3, andw4are the affinity sets mea-sured using SNFtool and wf is the final fused set ob-tained by fusing w1, w2, w3, and w4. SIM (wf, wi) is the correlation measurement between affinity setswfand wi. Finally, the highest correlation and its respective Kand
α for each cancer dataset were identified. Using the regression coefficient matrix as-is gives a similarity measurement of methylation features, while transposing the regression coefficient matrix gives the similarity measurement of expression traits. Using the affinity matrices and fusion techniques, we computed the opti-mal value ofKandαfor all cancer profiles.
Identifying a cutoff for edge filtering in regression networks A cutoff was computed to choose the gene pairs with more significance from each individual affinity matrix and from the final fused matrix as in [21]. The affinity matrix of each method was randomly permuted 100 times and a cutoff value was determined using equation (8). The identified cutoff is a point at which the total number of edges in the permuted network is less than the real network and the largest connected component is larger than any other connected component. W de-notes a real network andWPkis thekthpermutation net-work. E(X) and C(X) are the number of edges and largest connected components in the network X. In equation (8), the numerator is the average of permuted network’s total number of edges and largest connected components, while the denominator is the number of edges and largest connected components of the real network.
f Wð ;W PÞ ¼argminc∈½ 0;112 1 W P
j j
XW P
j j
k¼1 E W Pc
k
E Wð cÞ þ
1 W P
j j
XW P
j j
k¼1 C W Pc
k
C Wð cÞ 2 6 6 6 6 4 3 7 7 7 7 5 where
Wc¼ ð Þji;j ð Þi;j∈W and w i;j≥c
W Pc
k¼ ð Þji;j wp kð Þi;j∈W Pk and wp kð Þi;j≥c
n o
ð8Þ
Results
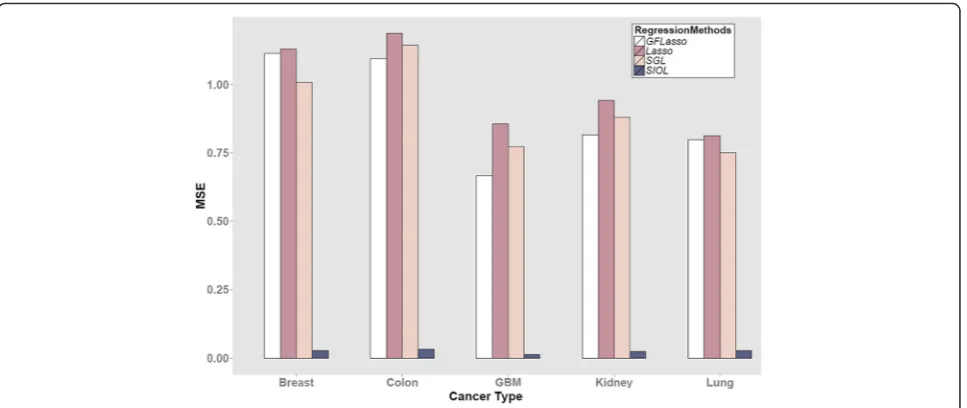
Performance investigation of different regression methods We first compared the performance of each regression method considered in this study. To evaluate each method, 2/3 of the dataset was used as training data and the remaining 1/3 was used as test data. Figure 3 shows the MSE of all methods for the five types of cancer data-sets. A smaller MSE implies better performance.
Lasso tend to produce comparable results, while Lasso, which uses no structural information, produces the lar-gest MSE. The overall performance in terms of MSE in decreasing order was SIOL, GFLasso, SGL, and Lasso. The procedure was applied for multiple cancer profiles as shown in Fig. 3 and the behavior was observed to be similar for all cancer data types.
Discovering common genomic features of all methods without fusion technique
We further investigated the combined results of all four methods to identify influential predictors of cancer. The common predictors that were retrieved using all regres-sion methods were collected. We focused on genomic features identified using all methods, as they are the strongest predictors of the expression traits. As the β
value is the measure of how strongly each predictor vari-able influences the response varivari-able, highly impacted gene pairs (top 200) based on theβvalues were collected for each of the four regression methods.
Figure 4 shows the Venn diagrams for the common methylation features associated with expression traits between different regression methods. Figure 1(a) to (e) shows the result using the top 200 regression coefficients on the five cancer profiles. Overall, the number of com-mon features is very small across all cancer types, and between any pair of regression methods. The common genomic features found using the methods GFLasso and SIOL, which showed higher values than any other com-bination, are 29, 43, 24, 30, and 21 for breast, colon, GBM, kidney, and lung cancer profiles, respectively. Consideration of structural information (GFLasso and
Fig. 3Comparison of regression methods in terms of mean squared error (MSE)
SIOL) appeared to be the main cause of this behavior. The fusion penalty applied for output variants was com-mon in both methods.
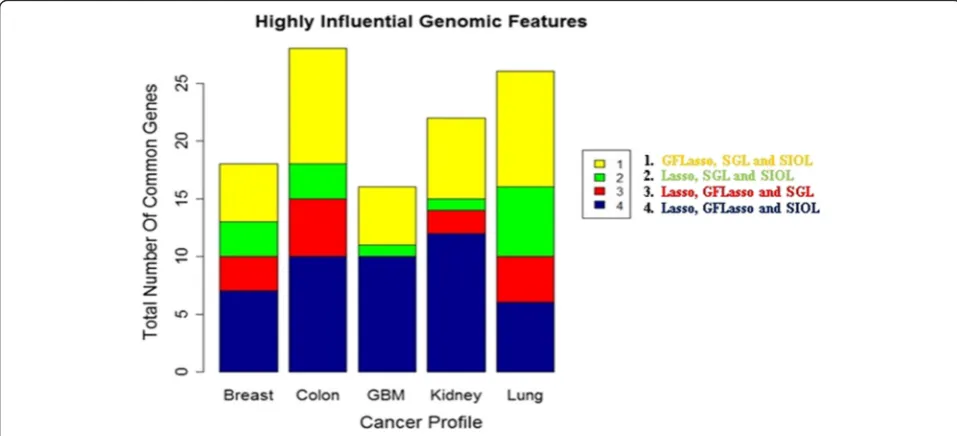
Figure 5 is the summary of the common genomic fea-tures identified by at least 3 regression methods. The largest number of identified genomic features was the combination of GFLasso and SIOL, i.e. sets 1 and 4. As observed earlier, considering structural information made the methods operative for identifying the strongest predictor signals of response variables. The total num-bers of genomic features identified from the top 200 regression coefficients using three or above regression methods were 21 for the breast, 30 for colon, 20 for GBM, 24 for kidney, and 27 for lung cancer datasets.
Figures 4 and 5 show that the results from different re-gression methods are very inconsistent. A naïve combin-ation of the results would lead to a biased and inconsistent study. We also observed that selecting the top 50,100, or 150 regression coefficients showed a common trend of 0 (zero) common genomic features identified by all four re-gression methods (see Additional file 1). Figure 4 shows that the common genes identified by all regression methods from the top 200 regression coefficients were negligible, such as 3, 2, 4, 2, and 1 for the breast, colon, GBM, kidney, and lung cancer data sets, respectively. Therefore, rather than selecting a single regression method, we integrated the results obtained using various regression methods.
Integrative regression network
Permutation scheme to select significant pairs in regression networks
Regression coefficients measure the association strength of genomic features and expression traits. Fusion of these
beta coefficients using similarity measurement was ob-served for different cancer profiles. A similar study can be conducted using correlation measurement, but this correl-ation is highly prone to identifying additional indirect gen-omic associations, which may redundantly appear across different types of genomics. We measured the affinities or similarities of methylation features (using the beta matrix) and mRNA expression (by transposing the beta matrix). The four affinity matrices from four regression methods were fused using SNF. The final integrative network was constructed with the strongest affined pairs from each network and from those pairs that were acknowledged by all networks (either stronger or weaker affinity value). Additionally, the affinity of each individual regression method versus the final fused network was examined.
We computed the cutoff for identifying significant pairs in the network using equation (8). Figure 6 shows the network properties with respect to varying cutoffs on the fused breast cancer network in comparison with randomly permuted networks. Figure 6a shows the ‘number of edges’ in the real network (red line) and in the network of 100 times randomly permuted datasets (gray lines) and Fig. 6b shows the size of the ‘largest connected component’in the real network (red line) and the network of 100 times randomly permuted datasets (gray lines). The cutoff obtained using equation (8) for Fig. 6 was 0.0027. Cutoff points were acquired for the af-finity matrix of each regression method, and for the fused matrix. For example, the cutoffs found for each af-finity matrix and fused network of the colon cancer dataset were 0.2 for GFLasso, 0.225 for Lasso, 0.334 for SGL, 0.175 for SIOL, and for 0.003 fused networks.
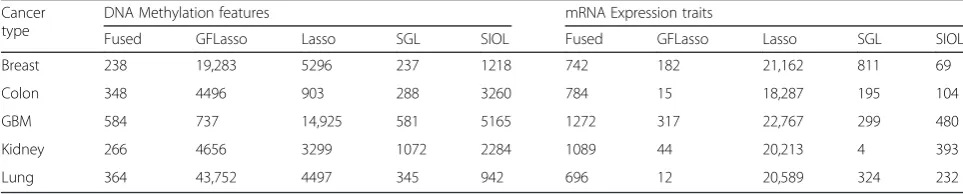
Using the cutoff found for all regression methods of all cancer profiles, genomic pairs above the identified cutoffs for both methylation and mRNAs were collected. The overall genomic pairs of methylation and mRNAs are shown in Table 3. It is clear that for each cancer profile, the fused pairs were lower (the total number of genomic feature pairs identified using the four regression methods above the cutoff for breast cancer profile was 19,283 + 5296 + 237 + 1218 = 26,034, but the identified genomic pairs in the fused network was only 238). Hence, the fused network discarded these spurious values and identified stronger affined pairs from each dataset.
Regression network properties
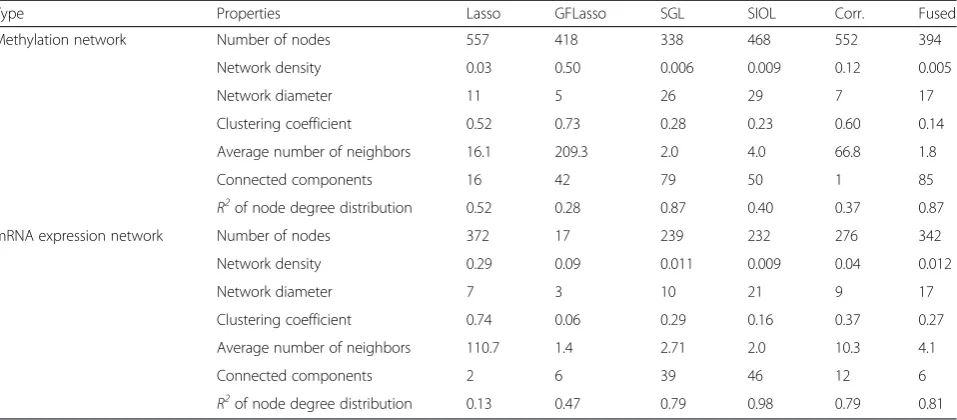
Using the selected pairs shown in Table 3 we con-structed and examined networks. The concon-structed net-work revealed that obtaining a less spurious association was possible only because of combining and integrating the effects of all regression methods. The final fused net-work showed high confidence, linearity, and modularity. In our experiments, networks were constructed for all cancer profiles, and we studied network properties such as the number of nodes, clustering coefficient, network density, and R2of node degree distribution, among other properties, in Cytoscape [22]. For comparison, the
correlation network using methylation and expression data was constructed separately. The edges in this cor-relation network were those having a p-value less than 0.01 divided by the total number of possible pairs in the correlation test. The resulting network properties are summarized in Table 4 for lung cancer, which showed that the fused network was more efficient for identifying a lower number of nodes in association, had a greater number of connected components and exhibited a better R2of node degree distribution. We found similar proper-ties for all other cancer types studied. The R2 value for the power-law distribution of all networks (all cancer profiles) showed strong scale freeness [23]. Hence, the proposed technique is effective for identifying crucial cancer-causing genes and discarding unwanted genomic features.
Particularly, the fused network showed a better scale-freeness compared with the conventional correlation network. Figure 7 compares the R2 values between the integrative regression network denoted by “Fused” and the conventional correlation network measured on the data matrix, not the regression coefficients. For nearly all datasets, except for the kidney dataset in the methy-lation network and the colon dataset in the mRNA network, the R2 measure of the integrated network
Table 3Number of edges after filtering by the identified cutoff in each individual and the fused network Cancer
type
DNA Methylation features mRNA Expression traits
Fused GFLasso Lasso SGL SIOL Fused GFLasso Lasso SGL SIOL
Breast 238 19,283 5296 237 1218 742 182 21,162 811 69
Colon 348 4496 903 288 3260 784 15 18,287 195 104
GBM 584 737 14,925 581 5165 1272 317 22,767 299 480
Kidney 266 4656 3299 1072 2284 1089 44 20,213 4 393
Lung 364 43,752 4497 345 942 696 12 20,589 324 232
was significantly larger than that for the correlation measurement.
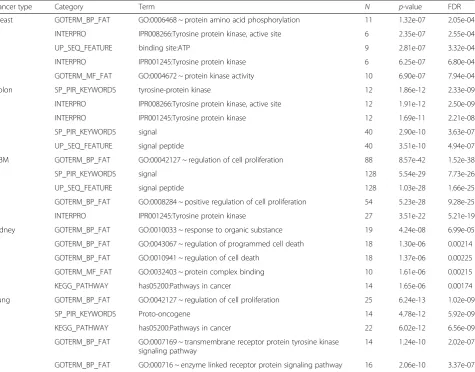
Functional characterization of the identified genes The functional annotation test was performed using Gene Ontology (GO) Biological Process (BP) for the col-lection of feature genes and expression traits identified in the largest connected component of each network using the tool DAVID [24, 25]. Our studies revealed that (GO: 0042127) regulation of cell proliferation and tyro-sine protein kinase and cancer pathway genes, which are overexpressed in high percentages of human cancers, were recognized. The top 5 significantly enriched terms for common methylation features are shown in Table 5.
The enriched GO BP terms with the lowest FDR cor-rected p-values were mainly associated with the GBM cancer profile for (GO: 0042127) regulation of cell proliferation, signal, and signal peptide with FDR cor-rected p-values as 1.52E-38, 7.73E-26, and 1.66E-25, respectively. Similarly, functional enrichment studies were performed for expression traits (see Additional file 2). These traits were greatly similar and highly connected in the fused network. The lowest FDR p -values were mostly related to chromosomal rearrange-ment, in nearly all cancer profiles with FDR corrected
p-values as 5.79E-127 (minimum among all), and hsa05200: pathways in cancer with FDR corrected p -values as 4.22E-28.
Table 4Network properties of methylation features and mRNA expression trails of Lung cancer profile
Type Properties Lasso GFLasso SGL SIOL Corr. Fused
Methylation network Number of nodes 557 418 338 468 552 394
Network density 0.03 0.50 0.006 0.009 0.12 0.005
Network diameter 11 5 26 29 7 17
Clustering coefficient 0.52 0.73 0.28 0.23 0.60 0.14
Average number of neighbors 16.1 209.3 2.0 4.0 66.8 1.8
Connected components 16 42 79 50 1 85
R2of node degree distribution 0.52 0.28 0.87 0.40 0.37 0.87
mRNA expression network Number of nodes 372 17 239 232 276 342
Network density 0.29 0.09 0.011 0.009 0.04 0.012
Network diameter 7 3 10 21 9 17
Clustering coefficient 0.74 0.06 0.29 0.16 0.37 0.27
Average number of neighbors 110.7 1.4 2.71 2.0 10.3 4.1
Connected components 2 6 39 46 12 6
R2of node degree distribution 0.13 0.47 0.79 0.98 0.79 0.81
Fig. 7Comparison ofR2value between the integrative regression network (denoted by“Fused”) and the correlation network.aMethylation
In enrichment study using gene expression networks, the cancer-related terms were prominently observed, which may be because of the procedure of intersecting expression genes with COSMIC cancer census genes. To cross-verify this result, we randomly selected 30 genes from COSMIC, performed a gene enrichment test, col-lected the top 5 terms, and repeated the same procedure for 30 iterations. Seven of the top 10 terms were chromosomal rearrangements, but their smallest FDR corrected p-values were multiple times larger than the
p-values obtained from enrichment test of expression traits. A similar trend was identified for other significant terms, such as disease mutation, nucleus, and hsa05200: pathways in cancer, among others.
From the fused networks of methylation features, we collected hub genes that are with highest node degrees (see Additional file 3). Crucial cancer-causing genes were identified from the fused network, including AKT, KRAS, fibroblast growth factor receptors, anaplastic lymphoma kinase, and ERBBs. Previous studied
demonstrated that the PI(3)K/AKT pathway is a strong therapeutic target in cell renal cell carcinoma [26]. The KRAS oncogene is mutated in approximately 35–45 % of colorectal cancers and KRAS mutations are consid-ered to be more predominant in pancreatic, thyroid, colorectal, and lung cancers [27, 28]. The anaplastic lymphoma kinase gene was also found to be a relevant term for lung cancer [29]. Overexpression of FEFRs can lead to multiple cancer types and higher levels of fibro-blast growth factor receptor was found in prostate, breast, lung, brain, gastric, sarcoma, head and neck, and multiple myeloma cancers [30]. ERBB2 is typically amp-lified in tumors and overexpressed in breast cancer, and ERBBs are very important in cancer studies [31, 32].
Discussion and Conclusion
In this study, we presented an integrative regression net-work by combining the results of different regression methods. Given the highly correlated nature of genomic profiles, the association analysis of conventional
Table 5Significantly enriched GO BP terms (top 5) for the largest connected component of integrative regression network of methylation features
Cancer type Category Term N p-value FDR
Breast GOTERM_BP_FAT GO:0006468 ~ protein amino acid phosphorylation 11 1.32e-07 2.05e-04
INTERPRO IPR008266:Tyrosine protein kinase, active site 6 2.35e-07 2.55e-04
UP_SEQ_FEATURE binding site:ATP 9 2.81e-07 3.32e-04
INTERPRO IPR001245:Tyrosine protein kinase 6 6.25e-07 6.80e-04
GOTERM_MF_FAT GO:0004672 ~ protein kinase activity 10 6.90e-07 7.94e-04
Colon SP_PIR_KEYWORDS tyrosine-protein kinase 12 1.86e-12 2.33e-09
INTERPRO IPR008266:Tyrosine protein kinase, active site 12 1.91e-12 2.50e-09
INTERPRO IPR001245:Tyrosine protein kinase 12 1.69e-11 2.21e-08
SP_PIR_KEYWORDS signal 40 2.90e-10 3.63e-07
UP_SEQ_FEATURE signal peptide 40 3.51e-10 4.94e-07
GBM GOTERM_BP_FAT GO:00042127 ~ regulation of cell proliferation 88 8.57e-42 1.52e-38
SP_PIR_KEYWORDS signal 128 5.54e-29 7.73e-26
UP_SEQ_FEATURE signal peptide 128 1.03e-28 1.66e-25
GOTERM_BP_FAT GO:0008284 ~ positive regulation of cell proliferation 54 5.23e-28 9.28e-25
INTERPRO IPR001245:Tyrosine protein kinase 27 3.51e-22 5.21e-19
Kidney GOTERM_BP_FAT GO:0010033 ~ response to organic substance 19 4.24e-08 6.99e-05
GOTERM_BP_FAT GO:0043067 ~ regulation of programmed cell death 18 1.30e-06 0.00214
GOTERM_BP_FAT GO:0010941 ~ regulation of cell death 18 1.37e-06 0.00225
GOTERM_MF_FAT GO:0032403 ~ protein complex binding 10 1.61e-06 0.00215
KEGG_PATHWAY has05200:Pathways in cancer 14 1.65e-06 0.00174
Lung GOTERM_BP_FAT GO:0042127 ~ regulation of cell proliferation 25 6.24e-13 1.02e-09
SP_PIR_KEYWORDS Proto-oncogene 14 4.78e-12 5.92e-09
KEGG_PATHWAY has05200:Pathways in cancer 22 6.02e-12 6.56e-09
GOTERM_BP_FAT GO:0007169 ~ transmembrane receptor protein tyrosine kinase signaling pathway
14 1.24e-10 2.02e-07
correlation tests or multiple regression methods can produce inconsistent results. To address this issue and construct a more reliable association network from gen-omic profiles, we constructed a regression network by measuring the similarity of regression coefficient vectors in a high-dimensional multivariate multiple output re-gression setting. The results from different rere-gression methods were further fused using a similarity fusion technique. The fused network facilitated identification of the strongest possible signal and as well as weaker sig-nals, which increased the signal to noise ratio.
The GO enrichment test revealed that the final fused network could identify genes with the lowest FDR cor-rected p-values, and numerous cancer-related features were recognized using the fusion technique. The genes identified using the fusion technique were highly similar behavioral genes for the cancer profile, i.e. if geneg1and
g2has nearly the same magnitudes of the regression co-efficient and were identified by two or more regression methods or by a single regression method but with a very higher magnitude of similarity, then the SNF allows for the propagation of genes g1 and g2as nodes in the final network with their affinities (similarities) as edges. Understanding cancer using this process can provide guidance for predicting the prognosis, developing effec-tive therapies, and identifying subtypes [33] of cancer.
We developed an effective method for analyzing genes involved in cancer that integrates results from different regression methods. Although our analysis was done on each of the different cancer types separately, the result can be easily applied to integrate the results from mul-tiple cancer types that can lead to common behavior across cancers. Based on the ease of the fusion tech-nique (SNF), this method can be conveniently adopted to different types of studies in different domains. The properties of SNF such as propagation effect over itera-tions, robustness against noise and scaling to a large number of genes enables application of this method to many domains.
Additional files
Additional file 1:Venn Diagram of top 100 regression coefficients. Combining different regression methods results led the study with inconsistent results. To study this we choosed top 200 coefficients, as selecting top 50,100, or 150 regression coefficients showed a common trend of 0 (zero) common genomic features identified by all four regression methods. This file shows the same scenario with top 100 coefficients. (JPEG 135 kb)
Additional file 2:mRNA Network Properties. Significantly enriched GO BP terms (top 5) for the largest connected component of integrative regression network of mRNA expressions. (JPEG 282 kb)
Additional file 3:Genes With Node Degree 4 and above. This file provides a list of methylation and mRNA genes, those were collected from the highly connected networks (fused) of different cancer profiles. (ZIP 32 kb)
Declaration
Publication of this article has been funded by Basic Science Research Program through the National Research Foundation (NRF) of Korea funded by the Ministry of Science, ICT, and Future Planning (MSIP) (2014R1A1A3051169 & 2010–0028631). This article has been published as part of BMC Medical Genomics Volume 9 Supplement 1, 2016. Selected articles from the 5th Translational Bioinformatics Conference (TBC 2015): medical genomics. The full contents of the supplement are available online https://bmcmedgenomics.biomedcentral.com/articles/supplements/volume-9-supplement-1.
Availability of data and materials
The TCGA datasets used for analysis are publicly available at http://tcga-data.nci.nih.gov/tcga/.
Authors’contributions
RR and KS designed and developed the study. HJ and RR formed the experiments and inferred the results. KS and HJ provided experienced guidance and timely support. RR and KS wrote the manuscript and all authors read the manuscript and approved it.
Competing interests
The authors declared that they have no competing interests.
Consent for publication Not applicable.
Ethics approval and consent to participate Not applicable.
Published: 12 August 2016
References
1. TCGA. The Cancer Genome Atlas. Available from: http://cancergenome.nih.gov/. 2. ICGC. International Cancer Genome Consortium Available from: https://icgc.
org/icgc
3. Stat Fact Sheets. Surveillance, Epidemiology, and End Results Program Turning Cancer Data Into Discovery. Available from: http://seer.cancer.gov/ statfacts/.
4. Tibshirani R.Regression Shrinkage and Selection via the Lasso.Journal of the Royal Statistical Society. Series B (Methodological). 1996;58(1):267–88. 5. Kim S, Sohn K-A, Xing EP. A multivariate regression approach to association
analysis of a quantitative trait network. Bioinformatics. 2009;25(12):i204–12. 6. Simon N et al. A Sparse-Group Lasso. J Comput Graph Stat. 2012;22(2):231–45. 7. Lee S, Xing EP. Leveraging input and output structures for joint mapping of
epistatic and marginal eQTLs. Bioinformatics. 2012;28(12):i137–46. 8. Wang B et al. Similarity network fusion for aggregating data types on a
genomic scale. Nat Meth. 2014;11(3):333–7.
9. Sohn K-A et al. Relative impact of multi-layered genomic data on gene expression phenotypes in serous ovarian tumors. BMC Syst Biol. 2013;7 Suppl 6:S9.
10. COSMIC.Catalogue of somatic mutations in cancer. Available from: http://cancer.sanger.ac.uk.
11. Friedman J, Hastie T, Tibshirani R. Regularization paths for generalized linear models via coordinate descent. J Stat Softw. 2010;33(1):1.
12. Marttinen P et al. Genome-wide association studies with high-dimensional phenotypes. Stat Appl Genet Mol Biol. 2013;12(4):413–31.
13. Sohn K-A, Kim S. Joint estimation of structured sparsity and output structure in multiple-output regression via inverse-covariance regularization. In: Lawrence N, Girolami M, editors. International Conference on Artificial Intelligence and Statistics, 21-23 April 2012. Vol. 22. La Palma, Canary Islands: JMLR W&CP; 2012. p. 1081–9.
14. Sailing Lab.GFlassoAvailable from: http://www.sailing.cs.cmu.edu/main/ ?page_id=463.
15. Iordache, M.-D. A sparse regression approach to hyperspectral unmixing. PhD diss. INSTITUTO SUPERIOR TÉCNICO, Department of Electrical and Computer Engineering; 2011.
17. Lee S, Xing EP. Structured Input-Output Lasso, with Application to eQTL Mapping, and a Thresholding Algorithm for Fast Estimation. 2012. arXiv preprint arXiv:1205.1989.
18. Sailing Lab.Struct I/O LassoAvailable from: http://www.sailing.cs.cmu.edu/ main/?page_id=484.
19. SNFtool.Similarity Network FusionAvailable from: https://cran.r-project.org/ web/packages/SNFtool/index.html.
20. Pearl J. Probabilistic reasoning in intelligent systems: networks of plausible inference: Morgan Kaufmann; 2014.
21. Hu T et al. Characterizing genetic interactions in human disease association studies using statistical epistasis networks. BMC bioinformatics. 2011;12(1):364. 22. Cytoscape. Available from: http://www.cytoscape.org/cy3.html
23. Zhang B, Horvath S. A general framework for weighted gene co-expression network analysis. Stat Appl Genet Mol Biol. 2005;4(1):Article 17.
24. da Huang W, Sherman BT, Lempicki RA. Systematic and integrative analysis of large gene lists using DAVID bioinformatics resources. Nat Protoc. 2009; 4(1):44–57.
25. da Huang W, Sherman BT, Lempicki RA. Bioinformatics enrichment tools: paths toward the comprehensive functional analysis of large gene lists. Nucleic Acids Res. 2009;37(1):1–13.
26. The Cancer Genome Atlas Research, N. Comprehensive molecular characterization of clear cell renal cell carcinoma. Nature. 2013;499(7456):43–9. 27. Tan C, Du X. KRAS mutation testing in metastatic colorectal cancer. World J
Gastroenterol WJG. 2012;18(37):5171–80.
28. Markman B et al. EGFR and KRAS in colorectal cancer. Adv Clin Chem. 2010; 51:71–119.
29. El-Telbany A, Ma PC. Cancer Genes in Lung Cancer: Racial Disparities: Are There Any? Genes Cancer. 2012;3(7–8):467–80.
30. Ahmad I, Iwata T, Leung HY. Mechanisms of FGFR-mediated carcinogenesis. Biochimica et Biophysica Acta (BBA) Mole Cell Res. 2012;1823(4):850–60. 31. Yarden Y, Pines G. The ERBB network: at last, cancer therapy meets systems
biology. Nat Rev Cancer. 2012;12(8):553–63.
32. Hynes NE, Lane HA. ERBB receptors and cancer: the complexity of targeted inhibitors. Nat Rev Cancer. 2005;5(5):341–54.
33. Yang D et al. Integrated analyses identify a master microRNA regulatory network for the mesenchymal subtype in serous ovarian cancer. Cancer Cell. 2013;23(2):186–99.
• We accept pre-submission inquiries
• Our selector tool helps you to find the most relevant journal
• We provide round the clock customer support
• Convenient online submission
• Thorough peer review
• Inclusion in PubMed and all major indexing services
• Maximum visibility for your research
Submit your manuscript at www.biomedcentral.com/submit