scheme for the ALADINcy36 and ALARO-0 models
R. Hamdi1, D. Degrauwe1, A. Duerinckx1,2, J. Cedilnik3, V. Costa4, T. Dalkilic5, K. Essaouini6, M. Jerczynki7, F. Kocaman5, L. Kullmann8, J.-F. Mahfouf9, F. Meier10, M. Sassi11, S. Schneider10, F. Vá ˇna12,*, and P. Termonia1,2 1Royal Meteorological Institute, Brussels, Belgium
2Department of Physics and Astronomy, Ghent University, Ghent, Belgium 3Meteorological Office, Slovenian Environment Agency, Ljubljana, Slovenia 4Instituto de Meteorologia, Lisbon, Portugal
5Turkish State Meteorological Service, Ankara, Turkey
6CNRM, Direction de la météorologie nationale, Casablanca, Morocco 7Instytut Meteorologii I Gospodarski Wodnej, Krakow, Poland 8Hungarian Meteorological Service, Budapest, Hungary
9CNRM/GAME, UMR3589, Météo-France, CNRS, Toulouse, France 10Zentralanstalt für Meteorologie und Geodynamik, Vienna, Austria 11Institut National de la Météorologie, Tunis, Tunisia
12Czech Hydrometeorological Institute, Prague, Czech Republic *present address: ECMWF, Reading, UK
Correspondence to: R. Hamdi ([email protected])
Received: 17 June 2013 – Published in Geosci. Model Dev. Discuss.: 25 July 2013 Revised: 16 November 2013 – Accepted: 25 November 2013 – Published: 7 January 2014
Abstract. The newly developed land surface scheme
SUR-FEX (SURFace EXternalisée) is implemented into a limited-area numerical weather prediction model running opera-tionally in a number of countries of the ALADIN and HIRLAM consortia. The primary question addressed is the ability of SURFEX to be used as a new land surface scheme and thus assessing its potential use in an operational config-uration instead of the original ISBA (Interactions between Soil, Biosphere, and Atmosphere) scheme. The results show that the introduction of SURFEX either shows improvement for or has a neutral impact on the 2 m temperature, 2 m rel-ative humidity and 10 m wind. However, it seems that SUR-FEX has a tendency to produce higher maximum tempera-tures at high-elevation stations during winter daytime, which degrades the 2 m temperature scores. In addition, surface ra-diative and energy fluxes improve compared to observations from the Cabauw tower. The results also show that promis-ing improvements with a demonstrated positive impact on the forecast performance are achieved by introducing the town energy balance (TEB) scheme. It was found that the use of
SURFEX has a neutral impact on the precipitation scores. However, the implementation of TEB within SURFEX for a high-resolution run tends to cause rainfall to be locally con-centrated, and the total accumulated precipitation obviously decreases during the summer. One of the novel features de-veloped in SURFEX is the availability of a more advanced surface data assimilation using the extended Kalman filter. The results over Belgium show that the forecast scores are similar between the extended Kalman filter and the classical optimal interpolation scheme. Finally, concerning the ver-tical scores, the introduction of SURFEX either shows im-provement for or has a neutral impact in the free atmosphere.
1 Introduction
such as soil, vegetation and sea. The budgets depend strongly on the characteristics of the underlying surface, and with the increase of resolution in most applications up to kilometre scales, the role of the surface interactions in atmospheric models is steadily increasing.
The international ALADIN (Aire Limitée Adaptation Dynamique Développement International) consortium (AL-ADIN, 1997) has over the past two decades developed a limited-area model (LAM) to serve the specific needs of its participating partners. Currently this consortium consist of 16 partners, covering Europe and the Mediterranean re-gion and including some north African countries. The code of the ALADIN model (Bubnová et al., 1995) is mostly shared with the code of the French global ARPEGE (Ac-tion de Recherche Petite Echelle Grande Echelle) model and the IFS (Integrated Forecast System) of ECMWF (European Centre for Medium-Range Weather Forecasts). The lateral-boundary conditions (LBCs) of the operational ALADIN model configurations are imposed by the Davies scheme (Davies, 1976; Radnóti, 1995; Termonia et al., 2012) at reg-ular time intervals of 3 h (Termonia et al., 2009) with LBC data provided by either ARPEGE, IFS or a larger ALADIN domain. For the present study the version of Radnóti (1995) is used.
ALADIN has been further developed with a physics pa-rameterization package called ALARO, which has been de-signed specifically to be run at convection-permitting res-olutions. The key concept behind this package lies in the precipitation and cloud scheme called modular multiscale microphysics and transport (3 MT), developed by Gerard and Geleyn (2005), Gerard (2007) and Gerard et al. (2009). The multi-scale behaviour of 3 MT has been validated in a NWP context up to a spatial resolution of 4 km (see Gerard et al., 2009). The ALARO model version ALARO-0, which has been used for the present study, utilizes the ACRANEB scheme for radiation (Ritter and Geleyn, 1992), a semi-Lagrangian horizontal diffusion scheme called SLHD (Váˇna et al., 2008), some pseudo-prognostic turbulent ki-netic energy (TKE) scheme (pTKE, i.e. a Louis-type scheme for stability dependencies, but with memory, advection and auto-diffusion of the overall intensity of turbulence) and a statistical sedimentation scheme for precipitation within a prognostic-type scheme for microphysics (Geleyn et al., 2008). The ALARO physics package is coupled to the dy-namics of the ALADIN model via a physics–dydy-namics in-terface based on a flux-conservative formulation of the equa-tions proposed by Catry et al. (2007). The configuration of the model with these physics runs operationally in a number of countries of the ALADIN and HIRLAM consortia1for the national NWP applications since 2008.
Historically ARPEGE, ALADIN and ALARO mod-els relied on the ISBA scheme developed by Noilhan and Planton (1989) and Noilhan and Mahfouf (1996) for
1At, Be, Cz, Hr, Hu, No, Pt, Ro, Se, Si, Sk and Tr.
the parameterization of the surface processes. It is also used within the ARPEGE climate model of Météo-France (Mahfouf et al., 1995). The ISBA scheme has also been im-plemented in the meso-NH model of Météo-France (Lafore et al., 1998). Masson (2000) developed the town energy balance (TEB) scheme for the simulation of the interac-tions with urban areas and this scheme became part of the meso-NH model. Within the ALADIN community the code also runs with the physics parameterization of meso-NH. This configuration is called the AROME model (Seity et al., 2011).
During the last decade, the surface scheme, including ISBA and TEB, has been externalized from the core of the atmospheric meso-NH model following the approach of Polcher et al. (1998) and Best et al. (2004). This led to the creation of the SURFEX scheme (SURFace EXternalisée). Additionally, parameterizations for all components of the surface (ocean and inland water) have been added to SUR-FEX. Recently, a new multilayer parameterization for the natural and urban canopy (Hamdi and Masson, 2008; Masson and Seity, 2009) was also added to SURFEX in the so-called CANOPY scheme. The rationale for this externalization was twofold. First, once this externalization is done, and if the scheme is plugged into any applications, it becomes available within all the applications. Secondly, SURFEX contains the ISBA scheme for its soil and vegetation interactions, so there is a priori no need to maintain the ISBA scheme separately in the different model versions ARPEGE, ALADIN, AROME, ALARO, ARPEGE climate and ALADIN climate. In opera-tional contexts it is important that the scheme is sufficiently numerically stable to run with the long time steps imposed by the operational applications. Hence the implicit coupling proposed by Best et al. (2004) has been used. The physio-graphic characteristics of the surface in SURFEX are speci-fied by the ECOCLIMAP database (see Masson et al. (2003) and Champeaux et al. (2005)). An extra advantage of this ex-ternalization is that SURFEX can be used in an offline mode for scientific applications where the atmospheric feedbacks are not taken into account, for instance for studying the ur-ban heat island (UHI) evolution (Hamdi et al., 2009, 2011).
of ARPEGE/ALADIN/ALARO models, reproduce forecast performance that is equivalent or better in terms of the set of verification scores that are put forth in the operational con-text of each of the participating ALADIN partners? Apart from the user-oriented goal of allowing a science-based deci-sion for the configuration of the NWP system by each partner within the consortium, this provides a very extensive valida-tion of the SURFEX scheme rather than a specific validavalida-tion such as in Hamdi et al. (2012) for the use of TEB within ALARO. Finally, it should be stressed that the present pa-per does not address other important issues which represent crucial criteria such as efficiency, code optimization, code design, its interface to the atmospheric part and the user-friendliness of the SURFEX implementation.
2 Model: description and configurations
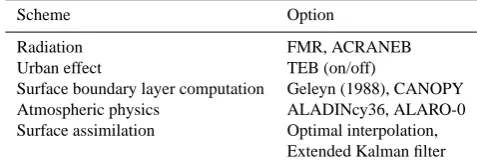
The description of SURFEXv7.2 can be found in Masson et al. (2013) (in this SURFEX special issue). Note that at the time of testing, we used version 5 of SURFEX. Table 1 presents a summary of the different model configurations available within the model code.
2.1 Two radiation schemes
There are two radiation schemes available in the model code. AROME and ALADIN use the ECMWF radiation scheme (referred to as FMR hereafter). It has a shortwave radiation scheme (Fouquart and Bonnel, 1980) with 6 spectral bands, whereas the longwave radiation with 16 spectral intervals is computed by the rapid radiative transfer model (RRTM) code (Mlawer et al., 1997) using climatological distributions of ozone and aerosols. For the ozone monthly profiles it uses the analytical functions that have been fitted to the UK Universi-ties’ Global Atmospheric Modelling Programme (UGAMP) climatology (Li and Shine, 1995). Distributions of organic, sulfate, dust-like and black carbon, as well as uniformly distributed stratospheric background aerosols, are extracted from the Tegen climatology (Tegen et al., 1997).
The ALARO physics package has been developed with the ACRANEB scheme built on Ritter and Geleyn (1992). This is a two-stream approximation with a net exchange rate (NER) formulation for solving the thermal part. All the
computations consider two spectral bands (for the solar and thermal part) with the contribution of three gases (H2O, CO2 equivalent and O3). The gaseous optical depths are computed by means of a Padé fit of the equivalent scale width computed by the Malkmus formula (Malkmus, 1967). The scheme has been extended by using a Voigt-line profile for coping with the high model levels (Geleyn et al., 2005). These schemes, FMR and ACRANEB, represent two different approaches for the problem of the extensive computing cost in radia-tion schemes. FMR is called intermittently to save computing costs. Only the shortwave flux dependency on the zenithal solar angle is updated at every time step. The rest of the ra-diation computations are updated with a frequency of 1 h for ALADIN and 15 min for AROME. This is how SURFEX is used in the Météo-France versions of ALADIN (Masson et al., 2013).
ACRANEB, on the other hand, is in itself designed for cost effectiveness and is called every time step. Both schemes can be called in all model versions of the ARPEGE/ALADIN/ALARO model configurations.
2.2 Urban effects
TEB is based on the canyon concept, where the town is repre-sented by a roof, a road and two facing walls. The advantage is that relatively few individual surface energy balance evalu-ations need to be resolved and radiation interactions are sim-plified, and therefore computation time is kept low. Water, energy and momentum fluxes are computed by each parame-terization and then aggregated at the grid-mesh scale accord-ing to the cover fraction of each tile.
For operational application running with long time steps, the TEB scheme is not activated and the town is replaced by rocks. The ISBA scheme is therefore used for all grid points of the domain because of numerical instabilities in the cou-pling with explicitly computed TEB variables at the time of testing. This is the way how SURFEX is used in the French double suite of ALADIN (Masson et al., 2013).
2.3 Surface boundary layer computation
The 2 m temperature, 2 m relative humidity and 10 m wind are diagnostically calculated in the
interpolation between the lowest level and the surface, making use of the stability functions of the dry static energy and applying the Monin–Obukhov similarity theory for the surface boundary layer (Geleyn, 1988). However, Best and Hopwood (2001) found that the choice of stability functions at night can have a significant impact on both the surface temperature and the sensible heat flux and therefore on the diagnostic of screen temperature in stable situations.
In order to improve the description of the physical cou-pling between the air and the surface, a one-dimensional surface boundary layer has been implemented in SURFEX (CANOPY scheme) following the methodology described in Hamdi and Masson (2008) and Masson and Seity (2009). With this version, six prognostic air layers (0.5, 2, 4, 6.5, 10, and 17 m above the ground) are added from the ground up to the lowest atmospheric level. The surface boundary layer is thus resolved prognostically (there is no need for analytical extrapolation such as in Geleyn (1988)), taking into account large-scale forcing, turbulence and, if any, drag and canopy forces.
2.4 Surface data assimilation
The initialization of the soil variables is very important in or-der to provide accurate short- and medium-range forecasts. Surface assimilation techniques mainly use screen-level ob-servations of relative humidity and temperature to infer re-alistic estimates about the soil variables (i.e. soil moisture and soil temperature) by optimally combining the screen-level observations with a short-range forecast. Two common soil analysis techniques are Optimum Interpolation (OI) and the extended Kalman filter (EKF) or a simplified version of the extended Kalman filter (SEKF) in which the background error covariance matrix is kept constant.
A local OI algorithm is available in SURFEX. Its coeffi-cients have an analytical formulation that mostly depends on the diurnal cycle and the vegetation fraction. The coefficients have been derived from Monte Carlo single-column experi-ments performed by Mahfouf (1991) with an analytical for-mulation proposed by Giard and Bazile (2000). A drawback of the OI is that it is difficult to incorporate new observation types that may improve the analysis. An alternative method is the EKF, for which it is easier to add new observation types. An EKF has been developed for SURFEX that is capa-ble of assimilating screen-level observations (Mahfouf et al., 2009), and has been extended to include AMSR-E surface soil moisture retrievals (Draper et al., 2009), radar precipita-tion informaprecipita-tion (Mahfouf and Bližˇnák, 2011) and ASCAT surface soil moisture (Mahfouf, 2010). In contrast to OI, the EKF uses dynamical coefficients that depend on the Jacobian of the model observation operator which projects the model state into the observation space. The Jacobian elements are calculated using a finite differences approach by comparing a perturbed run to a reference run for each of the soil prog-nostic variables. In order to make the EKF computationally
efficient, these runs are calculated using SURFEX in offline mode, i.e. with the surface scheme decoupled from the atmo-spheric model.
3 Operational validation
The use of SURFEX as a new land surface scheme for the ALADIN and ALARO models has been extensively tested during the last two years by several partners of the ALADIN consortium. In Masson et al. (2013), SURFEX was tested within the ALADIN model running over France and using the FMR radiation scheme. Those authors found that the in-troduction of SURFEX had a neutral impact for surface pres-sure, precipitations, total cloudiness and 10 m wind direction but improved the scores for the 2 m temperature and humidity and 10 m wind speed. In the present study a more complete set of tests will be presented over the operational Belgian do-main, while giving pertinent illustration for the other partners (Hungary, Morocco, Poland, Slovenia, and Turkey).
At the Royal Meteorological Institute (RMI) of Belgium, the operational version of the code is the ALARO config-uration, running with the ACRANEB radiation scheme and ISBA, with a resolution of 7 km and 4 km (see Fig. 1). Tests were carried out to replace the ISBA scheme with SURFEX for the 7 km domain and, additionally, making a comparison by switching on TEB for the 4 km high-resolution domain. The primary goal of this study is to examine the operational viability of ALARO coupled with SURFEX. As a result, the setup of the ALARO model was designed to mimic an oper-ational configuration over the domain presented in Fig. 1. It is a regular grid on a Lambert projection, with its centre at (50.57◦N, 4.55◦E), and the domain is vertically divided in
Fig. 1. Domains corresponding to the 7 km (border of the panel) and
4 km (dashed lines) operational applications.
al. (1995). The ECUME (Exchange Coefficients from Uni-fied Multi-campaign Estimates) parameterization of sea sur-face fluxes is used over seas (Belamari and Pirani, 2007). It is a bulk iterative scheme developed in order to obtain an optimized parameterization covering a wide range of at-mospheric and oceanic conditions, while ALARO used the classical Charnock formula (Charnock, 1955). Physiographic data have also been improved compared to the one used by ALARO (GTOPO30, ECOCLIMAP (Masson et al., 2003), and FAO maps (FAO, 2006) for soil texture).
For two months (January 2010 and July 2010), a series of simulations is performed, with (OPER + SFX) and with-out SURFEX (OPER), with one simulation of 36 h (60 h for the 7 km domain) each day, starting at 00:00 UTC (from the operational ALADIN French forecast model analysis). The comparison with observations is then done at each 3 h of forecast time. The results are presented separately for the two months, representing the two types of season and for stations located in flat topography, high-elevation and coastal environments. The statistical scores computed are the bias and the root-mean-square error (rmse) between model and observations for all simulations (31 in January and 31 in July). The statistical significance of the differences be-tween OPER+SFX and OPER simulations will be quanti-fied by confidence intervals computed with bootstrap tech-niques (Wilks, 1995). Confidence intervals are calculated by re-sampling the 31-fold samples, for January and July, 1000 times and taking the 2.5 % and the 97.5 % percentiles of |bias|/rmse{OPER+SFX}− |bias|/rmse{OPER} as lower and
upper value to get a 95 % confidence interval for the dif-ference. For instance, this means that a null hypothesis – “the difference of two bias/rmse is negative and there is an
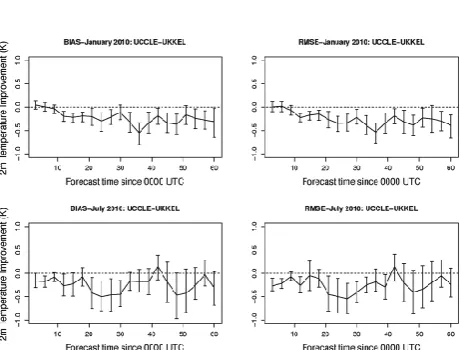
Fig. 2. Statistical scores of 2 m temperature against observations at
the suburban Uccle station (bias: thick line; rmse: thin lines) for Jan-uary (top) and July (bottom) for ALARO without SURFEX (OPER, solid lines) and with SURFEX (OPER + SFX, dashed lines) simu-lations.
improvement when using SURFEX” – is accepted with a 97.5 % confidence level.
The parameters that are compared are 2 m temperature, 2 m relative humidity and 10 m wind. We recognize that single-station measurements cannot capture the spatial vari-ability within the ALARO grid cells. In an ideal situation, a high sampling density of measurements would be used to provide a spatial average to validate the performance of the model.
3.1 2 m temperature
Table 2. The average daytime/night-time scores for the flat/high-elevation and coastal synoptic stations. The+sign means improvement, 0 means neutral effect and the−sign means degradation of the scores.
WinterNIGHT WinterDAY SummerNIGHT SummerDAY
2 m temperature Flat + + + 0
High 0 − 0 +
Coast 0 0 + 0
Wind speed at 10 m Flat + 0 + 0
High 0 0 0 0
Coast + 0 + 0
Wind direction at 10 m Flat 0 0 0 0
High 0 0 0 0
Coast 0 0 0 0
2 m relative humidity Flat + + + 0
of eight stations belonging to the synoptical network of the Royal Meteorological Institute of Belgium), where the +
sign means improvement, 0 means neutral effect, and the−
sign means degradation of the scores with respect to the 95 % confidence levels calculated with the bootstrap method.
During the winter night-time (which is longer in Jan-uary than in July), forecasted 2 m temperatures are generally colder than observations over Belgium for both simulations, with and without SURFEX. The origin of the cold bias is that the model physics yields too little near-surface vertical turbulent mixing during calm night-time conditions (i.e. sta-ble night-time low-level temperature inversions, referred to as the stable boundary layer). This problem is amplified in the cold season because of longer nights, the increased ten-dency during the cold season of night-time winds to become very weak, and the cooling effect of snow cover yielding even stronger night-time temperature inversions (see Hamdi (2009) for more details). Moreover, the night-time situation has a positive feedback character, because as the low-level inversion sets in, the surface vertical turbulent mixing of heat falls off, which in turn acts to strengthen the inversion and so forth. Moreover, Best and Hopwood (2001) found that the choice of stability functions at night can have significant im-pact on both the surface temperature and the sensible heat flux and therefore on the diagnostic of screen temperature in stable situations. In fact, using Monin–Obukhov similar-ity theory with log-linear stabilsimilar-ity functions cuts off the flux of heat with increasing stability too quickly compared to the observations (Best and Hopwood, 2001). This leads to incor-rect lower surface temperatures as the warmer atmospheric air is no longer mixed down to the surface (Masson and Se-ity, 2009). The average mean bias and rmse for the Uccle station (Flat) are significantly reduced when using SURFEX. It can also be seen from Fig. 3 that the improvement of bias and rmse is statistically significant. The average mean bias is significantly reduced when using SURFEX, with an average of+2◦C for OPER versus almost zero for OPER+SFX at the Uccle station.
Fig. 3. The improvement in bias (left) and rmse (right) of
the 2 m temperature obtained when using SURFEX for Jan-uary (top) and July (bottom). The 95 % confidence intervals for |biasOPER+SFX| − |biasOPER| and rmseOPER+SFX−rmseOPER were calculated with the bootstrap method.
It can also be seen from Table 2 that OPER+SFX simu-lation gives better results at the coast. The improvement of bias and rmse during the summer is statistically significant. For the high-elevation synoptic station, the use of SURFEX has a neutral impact on the scores and the null hypothesis is not accepted during winter and summer.
Fig. 4. Statistical scores (rmse: top; bias: bottom) of 2 m
temper-ature against observations at the Ouarzazat station for a winter pe-riod 1–20 January 2010 for ALADIN without SURFEX (black solid line), ALADIN with SURFEX (red dashed line) and ALADIN with SURFEX and CANOPY (green dashed lines).
The use of the CANOPY scheme within the ALADIN model has been tested over the Moroccan operational do-main for a winter period from 1 to 20 January 2010. Fig-ure 4 presents the rmse and bias scores of a 60 h forecast of 2 m temperature against observations at the Ouarzazat station for ALADIN without SURFEX, ALADIN with SURFEX, and ALADIN with SURFEX and CANOPY (2 m tempera-ture is prognostically computed). During daytime the three simulations compare relatively well to the observations with a rmse below 2◦C. However, during the night-time the use of CANOPY significantly improves the results, while the intro-duction of SURFEX gives much a lower bias than the opera-tional run (−3◦C for ALADIN against−4◦C for ALADIN with SURFEX). Masson and Seity (2009) found that the use of CANOPY improves the forecast of near-surface air tem-perature at night for strong stability conditions.
3.2 2 m relative humidity
Figure 5 presents the scores obtained for the Uccle station and Fig. 6 shows the improvement in bias and rmse ob-tained when using SURFEX. Table 2 shows the average daytime/night-time scores. The temperature results correlate with the 2 m relative humidity results that show a large im-provement during winter and summer. It can also be seen from Fig. 6 that during winter, the OPER+SFX significantly improve the scores. However, during the summer, the im-provement is only seen during the night-time.
Over the Slovenia domain, SURFEX has also been tested within the ALARO model using the FMR radiation scheme for two short test periods: 4–11 February 2011 and 12– 17 July 2011. At its introduction, SURFEX was tested with two horizontal resolutions (4.4 and 9.5 km). Tables 3 and 4 present the average daytime/night-time 2 m temperature and relative humidity scores for five locations for the 9.5 km and 4.4 km horizontal resolution, respectively. For this short
Fig. 5. Statistical scores of 2 m relative humidity against
observa-tions at the suburban Uccle station (bias: thick line; rmse: thin lines) for January (top) and July (bottom) for ALARO without SURFEX (OPER, solid lines) and with SURFEX (OPER + SFX, dashed lines) simulations.
period, scores are in general neutral or marginally positive; only in some cases is there a medium deterioration (particu-larly in wintertime for the 9.5 km run with a cold bias at Novo Mesto, Kranjska Gora and Ljubljana stations). SURFEX yields improved relative performance for the high-resolution run. For the 4.4 km run almost all scores are neutral or posi-tive in winter and summer period. Significant deterioration is only observed in Kranjska Gora for the 2 m relative humidity during winter night-time.
In Poland, SURFEX has been tested during the last decade of March 2011 within the ALADIN operational suite and the results show a neutral impact on the 2 m temperature and rel-ative humidity scores.
Table 3. The average daytime/night-time scores of 2 m temperature (2 mT) and relative humidity (2 m RH) of the 9.5 km horizontal resolution run for five locations over the Slovenian domain. The+sign means improvement, 0 means neutral effect and the−sign means degradation of the scores.
WinterNIGHT WinterDAY SummerNIGHT SummerDAY
Ljubljana 2 mT + − 0 0
(basin city) 2 m RH − 0 0 −
Maribor 2 mT + 0 − −
(flat, low hills) 2 m RH − 0 0 0
Piran 2 mT + 0 0 0
(sea, buoy) 2 m RH + 0 0 0
Novo Mesto 2 mT − − − 0
(hilly terrain) 2 m RH − 0 − 0
Kranjska Gora 2 mT + 0 − 0
(deep valley) 2 m RH − 0 0 0
Table 4. The average daytime/night-time scores of 2 m temperature (2 mT) and relative humidity (2 m RH) of the 4.4 km horizontal resolution run for five locations over the Slovenian domain. The+sign means improvement, 0 means neutral effect and the−sign means degradation of the scores.
WinterNIGHT WinterDAY SummerNIGHT SummerDAY
Ljubljana 2 mT + 0 0 0
(basin city) 2 m RH 0 0 0 0
Maribor 2 mT + + + −
(flat, low hills) 2 m RH − 0 0 0
Piran 2 mT 0 0 + 0
(sea, buoy) 2 m RH 0 0 0 0
Novo Mesto 2 mT + 0 + +
(hilly terrain) 2 m RH − + 0 0
Kranjska Gora 2 mT − + 0 0
(deep valley) 2 m RH − + 0 0
Fig. 6. The improvement in bias (left) and rmse (right) of the
2 m relative humidity obtained when using SURFEX for Jan-uary (top) and July (bottom). The 95 % confidence intervals for |biasOPER+SFX| −biasOPER| and rmseOPER+SFX−rmseOPER were calculated with the bootstrap method.
3.3 Surface fluxes: test with data from Cabauw tower
Sensible heat flux 0 0 0 +
Storage heat flux + + + +
and energy balance for the following parameters: (1) down-ward longwave radiation, (2) updown-ward longwave radiation, (3) downward shortwave radiation, (4) upward shortwave radi-ation, (5) sensible heat flux and (6) latent heat flux, and (7) storage heat flux.
3.3.1 Night-time
Just as found for the Uccle station, the average mean bias and rmse for the Cabauw station are significantly reduced during the summer when using SURFEX (see Fig. 9). It can be seen from Fig. 10 that the improvement of bias and rmse is sta-tistically significant. During the summer the average mean bias is significantly reduced, with an average of+1.5◦C for OPER versus almost zero for OPER+SFX. During the win-ter, the OPER+SFX simulation did not give any improve-ment and the null hypothesis is not accepted. As it can be seen from Table 5, there is also a significant improvement of the upward longwave radiation and storage heat flux during the summer night-time. In fact, the average mean bias and rmse of the storage heat flux is significantly reduced when using SURFEX (not shown), with an average overestimation of 10 W m−2for OPER+SFX versus 34 W m−2for OPER. The use of SURFEX has a neutral impact of the partition-ing between sensible and latent heat flux durpartition-ing summer and winter (their values are very small during the night).
3.3.2 Daytime
During daytime, the use of SURFEX has a neutral impact on the 2 m temperature at the Cabauw site. However, as it can be seen from Table 5, there is a significant improvement of the upward shortwave radiation. In fact, the average mean bias and rmse of the upward shortwave radiation flux is sig-nificantly reduced (up to 10 W m−2, not shown) during the summer when using SURFEX. There is also a significant improvement of the surface heat flux, especially during the summer, with a reduction (not shown) up to 20 W m−2in the rmse of sensible and latent heat flux. These improvements in the upward radiative flux and surface heat flux when using
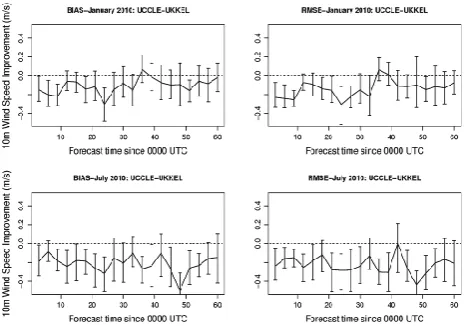
Fig. 7. Statistical scores of 10 m wind speed and direction against
observations at the suburban Uccle station (bias: thick line; rmse: thin lines) for January (top) and July (bottom) for ALARO with-out SURFEX (OPER, solid lines) and with SURFEX (OPER + SFX, dashed lines) simulations.
Fig. 8. The improvement in bias (left) and rmse (right) of
the 10 m wind speed obtained when using SURFEX for Jan-uary (top) and July (bottom). The 95 % confidence intervals for |biasOPER+SFX| − |biasOPER| and rmseOPER+SFX−rmseOPER were calculated with the bootstrap method.
3.4 Urban effect
Recently, in Hamdi et al. (2012), the TEB scheme was imple-mented within ALARO, running operationally at 4 km res-olution. The primary question addressed was the ability of TEB to work properly at this relatively coarse resolution and thus assessing its potential use in an operational configura-tion to improve sensible weather performance over Belgium. Results in Hamdi et al. (2012) show that promising improve-ments are achieved by introducing TEB. The 2 m tempera-ture and 2 m relative humidity improve compared to mea-surements in urban areas. Important urban characteristics, such as increased heat storage and Bowen ratio and the ur-ban heat island effect, were successfully reproduced. In ad-dition, comparison of wind speed and wind direction above the urban canopy indicate that the structure of the flow in urban areas is better reproduced with TEB (Hamdi et al., 2012). These improvements of the treatment of the urban areas within ALARO have implications for simulating air chemistry processes over Belgium at this scale (Delcloo et al., 2012).
The use of TEB within SURFEX has also been tested over Turkey using the ALARO model and the FMR radia-tion scheme at 4 km resoluradia-tion. Figure 11 presents the rmse of 2 m temperature and 2 m relative humidity against obser-vations at the Istanbul city station averaged over July 2010 for ALARO run with SURFEX and ALARO with SURFEX and TEB. The results show a demonstrated positive impact when activating TEB within SURFEX. The forecasted 2 m temperature and 2 m relative humidity improve compared to measurements in Istanbul, especially during the night-time, which is due to the urban heat island effect of Istanbul.
During the night the average mean bias of the 2 m tem-perature is reduced (not shown), with an average cold bias
Fig. 9. Statistical scores of 2 m temperature against observations
at the Cabauw station (bias: thick line; rmse: thin lines) for January (top) and July (bottom) for ALARO without SURFEX (OPER, solid lines) and with SURFEX (OPER + SFX, dashed lines) simulations.
of−1◦C for ALARO with SURFEX versus almost 0◦C for ALARO with SURFEX and TEB. Also during the day the av-erage mean bias of the 2 m relative humidity is significantly reduced (not shown), with an average of+15 % for ALARO with SURFEX versus 8 % for ALARO with SURFEX and TEB.
3.5 Precipitation
Fig. 10. The improvement in bias (left) and rmse (right) of
the 2 m temperature obtained when using SURFEX for Jan-uary (top) and July (bottom). The 95 % confidence intervals for |biasOPER+SFX| − |biasOPER| and rmseOPER+SFX−rmseOPER were calculated with the bootstrap method.
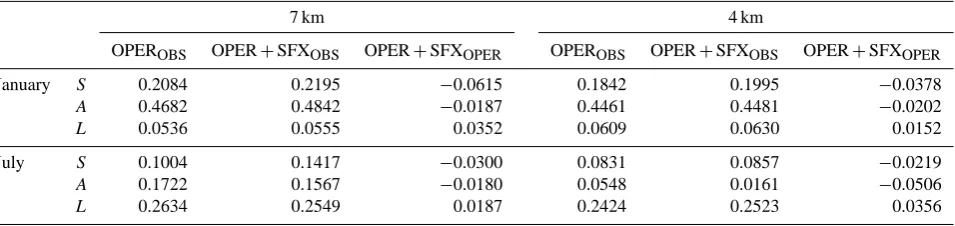
indicates that the model has the correct structure. The am-plitude component also varies between −2 and 2, with a value of −2 indicating an under-predicted total precipita-tion amount, a value of 2 indicating an over-predicted to-tal precipitation amount and 0 denoting a perfect forecast in terms of amplitude. Finally, the location component quanti-fies whether the predicted precipitation objects are situated at the correct location, and ranges from 0 (predicted precip-itation objects at correct position) to 2 (predicted precipita-tion objects at incorrect posiprecipita-tion). Figure 12 shows the struc-ture and amplitude precipitation scores for January 2010 for the ALARO 7 km with (SFX) and without (OPER) SURFEX against radar observations. As a sensitivity test, SAL scores were also computed for the run with SURFEX against the operational runs. Table 6 presents the average (for January and July 2010) SAL scores for the 4 km and 7 km runs with and without SURFEX.
From Fig. 12 and Table 6, it appears that the use of SUR-FEX has a neutral impact on the three components of the SAL method when comparing the ALARO runs against the observations. However, it seems that the use of SURFEX tends to cause rainfall to be locally concentrated (S< 0), and the total accumulated precipitation decreases slightly (A< 0). When comparing the 4 km runs against observations during July 2010, this effect becomes clearer, withA=0.0548 for OPER againstA=0.0161 for OPER+SFX. Thus the use of SURFEX slightly reduces the bias of the total precipitation amount (the cross marker is closer to the centre, not shown). Hamdi et al. (2012) found that the implementation of TEB within SURFEX for the 4 km run during the summer tends to cause rainfall to be locally concentrated, and the total ac-cumulated precipitation obviously decreased, but extended validation would be needed to address this further.
Fig. 11. Rmse of 2 m temperature (top) and 2 m relative humidity
(bottom) against observations at the Istanbul city station averaged over July 2010 for ALARO with SURFEX (solid line) and ALARO with SURFEX and TEB (dashed lines).
3.6 Surface data assimilation
Table 6. The average (for January and July 2010) S (structure) A(amplitude) L (location) scores, for the 4 km and 7 km runs with (OPER+SFX) and without SURFEX (OPER) against radar observations. A third column is added for each run corresponding to the SAL scores for the run with SURFEX with respect to the operational run.
7 km 4 km
OPEROBS OPER+SFXOBS OPER+SFXOPER OPEROBS OPER+SFXOBS OPER+SFXOPER
January S 0.2084 0.2195 −0.0615 0.1842 0.1995 −0.0378
A 0.4682 0.4842 −0.0187 0.4461 0.4481 −0.0202
L 0.0536 0.0555 0.0352 0.0609 0.0630 0.0152
July S 0.1004 0.1417 −0.0300 0.0831 0.0857 −0.0219
A 0.1722 0.1567 −0.0180 0.0548 0.0161 −0.0506
L 0.2634 0.2549 0.0187 0.2424 0.2523 0.0356
Fig. 12. Structure and amplitude precipitation scores of the 7 km
ALARO run for January 2010. Against radar observation (top), the OPER run (left) and the run with SURFEX (right). The run with SURFEX against the operational run (OPER) (bottom), where each point corresponds to 1 day. The cross indicates the weighted mean.
Runs have been performed with surface assimilation (EKF and OI), without assimilation where surface fields are taken from the previous 6 h forecast of the coupled model (free run), and without assimilation where surface fields are in-terpolated from an ARPEGE analysis (open loop). The ex-periments were run over the period of one month, July 2010. Figures 13 shows the increments for WG1(top) and WG2 (bottom) accumulated over the month of July 2010 for the OI run (left) and the EKF run (right). For WG1 the spatial structure of the increments is similar for OI and EKF, but the increments of OI have larger values than those of EKF. This is due to the fact that the EKF has dynamical coefficients that are better able to simulate the weak link between the
screen-level errors and the superficial soil moisture content (Mahfouf et al., 2009). The accumulated increments for WG2 show more differences in spatial structure and sign between OI and EKF. The spatial structure for the OI increments is much smoother and the values of the EKF increments are somewhat higher. The irregular spatial structure of the WG2 increments for the EKF and their differences with the OI in-crements stems from the different handling of negative soil wetness index (SWI) values between OI and the EKF. SWI is defined as (WG2−Wwilt)/(Wfc−Wwilt). If the soil mois-ture content is between the wilting point and the field capac-ity (i.e. SWI between 0 and 1), the assimilated screen-level observations are sensitive to changes in the soil moisture con-tent; that is, the gain coefficients will be different from zero (Balsamo et al., 2004). In regions where the SWI is below 0 or above 1, the screen-level variables are not sensitive to changes in soil moisture content.
In OI this sensitivity to the SWI value is explicitly coded. For soil moisture below the wilting point, only positive or zero increments are allowed, while for soil moisture above the field capacity only negative or zero increments are al-lowed. If the soil moisture is in the SWI sensitivity region, increments are allowed but limited in size so that they do not push the soil moisture content outside of the SWI sensitivity region.
Fig. 13. Soil moisture increment (mm) accumulated over the month
of July 2010. Top left: superficial produced by OI analysis; top right: superficial produced by the EKF analysis; bottom left: deep pro-duced by OI analysis; and bottom right: deep propro-duced by the EKF analysis.
Fig. 14. Deep soil moisture increment accumulated over the month
of July 2010, produced by EKF analysis where SWI is kept between 0 and 1.
Fig. 15. Root-mean-square error and BIAS for relative humidity at
Uccle averaged over the month July 2010 for optimum interpolation (OI), extended Kalman filter (EKF), open loop and free run.
Therefore it will be easier for OI to recover from negative SWI values than for the EKF and OI will allow for more pos-itive WG2increments. This results in regions with a small or negative accumulated WG2increment for the EKF where OI has a larger positive increment. For WG2above but close to the wilting point, the link between the root zone soil moisture and the screen-level variables is the largest, resulting in high gain coefficients and increments in the regions neighbouring the ones with negative SWI values.
The EKF can be changed to include a limitation for the increments to make sure they are not too big and do not push the SWI value outside of the sensitivity range (like in Mahfouf et al., 2009). This is more similar to what is done in OI, although there will still be no positive increments al-lowed in the EKF for negative SWI values. When the EKF is modified in this way, the spatial structure is already less irregular and more like that of OI (see Fig. 14).
In general, there is a good correspondence between the in-crements of OI and EKF, with the EKF inin-crements showing a more fine-grained spatial structure. Also the forecast scores (RMSE and BIAS) forT2 m and RH2 mare similar for EKF and OI (Fig. 15).
3.7 Vertical scores
Fig. 16. Top: vertical profile of the temperature rmse difference
be-tween a run with (S003) and without SURFEX (A003) as a func-tion of forecast range averaged over a winter period (10 Decem-ber 2010–29 DecemDecem-ber 2010) and over the whole domain. Red shaded areas mean that the use of SURFEX improve the scores. Bottom: temperature rmse of the run with (red line) and without (black line) SURFEX at different pressure levels (250, 500, 700 and 850 mb).
starting at 00:00 UTC. Scores are averaged over the whole domain.
Figures 16 (winter) and 17 (summer) present the effect of using SURFEX on the rmse (model against analysis) along the vertical as a function of forecast range averaged over the whole domain. The introduction of SURFEX either shows improvement for or has a neutral impact on the vertical. However, during the winter, SURFEX slightly deteriorates the temperature rmse for the lowest model levels. A recent test (H. M. S. Kullmann, personal communication, 2011) us-ing SURFEX together with the CANOPY scheme gives bet-ter results for the lowest model levels. The introduction of SURFEX is neutral on the vertical profile of the wind speed (see Figs. 18 and 19).
4 Conclusions
This study was motivated by the desire to evaluate the per-formance of SURFEX as a new land surface scheme for the ALADIN and ALARO model. The aim of the present study is not to fully reproduce the model behaviour while replacing the old ISBA scheme with the SURFEX-ISBA scheme, but rather we would like, by exhibiting the new features devel-oped in SURFEX, to reproduce forecast performances equiv-alently or better in terms of the set of verification scores. The results over Belgium show that the introduction of SURFEX
Fig. 17. Top: vertical profile of the temperature rmse difference
be-tween a run with (S003) and without SURFEX (A003) as a function of forecast range averaged over a summer period (18 July 2010– 15 August 2010) and over the whole domain. Red shaded areas mean that the use of SURFEX improve the scores. Bottom: tem-perature rmse of the run with (red line) and without (black line) SURFEX at different pressure levels (250, 500, 700 and 850 mb).
Fig. 18. Top: vertical profile of the wind speed rmse difference
be-tween a run with (S003) and without SURFEX (A003) as a func-tion of forecast range averaged over a winter period (10 Decem-ber 2010–29 DecemDecem-ber 2010) and over the whole domain. Red shaded areas mean that the use of SURFEX improve the scores. Bottom: wind speed rmse of the run with (red line) and without (black line) SURFEX at different pressure levels (250, 500, 700 and 850 mb).
concerning the vertical scores, the introduction of SURFEX either shows improvement for or has a neutral impact on the vertical. However, it was found that during the winter, SUR-FEX causes slight deterioration in the temperature scores for the lowest model levels. Overall, it can be stated that forecast performance can be improved on average when using SUR-FEX in ALARO.
Acknowledgements. We are grateful for the support provided by Fronçois Bouyssel on the ALADIN-SURFEX operational suite of Météo-France.
Edited by: P. Jöckel
References
ALADIN international team: The ALADIN project: Mesoscale modelling seen as a basic tool for weather forecasting and at-mospheric research, WMO Bull., 46, 317–324, 1997.
Balsamo, G., Bouyssel, F., and Noilhan, J.: A simplified bi-dimensional variational analysis of soil moisture from screen-level observations in a mesoscale numerical weather prediction model, Q. J. Roy. Meteorol. Soc., 130, 895–915, 2004.
Belamari, S. and Pirani, A.: Validation of the optimal heat and mo-mentum fluxes using the orca2-lim global ocean-ice model,
Ma-Fig. 19. Top: vertical profile of the wind speed rmse difference
be-tween a run with (S003) and without SURFEX (A003) as a function of forecast range averaged over a summer period (18 July 2010– 15 August 2010) and over the whole domain. Red shaded areas mean that the use of SURFEX improve the scores. Bottom: wind speed rmse of the run with (red line) and without (black line) SUR-FEX at different pressure levels (250, 500, 700 and 850 mb).
rine environment and security for the European area, Integrated Project (MERSEA IP), Deliverable D4.1.3, 88 pp., 2007. Best, M. J. and Hopwood, W. P.: Modelling the local surface
ex-change over a grass-field site under stable conditions, Q. J. Roy. Meteorol. Soc., 127, 2033–2052, 2001.
Best, M. J., Beljaars, A., Polcher, J., and Viterbo, P.: A Proposed Structure for Coupling Tiled Surfaces with the Planetary Bound-ary Layer, J. Hydrometeorol., 5, 1271–1278, 2004.
Bubnová, R., Hello, G., Bénard, P., and Geleyn, J. -F.: Integration of the fully elastic equations cast in the hydrostatic pressure terrain-following coordinate in the framework of ARPEGE/ALADIN NWP system, Mon. Weather Rev., 123, 515–535, 1995. Catry, B., Geleyn, J.-F., Tudor, M., Bénard, P., and Trojáková, A.:
Flux-conservative thermodynamic equations in a mass-weighted framework, Tellus, 59, 71–79, 2007.
Champeaux, J., Masson, V., and Chauvin, R.: Ecoclimap: A global database of land surface parameters at 1 km resolution, Meteorol. Appl., 12, 29–32, 2005.
Charnock, H.: Wind stress over a water surface, Q. J. Roy. Meteorol. Soc., 81, 639–640, 1955.
Davies, H. C.: A lateral boundary formulation for multi-level pre-diction models, Q. J. Roy. Meteorol. Soc., 102, 405–418, 1976. Delcloo, A. W., Deckmyn, A., Hamdi, R., Van Langenhove, H.,
Foret, G., De Backer, H.: Coupling of the CTM CHIMERE to the high resolution LAM ALADIN for Belgium, Air Pollution Modeling and its application XXI, NATO Science Peace S., 4, 315–319, doi:10.1007/978-94-007-1359-8_54, 2012.
Val-idation in stand-alone experiments, Clim. Dynam., 12, 21–35, 1995.
Draper, C., Mahfouf, J.-F., and Walker, J.: An EKF assimilation of AMSR-E soil moisture into the ISBA land surface scheme, J. Geophysical Res., 114, D20104, doi:10.1029/2008JD011650, 2009.
FAO: World reference base for soil resources 2006, A framework for international classification, correlation and communication, World soil resources report No. 103, Food and Agriculture Orga-nization of the United Nations, 2006.
Fouquart, Y. and Bonnel, B.: Computations of solar heating of the earths atmosphere: A new parameterization, Beitr. Phys. Atmos., 53, 35–62, 1980.
Geleyn, J.-F.: Interpolation of wind, temperature and humidity val-ues from the model levels to the height of measurement, Tellus, 40, 347–351, 1988.
Geleyn, J.-F., Bénard, P., and Fournier, R.: A general-purpose ex-tension of the Malkmus band-model average equivalent width to the case of the Voigt line profile, Q. J. Roy. Meteorol. Soc., 131, 2757–2768, 2005.
Geleyn, J.-F., Catry, B., Bouteloup, Y., and Brozková, R.: A statisti-cal approache for sedimentation inside a micro-physistatisti-cal precipi-tation scheme, Tellus, 60, 649–662, 2008.
Gerard, L.: An integrated package for subgrid convection, clouds and precipitation compatible with the meso-gamma scales, Q. J. Roy. Meteorol. Soc., 133, 711–730, 2007.
Gerard, L. and Geleyn, J.-F.: Evolution of a subgrid deep convection parametrization in a limited area model with increasing resolu-tion, Q. J. Roy. Meteorol. Soc., 131, 2293–2312, 2005.
Gerard, L., Piriou, J. M., Brozková, R., Geleyn, J. F., and Banciu, D.: Cloud and Precipitation parameterization in a Meso-Gamma-Scale operational weather prediction model, Mon. Weather Rev., 137, 3960–3977, 2009.
Giard, D. and Bazile, E.: Implementation of a new assimilation scheme for soil and surface variables in a global NWP model, Mon. Weather Rev., 128, 997–1015, 2000.
Goudenhoofdt, E. and Delobbe, L.: Evaluation of radar-gauge merging methods for quantitative precipitation estimates, Hy-drol. Earth Syst. Sci., 13, 195–203, doi:10.5194/hess-13-195-2009, 2009.
Hamdi, R.: The offline version of SURFEX coupled to the opera-tional ALADIN forecast over Belgium: a tool to improve winter screen temperature. Publication scientifique interne, RMI, 2009. Hamdi, R. and Masson, V.: Inclusion of a drag approach in the Town Energy Balance (TEB) scheme: offline 1-D evaluation in a street canyon, J. Appl. Meteorol. Clim., 47, 2627–2644, 2008. Hamdi, R., Deckmyn, A., Termonia, P., Demarée, G. R., Baguis, P.,
Vanhuysse, S., and Wolff, E.: Effects of Historical Urbanization in the Brussels Capital Region on Surface Air Temperature Time Series: A Model Study, J. Appl. Meteorol. Clim., 48, 2181–2196, 2009.
Hamdi, R., Termonia, P., and Baguis, P.: Effects of urbanization and climate change on surface runoff of the Brussels Capital Region: a case study using an urban soil-vegetation-atmosphere-transfer model, Int. J. Climatol., 31, 1959–1975, doi:10.1002/joc.2207, 2011.
Hamdi, R., Degrauwe, D., and Termonia, P.: Coupling the Town Energy Balance (TEB) scheme to an operational limited-area
NWP model: Evaluation for a highly urbanized area in Belgium, Weather Forecast., 27, 323–344, 2012.
Lafore, J. P., Stein, J., Asencio, N., Bougeault, P., Ducrocq, V., Duron, J., Fischer, C., Héreil, P., Mascart, P., Masson, V., Pinty, J. P., Redelsperger, J. L., Richard, E., and Vilà-Guerau de Arellano, J.: The Meso-NH Atmospheric Simulation System. Part I: adi-abatic formulation and control simulations, Ann. Geophys., 16, 90–109, doi:10.1007/s00585-997-0090-6, 1998.
Li, D. and Shine, K. P.: A 4-dimensional ozone climatology for UGAMP models, Tech. Rep. 35, UGAMP, 1995.
Mahfouf, J.-F.: Analysis of soil moisture from near-surface parame-ters: a feasibility study, J. Appl. Meteorol., 30, 1534–1547, 1991. Mahfouf, J.-F.: Assimilation of satellite-derived soil moisture from ASCAT in a limited-area NWP model, Q. J. Roy. Meteorol. Soc., 136, 784–798, 2010.
Mahfouf, J.-F. and Bližˇnák, V.: Combined assimilation of screen-level observations and radar-derived precipitation for soil mois-ture analysis, Q. J. Roy. Meteorol. Soc., 137, 709–722, doi:10.1002/qj.791, 2011.
Mahfouf, J.-F., Manzi, A., Noilhan, J., Giordani, H., and Dequé, M.: The land surface scheme ISBA within the Météo-France climate model ARPEGE, J. Climate, 8, 2039–2057, 1995.
Mahfouf, J.-F., Bergaoui, K., Draper, C., Bouyssel, F., Taillefer, F., and Taseva, L.: A comparison of two off-line soil analysis schemes for assimilation of screen level observations, J. Geo-phys. Res., 114, D08105, doi:10.1029/2008JD011077, 2009. Malkmus, W.: Random Lorentz band model with exponential-tailed
S-1 line intensity distribution function, J. Opt. Soc. Am., 323– 329, 1967.
Masson, V.: A physically-based scheme for the urban energy bud-get in atmospheric models, Bound.-Lay. Meteorol., 94, 357–397, 2000.
Masson, V. and Seity, Y.: Including atmospheric layers in vegetation and urban offline surface schemes, J. Appl. Meteorol. Clim., 48, 1377–1397, 2009.
Masson, V., Champeaux, J. L., Chauvin, F., Meriguet, C., and La-caze, R.: A global database of land surface parameters at 1 km resolution in meteorological and climate models, J. Climate, 16, 1261–1282, 2003.
Masson, V., Le Moigne, P., Martin, E., Faroux, S., Alias, A., Alkama, R., Belamari, S., Barbu, A., Boone, A., Bouyssel, F., Brousseau, P., Brun, E., Calvet, J.-C., Carrer, D., Decharme, B., Delire, C., Donier, S., Essaouini, K., Gibelin, A.-L., Giordani, H., Habets, F., Jidane, M., Kerdraon, G., Kourzeneva, E., Lafaysse, M., Lafont, S., Lebeaupin Brossier, C., Lemonsu, A., Mahfouf, J.-F., Marguinaud, P., Mokhtari, M., Morin, S., Pigeon, G., Sal-gado, R., Seity, Y., Taillefer, F., Tanguy, G., Tulet, P., Vincendon, B., Vionnet, V., and Voldoire, A.: The SURFEXv7.2 land and ocean surface platform for coupled or offline simulation of earth surface variables and fluxes, Geosci. Model Dev., 6, 929–960, doi:10.5194/gmd-6-929-2013, 2013.
Mlawer, E. J., Taubman, S. J., Brown, P., Iacono, M. J., and Clough, S. A.: Radiative transfer for inhomogeneous atmo-spheres: RRTM, a validated correlated-k model for the longwave, J. Geophys. Res., 102, 16663–16682, 1997.
Ritter, B. and Geleyn, J.-F.: A comprehensive radiation scheme for numerical weather prediction models with potential application in climate simulations, Mon. Weather Rev., 120, 303–325, 1992. Sassi, M. Z.: Réalisation et experimentation d’une version ALADIN-TUNISIE avec SURFEX, Rapport de stage, Météo-France, Toulouse, 28 pp., 2012.
Seity, Y., Brousseau, P., Malardel, S., Hellop, G., Bénard, P., Bout-tier, F., Lac, C., and Masson, V.: The AROME-France convec-tive scale operational model, Mon. Weather Rev., 139, 976–991, doi:10.1175/2010MWR3425.1, 2011.
Simmons, A. and Burridge, D. M.: An energy and angular-momentum conserving finite-difference scheme and hybrid ver-tical coordinates, Mon. Weather Rev., 109, 758–766, 1981.
3148, doi:10.1175/MWR-D-12-00033.1, 2012.
Váˇna, F., Bénard, P., Geleyn, J.-F., Simon, A., and Seity, Y.: Semi-Lagrangian advection scheme with controlled damping: An al-ternative to nonlinear horizontal diffusion in a numerical weather prediction model, Q. J. Roy. Meteorol. Soc., 134, 523–537, 2008. Wernli, H., Paulat, M., Hagen, M., and Frei, C.: SAL – A novel quality measure for the verification of quantitative precipitation forecasts, Mon. Weather Rev., 136, 4470–4487, 2008.