www.earth-syst-sci-data.net/8/559/2016/ doi:10.5194/essd-8-559-2016
© Author(s) 2016. CC Attribution 3.0 License.
An internally consistent dataset of
δ
13
C-DIC in the North
Atlantic Ocean – NAC13v1
Meike Becker1,2, Nils Andersen3, Helmut Erlenkeuser3, Matthew P. Humphreys4, Toste Tanhua1, and
Arne Körtzinger1,2
1GEOMAR, Helmholtz Center for Ocean Research, Kiel, Germany
2University of Kiel, Kiel, Germany
3Leibniz Laboratory for Radiometric Dating and Isotope Research, University of Kiel,
Kiel, Germany
4Ocean and Earth Science, University of Southampton, Southampton, UK
Correspondence to:Meike Becker (mbecker@geomar.de)
Received: 12 February 2016 – Published in Earth Syst. Sci. Data Discuss.: 3 March 2016 Revised: 12 August 2016 – Accepted: 15 August 2016 – Published: 26 October 2016
Abstract. The stable carbon isotope composition of dissolved inorganic carbon (δ13C-DIC) can be used to
quantify fluxes within the carbon system. For example, knowing theδ13C signature of the inorganic carbon pool
can help in describing the amount of anthropogenic carbon in the water column. The measurements can also be used for evaluating modeled carbon fluxes, for making basin-wide estimates of anthropogenic carbon, and for studying seasonal and interannual variability or decadal trends in interior ocean biogeochemistry. For all these purposes, it is not only important to have a sufficient amount of data, but these data must also be internally consistent and of high quality.
In this study, we present aδ13C-DIC dataset for the North Atlantic which has undergone secondary quality
control. The data originate from oceanographic research cruises between 1981 and 2014. During a primary quality control step based on simple range tests, obviously bad data were flagged. In a second quality control step, biases between measurements from different cruises were quantified through a crossover analysis using nearby data of the respective cruises, and values of biased cruises were adjusted in the data product. The crossover analysis was possible for 24 of the 32 cruises in our dataset, and adjustments were applied to 11 cruises. The internal accuracy of this dataset is 0.017 ‰.
The dataset is available via the Carbon Dioxide Information Analysis Center (CDIAC) at http://cdiac.ornl. gov/oceans/ndp_096/NAC13v1.html, doi:10.3334/CDIAC/OTG.NAC13v1.
1 Introduction
Stable carbon isotope ratios are utilized as a tracer in sev-eral applications in marine carbon research. Particularly the stable carbon isotope ratio of dissolved inorganic carbon
(δ13C-DIC) can be used to enhance the understanding of
carbon-related processes ranging widely from the estima-tion of glacial circulaestima-tion changes (Curry and Oppo, 2005) to testing the performance of ecosystem models (Schmittner et al., 2013). By observing the temporal development of the lightening of the inorganic carbon pool due to the uptake
of CO2originating from the burning of13C-depleted fossil
fuel carbon, a phenomenon also known as the oceanic13C
Suess effect, an estimation of the anthropogenic carbon frac-tion of DIC is possible (Gruber et al., 2002; Körtzinger et al., 2003; Olsen et al., 2006; Olsen and Ninnemann, 2010; Quay
et al., 2007; Racapé et al., 2013). Furthermore,δ13C can
A sample’s stable carbon isotope ratio,δ13C-DIC, is ex-pressed as per mill deviation from that of the commonly used standard material Vienna Pee Dee Belemnite (V-PDB) (Coplen, 1995).
δ13C= 13R
13R PDB
−1
·103, (1)
with13Rbeing the ratio of the two stable carbon isotopes13C
and12C in the sample.
For basin-wide estimates of carbon fluxes due to pri-mary production, studies of seasonal variations, or interan-nual trends, it is important to have a dataset of sufficiently high coverage both in space and time. Moreover, the dataset should be free of systematic differences between measure-ments carried out by different laboratories and on different cruises. However, neither criteria is easily met. Since isotope ratio mass spectroscopy (IRMS), the common method to
an-alyzeδ13C-DIC data, is a very time-consuming and
expen-sive technique that cannot be performed at sea, data coverage has remained relatively poor. Therefore, several efforts have been made to assemble a dataset containing as many cruises as possible.
For oceanicδ13C-DIC data this was first done by
Kroop-nick (1985), who provided an analysis of the distribution of
δ13C-DIC in the world’s oceans. Over the years more data
were accumulated and different data collections emerged (Gruber et al., 1999; Quay et al., 2003, 2007; Schmittner et al., 2013). During recent years, databases like GLODAP (Global Ocean Data Analysis Project) and CARINA (Car-bon dioxide in the Atlantic Ocean) were created for car(Car-bon- carbon-related parameters (Olsen et al., 2016). These projects not only assembled the data but also conducted a secondary qual-ity control (QC) so that systematic biases between individual cruises could be identified and adjusted for (Tanhua et al., 2009; Velo et al., 2009; Tanhua et al., 2010a; Pierrot et al., 2010). Relative to other parameters such as total alkalinity
or DIC, however, the dataset forδ13C-DIC is still small and
disorganized. Therefore, no secondary quality control – in which deep-water samples from different cruises at nearby locations, so-called “crossovers”, are compared to each other – could be carried out within these collections. Several new cruises have become available for the North Atlantic so that now the present crossover study could be performed for this area. This crossover analysis features 29 cruises, of which 22 could be compared quantitatively. Cruises without a quanti-tatively evaluable crossover were qualiquanti-tatively related to the corrected dataset.
Please note that, when applying the crossover and inver-sion routine, we assume that the deep water masses (be-low 1500 m) are only to a negligible amount influenced by changes due to an increasing amount of anthropogenic car-bon. Since the detected differences between some cruises were not consistent with a slowly increasing amount of an-thropogenic carbon, we think that this consistent dataset is
Figure 1. Map of all stations withδ13C-DIC data used in this dataset. Data from deeper than 1500 m were available only for the stations in dark red, so only these stations were used for the crossover analysis.
an important step for improving the study of carbon iso-tope dynamics in the upper 1500 m. In regions for which the deeper water masses have also been shown to contain a high amount of anthropogenic carbon, we considered crossovers with cruises that took place long before or long after the respective cruise with caution. We believe that no tempo-ral trends have been removed or created by the secondary QC procedures employed here. However, care should be
ex-ercised for calculating Cant accumulation in water below
1500 m.
2 Data provenance and structure
This dataset comprises data and metadata from 32 re-search cruises/campaigns from several international rere-search groups, in total 6820 samples. Some of these consist of mul-tiple cruises and one is a time series. For the crossover anal-ysis, some consecutive cruises, whose data were analyzed together were treated as one cruise. While the focus is on the North Atlantic, four cruises were included that also have stations in the Nordic Seas, and one cruise extends into the South Atlantic. Thereby, consistency with future extended quality-controlled datasets for these regions is ensured. Since
only deep (>1500 m) samples of each cruise are compared
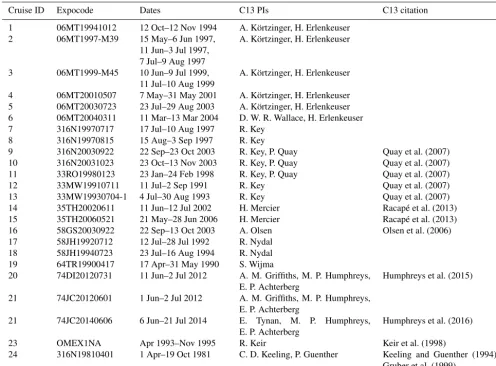
Table 1.Information about dates, PIs, and publications of each cruise.
Cruise ID Expocode Dates C13 PIs C13 citation
1 06MT19941012 12 Oct–12 Nov 1994 A. Körtzinger, H. Erlenkeuser 2 06MT1997-M39 15 May–6 Jun 1997,
11 Jun–3 Jul 1997, 7 Jul–9 Aug 1997
A. Körtzinger, H. Erlenkeuser
3 06MT1999-M45 10 Jun–9 Jul 1999, 11 Jul–10 Aug 1999
A. Körtzinger, H. Erlenkeuser
4 06MT20010507 7 May–31 May 2001 A. Körtzinger, H. Erlenkeuser 5 06MT20030723 23 Jul–29 Aug 2003 A. Körtzinger, H. Erlenkeuser 6 06MT20040311 11 Mar–13 Mar 2004 D. W. R. Wallace, H. Erlenkeuser 7 316N19970717 17 Jul–10 Aug 1997 R. Key
8 316N19970815 15 Aug–3 Sep 1997 R. Key
9 316N20030922 22 Sep–23 Oct 2003 R. Key, P. Quay Quay et al. (2007) 10 316N20031023 23 Oct–13 Nov 2003 R. Key, P. Quay Quay et al. (2007) 11 33RO19980123 23 Jan–24 Feb 1998 R. Key, P. Quay Quay et al. (2007)
12 33MW19910711 11 Jul–2 Sep 1991 R. Key Quay et al. (2007)
13 33MW19930704-1 4 Jul–30 Aug 1993 R. Key Quay et al. (2007) 14 35TH20020611 11 Jun–12 Jul 2002 H. Mercier Racapé et al. (2013) 15 35TH20060521 21 May–28 Jun 2006 H. Mercier Racapé et al. (2013) 16 58GS20030922 22 Sep–13 Oct 2003 A. Olsen Olsen et al. (2006) 17 58JH19920712 12 Jul–28 Jul 1992 R. Nydal
18 58JH19940723 23 Jul–16 Aug 1994 R. Nydal 19 64TR19900417 17 Apr–31 May 1990 S. Wijma
20 74DI20120731 11 Jun–2 Jul 2012 A. M. Griffiths, M. P. Humphreys, E. P. Achterberg
Humphreys et al. (2015)
21 74JC20120601 1 Jun–2 Jul 2012 A. M. Griffiths, M. P. Humphreys, E. P. Achterberg
21 74JC20140606 6 Jun–21 Jul 2014 E. Tynan, M. P. Humphreys, E. P. Achterberg
Humphreys et al. (2016)
23 OMEX1NA Apr 1993–Nov 1995 R. Keir Keir et al. (1998)
24 316N19810401 1 Apr–19 Oct 1981 C. D. Keeling, P. Guenther Keeling and Guenther (1994); Gruber et al. (1999)
Figure 1 shows the locations of all stations with δ13
C-DIC data that are part of this compilation. Table 1 shows a summary of the respective cruise dates, the responsible prin-cipal investigator, and publications in which the data was used. For cruises that have not been published elsewhere, Table 2 shows the sample handling and time periods during
which the samples were analyzed. Some cruises had δ13
C-DIC measurements over the entire depth range at every sta-tion, whereas others just had one or two stations with deep
δ13C-DIC data. Most of the cruises were conducted in the
subpolar North Atlantic, while the tropical region has rela-tively poor coverage. The temporal and latitudinal distribu-tions of the data are displayed in Fig. 2. The data were col-lected in the North Atlantic between 1981 and 2014, with the majority falling between 1990 and 2005. Considering the seasonal distribution of the data, a bias towards summertime exists, especially towards late summer. The only two cruises that took place between January and March were located
south of 42◦N. The uncertainty of theδ13C-DIC samples
an-alyzed by IRMS is usually reported to be between±0.12 ‰
(Gruber et al., 1999) and±0.03 ‰ (Quay et al., 2003).
The presented dataset consists of 19 columns, of which the first 16 are cruise number, station, day, month, year, latitude, longitude, maximal depth, maximal sampling depth, bottle number, cast number, temperature, salinity, depth, CTD (con-ductivity, temperature, and depth) salinity, and pressure.
Col-umn 17 contains the adjustedδ13C-DIC data, column 18 a
quality flag (C13f), and column 19 the QC flag (C13qc; see Table 3). For bad data the quality flag was set to “not mea-sured”, and therefore column 18 has only two entries (2: good; 9: not measured). Cruises that could be quantitatively compared to each other by the secondary QC have a “1” in the QC flag. All others are flagged with “0”.
Table 2.Information about sample handling and measurements for those cruises of which theδ13C data have not been published elsewhere.
Cruise Expocode Laboratory Analysis Sample handling
ID period
1 06MT19941012 ∗ Sep 2002–Dec 2002 200 µL HgCl2sat/100 mL sample 2 06MT1997-M39 ∗ Jan 1998–Feb 2000 200 µL HgCl2sat/100 mL sample
3 06MT1999-M45 ∗ Jul 2000–Jun 2002 50 µL HgCl2sat/100 mL sample
4 06MT20010507 ∗ Dec 2001–Sep 2002 50 µL HgCl2sat/100 mL sample
5 06MT20030723 ∗ Mar 2004–Oct 2004 100 µL HgCl2sat/100 mL sample
6 06MT20040311 ∗ Jan 2005–Oct 2005 200 µL HgCl2sat/100 mL sample
∗Leibniz Laboratory for Radiometric Dating and Isotope Research, Kiel, Germany.
Figure 2.The temporal distribution of the presented dataset ordered by year (left panel) and the sum of all samples at each latitudinal degree (right panel).
numbers in GLODAPv2 and CARINA of the cruises shown in the NAC13v1 dataset can be found in the documentation.
3 Computational analysis
In order to derive an internally consistent set of δ13C-DIC
data in the North Atlantic, all publicly available data in this area were assembled and quality-controlled in two steps. At first, a primary QC was performed in order to identify obvi-ously erroneous data, such as wrong positions, time stamps, and depths. Outliers were also identified and then flagged by
comparing theδ13C profiles of each cruise internally. After
that, the secondary QC procedure was conducted employing a running crossover analysis as described by Tanhua et al. (2010b). This MATLAB-based software package compares two cruises at a time; searches for nearby stations, so-called crossovers; and calculates differences between all crossovers of the two cruises as additive offsets with the unit ‰. As a criterion for identifying crossovers, a maximum of 180 nm
(3◦ of latitude) distance between stations was used. From
these crossovers, the δ13C-DIC data collected deeper than
1500 m were compared on equal potential density. Based on the resulting offsets and standard deviations determined for each of these crossovers, a suggestion for a possible ad-justment was made. This suggestion was obtained by an in-version routine using a weighted least-squares (WLSQ) and
a weighted damped least-squares (WDLSQ) model as de-scribed by Johnson et al. (2001). Cruise 33MW199930704-1 was analyzed by a reputable laboratory, has relatively low scatter, and covers wide distances. Therefore this cruise was selected as the core cruise and weighted higher than the other cruises. Unfortunately this was the only cruise to meet these two criteria. Several cruises from different years were in good agreement with the core cruise, while the other cruises were adjusted towards it. Choosing the ap-propriate distance criterion for crossover locations is always a compromise between including as many statistically rele-vant crossovers as possible by selecting a large enough ra-dius on the one hand and trying to have only crossovers be-tween stations that share similar oceanographic characteris-tics on the other hand. However, reducing the crossover dis-tance to 120 nm – which is the disdis-tance commonly used in CARINA, PACIFICA, and GLODAPv2 data products – re-duced the amount of crossovers and the number of cruises that could be quantitatively compared to each other but did not significantly change the suggested magnitude of
adjust-ments of the remaining cruises. Therefore, the 3◦×3◦
cri-terion was used instead. For some crossovers in highly vari-able regions with deep-water formation, such as the Labrador Sea and the Nordic Seas, the standard deviation of the off-set between two cruises was decreased significantly by
re-stricting the comparison depths to>2000 m. Generally,
off-sets from crossovers in these highly variable regions, from cruises with a relatively poor data precision or with just a few deep samples, were considered in the model with less influence, by weighting the offsets with their uncertainty. In Fig. 3 all crossovers between the cruises 06MT20030723 and 33MW19930704-1 are shown as an example, both for the un-corrected as well as for the un-corrected dataset. All crossovers from the adjusted and the unadjusted dataset can be found at http://cdiac.ornl.gov/oceans/ndp_096/NAC13v1.html.
Table 3.NAC13v1 dataset parameter list, column names used in the data product, and the respective units.
Parameter Data product parameter Data product flag Unit
name name
NAC13v1 cruise number cruiseno
Station station
Day day
Month month
Year year
Latitude latitude ◦N
Longitude longitude ◦E
Bottom depth maxdepth m
Pressure of the deepest sample maxsampdepth dbar Bottle number bottle
Cast number cast
Temperature temperature ◦C
Salinity salinity
Depth depth m
CTD salinity ctdsal
Pressure pressure dbar
δ13C-DIC C13 C13f, C13qc ‰
and it was checked whether or not the adjustment improved the overall consistency within the entire dataset. Temporal changes of the deep water masses were only considered in this step of the routine when comparing the suggested cor-rections and the corresponding crossover offsets between
cruises in areas where also the deep-water δ13C-DIC was
expected to change over time. In order to get a quantitative description of the internal consistency of the final dataset, a weighted mean using the respective offsets of all crossovers and their standard deviation was calculated (Tanhua et al., 2010a).
WM=
L i=1
P
D(i)/(σ(i))2
L i=1
P
1/(σ(i))2 (2)
Lrefers to the total number of crossover,Drefers to the
re-spective offset of all crossover, andσis their standard
devia-tion.
Another method for revealing systematic deviations be-tween different cruises is a regional multi-linear regression (MLR) (Wanninkhof et al., 2003; Jutterström et al., 2010). In this work, a MLR based on core cruise data (deeper than 1500 m) was used to verify the suggested corrections, which resulted from the crossover analysis. Moreover, some cruises without a statistically evaluable crossover could now be re-lated to the other cruises. The following equation was used:
δ13C-DICMLR= −16.9+0.80·S−0.080·2
−0.0045·DIC, (3)
with δ13C-DICMLR being the calculated δ13C-DIC, S the
salinity,2the potential temperature in◦C, and DIC the DIC
concentration in µmol kg−1. The DIC concentration was
cho-sen because it is strongly related to changes in the isotope
composition, and DIC data were available for most cruises. Adding more parameters to the MLR, such as apparent oxy-gen utilization (AOU) or nutrient concentrations, did not
im-prove the agreement betweenδ13C-DIC and δ13C-DICMLR
of the core cruise and reduced the amount of cruises that could be compared via the MLR analysis. The limitation of this method is, of course, that the further away in space and time the cruises are from the core cruise, the more likely it is that an observed offset is real. Especially the cruises reaching into the Nordic Seas show significant deviations, which are most likely real differences between the basins. Therefore, the offsets revealed by the MLR analysis were not taken into account for these cruises.
4 Adjustments
dif-Figure 3.Crossovers between cruise 06MT20030723 (blue dots and lines) and the core cruise 33MW19930704-1 (red crosses and lines). The C13 plots show the data and mean profiles of each cruise, and the difference plots show the difference profiles with their standard deviation (black lines) as well as the crossovers offset with their standard deviation (red lines). The left-hand plot shows the original, and the right hand plot the adjusted data. In both cases the distribution of theδ13C-DIC on equal density surfaces (left-hand side) as well as the mean offset between both cruises (right-hand side) is shown. Cruise 06MT20030723 was adjusted by−0.15 ‰.
ferences, which are caused by different water mass properties in these areas.
A detailed overview of the offset of each crossover in the original as well as the adjusted dataset is given in Table 5 in the Supplement. Moreover, the evidence for our decision will be presented for each cruise.
4.1 06MT19941012, cruise no. 1
This cruise on the German R/V Meteor is also known as
M30-2. The inversion suggested a correction of −0.07 ‰.
The mean offset of all crossovers is 0.11 ‰ too high. The MLR analysis revealed a smaller offset of 0.05 ‰, and thus
the cruise was adjusted by−0.07 ‰.
4.2 06MT19970515, 06MT19970611, and
6MT19970707, here referred to as 06MT1997-M39, cruise no. 2
These cruises are also known as M39 cruises with three legs
ofδ13C-DIC sampling (M39-2, M39-3, M39-4). Since each
leg of this cruise had only a few stations with δ13C-DIC
samples, and all these samples were analyzed together, these cruises were summarized for the crossover study. Neither the inversion routine nor the single crossover with the adjusted cruises show evidence for an offset.
4.3 06MT19990610 and 06MT19990711, here referred to as 06MT1999-M45, cruise no. 3
These cruises are also known as M45-2 and M45-3. Since both were analyzed together, they were summarized for this crossover study. The inversion suggested a correction of
−0.15 ‰, and the mean offset of all crossovers was 0.16 ‰
too high. After applying this adjustment and comparing this cruise to the adjusted dataset, the inversion routine still suggested a small correction. Therefore, an adjustment of
−0.20 ‰ was applied.
4.4 06MT20010507, cruise no. 4
This cruise is also known as M50-1. The inversion
rou-tine suggested a correction of−0.24 ‰, whereas the mean
offset was 0.16 ‰ too high. The MLR analysis revealed an offset of 0.30 ‰. Based on the southern crossover with cruise 06MT20040311 and 316N19970717, an adjustment of
−0.30 ‰ was applied.
4.5 06MT20030723, cruise no. 5
This cruise is also known as M59-2 (Friis et al., 2007). The
correction suggested by the inversion routine is −0.15 ‰,
which matches the positive offsets of the crossovers, except for those with 33TH20060521. Based on the crossover with
Table 4.Overview of all cruises in this dataset. The data of some cruises were combined for the analysis. For more information, please see the detailed description in the “Adjustments” section. The mean offsets of the crossovers and the MLR as well as the corrections suggested by the WDLSQ inversion for the original and the adjusted dataset are shown. In the last column the applied adjustments are displayed. NC indicates that these cruises were not considered in the inversion since they had no statistically significant crossover, and the core cruise is marked with C. Cruises with insufficient quality data are denoted “poor” and not included in the further analysis. Cruises marked with a∗ had fewer than 10 deep samples that were part of the MLR analysis.
Cruise Expocode Calculated offset Suggested correction Final adjustments
ID Crossover MLR WDLSQ WDLSQ (adj)
[‰] [‰] [‰] [‰] [‰]
1 06MT19941012 0.11 0.05 (±0.07) −0.07 (±0.10) −0.01 (±0.02) −0.07 2 06MT1997-M39 −0.02 −0.01 (±0.05) 0.01 (±0.14) 0.00 (±0.01) 0 3 06MT1999-M45 0.16 0.15 (±0.07) −0.14 (±0.09) 0.00 (±0.01) −0.20 4 06MT20010507 0.16 0.30 (±0.09) −0.24 (±0.10) 0.00 (±0.01) −0.30 5 06MT20030723 0.14 0.15 (±0.08) −0.15 (±0.09) 0.00 (±0.01) −0.15 6 06MT20040311 −0.14 −0.13 (±0.09) 0.10 (±0.09) 0.01 (±0.01) 0.10 7 316N19970717 0.17 0.03 (±0.05) −0.06 (±0.17) −0.01 (±0.01) −0.05
8 316N19970815 −0.01 (±0.05) NC
9 316N20030922 0.11 (±0.02)* NC
10 316N20031023 NC
11 33RO19980123 −0.03 (±0.04) NC
12 33MW19910711 −0.02 −0.04 (±0.11) 0.00 (±0.01) 0.00 (±0.01) 0 13 33MW19930704 1 −0.05 0.00 (±0.04) 0.00 (±0.01) 0.00 (±0.01) C
14 35TH20020611 −0.24 (±0.07)∗ 0.25
15 35TH20060521 −0.39 −0.02 0.24 (±0.21) −0.03 (±0.05) 0.25
16 58GS20030922 −0.15 (±0.07) NC
17 58JH19920712 −0.11 (±0.10) NC
18 58JH19940723 −0.06 (±0.05)* NC
19 64TR19900417 poor
20 74DI20120731 −0.33 −0.14 (±0.13) 0.13 (±0.28) 0.12 (±0.12) 0
21 74JC20120601 −0.33 (±0.11) NC
22 74DI20140606 −0.11 −0.09 (±0.09) 0.07 0
23 OMEX1NA −0.14 −0.23 (±0.15) 0.03 (±0.13) 0.02 (±0.02) 0 24 316N19810401 −0.06 −0.04 (±0.08) −0.03 (±0.10) −0.01 (±0.03) 0
4.6 06MT20040311, cruise no. 6
This cruise is also known as M60-5. The inversion routine
indicates that the δ13C-DIC data of this cruise are 0.10 ‰
too low. Additionally, the mean offset as well as the MLR analysis shows that these data are too low. An adjustment of
+0.10 ‰ was applied.
4.7 316N19970717, cruise no. 7, and 316N19970815, cruise no. 8
These cruises followed the WOCE/GO-Ship (World Ocean Circulation Experiment/Global Ocean Ship-based Hydro-graphic Investigations Program) standard lines A20 and
A22. The inversion suggests a correction of −0.06 ‰
for 316N19970717. It shows one crossover with cruise 06MT2004031, in which a significant positive offset is still visible after cruise 06MT20040311 was corrected.
There-fore, an adjustment of −0.05 ‰ was applied for cruise
316N19970717. Cruise 316N19970815 does not show a sta-tistically significant crossover.
4.8 316N20030922, cruise no. 9, and 316N20031023, cruise no. 10
These cruises, which took place in the tropical western At-lantic following the A20 and A22 lines, have only one deep station each. The crossovers of these stations with the adjusted data of both cruise 06MT20040311 and cruise 316N19970717 show a good agreement, suggesting that no adjustment should be applied.
4.9 33RO19980123, cruise no. 11
This cruise has one statistically insignificant crossover
with cruise 06MT20040311 and one with cruise
Figure 4.Adjustedδ13C-DIC profiles and locations of each cruise. The green profiles represent the data of the specific cruise, whereas the gray dots show all profiles in the dataset.
Figure 5.The results of the WDLSQ based inversion routine for the original (blue circles) and the adjusted dataset (red stars). The cruises are plotted at the time the data were collected vs. the sug-gested correction.
4.10 33MW19910711, cruise no. 12, and 33MW19930704-1, cruise no. 13
Cruise 33MW19930704-1 was considered as the core cruise in the present analysis. Cruise 33MW19910711 extends into the South Atlantic, and its crossover with cruise 13 shows no need for an adjustment.
4.11 35TH20020611, cruise no. 14, and 35TH20060521, cruise no. 15
The latter of these two cruises has a few quantitative
crossovers, which show a high offset of−0.39 ‰.
Further-more, the inversion suggests a correction of 0.24 ‰. The high variability of the sampling area south of Iceland, as well as an increasing lightening of the deep-water carbon pool over time, does not constitute an adequate explanation for this
large deviation; therefore, an adjustment of−0.25 ‰ was
ap-plied. Cruise 35TH20020611 shows only qualitatively ana-lyzable crossovers, which show a lighter carbon pool com-pared to earlier cruises and a heavier one comcom-pared to the original data of cruise 35TH20060521 (Racapé et al., 2013). After adjusting cruise 35TH20060521, both cruises, which were analyzed in the same laboratory, are not in good agree-ment anymore, which suggests that the earlier cruise also has too-low isotope values. The MLR analysis reveals an
off-set of the 35TH20020611 cruise of −0.23 ‰, which is in
the same order as the correction suggested by the crossover routine for cruise 35TH20060521. Since the MLR offset for cruise 35TH20020611 is based only on five samples, we
ap-plied an adjustment of−0.25 ‰ to secure the internal
con-sistency of these two cruises.
4.12 58GS20030922, cruise no. 16
T ab le 5. This table sho ws an o v ervie w of all crosso v ers. The symbol • in each ro w di vides the table into a triangle in the upper right and one in the lo wer left of the table. In the upper right corner for each crosso v er the of fsets of the original dataset are listed. In the lo wer left corner the remaining of fsets in the adjusted dataset are sho wn. Not statistically rele v ant crosso v ers are displayed with > , < , and = , indicating the tendenc y of not significant crosso v er . Ple ase note that the of fsets sho wn in the table result from δ 13 Ccolumn − δ 13 Cro w . All of fsets are gi v en in ‰. 06MT19941012 06MT1997-M39 06MT1999-M45 06MT20010507 06MT20030723 06MT20040311 316N19970717 316N19970815 316N20030922 316N20031023 33RO19980123 33MW19910711 33MW19930704-1 35TH20020611 35TH20060521 58GS20030922 58JH19920712 58JH19940423 74DI20120731 74JC20120601 74JC20140606 OMEX1NA 316N19810401 1 06MT19941012 • >
0.16 (±
0.07)
0.31 (±
0.06)
0.06 (±
0.06) > = > − 0.10 ( ± 0.03) < 2 06MT1997-M39 = •
0.21 (±
0.07)
<
0.15 (±
0.06) = > − 0.32 ( ± 0.06) = = > = = 3 06MT1999-M45 − 0.03 ( ± 0.07) − 0.01 ( ± 0.07) •
0.11 (±
0.07)
0.00 (±
0.06) > − 0.20 ( ± 0.07) > − 0.38 ( ± 0.13) > − 0.31 ( ± 0.15) − 0.23 ( ± 0.05) > − 0.09 ( ± 0.06) 4 06MT20010507 − 0.09 ( ± 0.06) =
0.01 (±
0.07) • − 0.08 ( ± 0.06) > > > > 5 06MT20030723
0.02 (±
0.06)
0.00 (±
0.06) − 0.04 ( ± 0.06) − 0.07 ( ± 0.06) • − 0.15 ( ± 0.05) > − 0.48 ( ± 0.09) > > > − 0.30 ( ± 0.08) − 0.17 ( ± 0.02) − 0.20 ( ± 0.04) 6 06MT20040311 = = = •
0.15 (±
0.02)
<
<
0.11 (±
0.08)
0.13 (±0.08)
7 316N19970717 = < − 0.00 ( ± 0.02) • = = 8 316N19970815 = • 9 316N20030922 > • > 10 316N20031023 • 11 33R O19980123 > • < = 12 33MW19910711 • − 0.02 ( ± 0.05) 13 33MW19930704-1 = = − 0.01 ( ± 0.06)
0.00 (±
0.05) − 0.01 ( ± 0.08) >
0.02 (±
0.05) • = > = 14 35TH20020611 = = = • > < < 15 35TH20060521
0.32 (±
0.06)
0.18 (±
0.13)
0.33 (±
0.09)
<
•
0.20 (±0.07)
< 16 58GS20030922 • > 17 58JH19920712 = = = = • = 18 58JH19940423 = = = • 20 74DI20120731
0.12 (±
0.15) < < • < 21 74JC20120601 < • 22 74JC20140606 <
0.04 (±
0.05)
=
0.15 (±
0.08) < − 0.20 ( ± 0.07) > • < 23 OMEX1N A
0.03 (±
0.03)
=
=
0.02 (±
0.02) • 24 316N19810401 > = − 0.11 ( ± 0.06) >
0.05 (±
DIC caused by an increasing amount of anthropogenic car-bon, which decreases with increasing depth. However, the crossover with the TTO data is not consistent with this. Therefore, no adjustment was applied.
4.13 58JH19920712, cruise no. 17, and 58JH19940723, cruise no. 18
These two cruises took place in a highly variable area. No statistically relevant crossover exists, but the data are in good agreement with the core cruise and the other adjusted cruises in that area.
4.14 64TR19900417, cruise no. 19
This cruise shows extreme scatter compared to all other cruises and, therefore, was not included into the adjusted product. When comparing crossover stations, this cruise
shows a mean offset to other cruises of about−1.2 ‰.
4.15 74DI20120731, cruise no. 20
Both the inversion and the offset mean of the crossover
sug-gest a correction of +0.13 ‰ for the cruise (Humphreys
et al., 2015). This most recent cruise took place near the Scotland–Iceland Ridge, where the deep water masses can-not be assumed to be constant over time. All crossovers
indi-cate a lowerδ13C-DIC of this cruise when comparing it with
the others, which is consistent with an increased amount of anthropogenic carbon. Therefore, no adjustment was applied.
4.16 74JC20120601, cruise no. 21
This cruise has only a few stations withδ13C-DIC data in a
highly variable region. It has only one crossover with cruise 58GS20030922. In the MLR analysis, this cruise is too far away from the core cruise to give a reliable outcome. No ad-justment was applied.
4.17 74JC20140606, cruise no. 22
This cruise covers the North Atlantic between Canada, Greenland, and Scotland. The crossover inversion gives a suggested correction of 0.07 ‰ and the MLR analysis an
off-set of the same magnitude:−0.09 ‰. Since this cruise took
place 20 years after the core cruise, anthropogenic influences cannot be neglected in this case. Therefore, no adjustment was applied.
4.18 OMEX1NA, cruise no. 23
During the OMEX1 project in the North Atlanticδ13C-DIC
samples were taken in January 1994. The MLR analysis
re-vealed an offset of−0.26 ‰. In contrast to that, the crossover
inversion did not suggest a correction. No adjustment was ap-plied.
4.19 316N19810401, cruise no. 24
The cruises 316N19810401, 316N19810416,
316N19810516, 316N19810619, 316N19810721,
316N19810821, and 316N19810923 are combined and usually named Transient Tracers in the Oceans North Atlantic Study (TTO-NAS). The inversion does not suggest any correction for this dataset.
5 Conclusions
The finalized, quality-controlled dataset of δ13C-DIC
pre-sented here consists of 24 cruises (some of which consist of multiple legs that were grouped) that have been quanti-tatively compared to each other and form an internally con-sistent dataset. Nine cruises could not be quantitatively com-pared to the other cruises due to a lack of crossovers and/or
deepδ13C-DIC data. The reason for the deviations between
single cruises could not be revealed. There was no correla-tion between a cruise’s bias or its scatter and storage time,
analyzing period, or volume of HgCl2added.
The internal consistency of the adjusted dataset was calcu-lated to be 0.017 ‰ based on Eq. (2).
6 Data availability
The database is available at CDIAC via http:
//cdiac.ornl.gov/oceans/ndp_096/NAC13v1.html,
doi:10.3334/CDIAC/OTG.NAC13v1 (Becker et al., 2016).
Acknowledgements. We would like to thank all the people, both researchers and captains and crews, who spent time at sea and in the lab collecting and measuring the samples and preparing the data which are presented here, and the PIs for sharing it. The measurements of the majority of previously not publicδ13C data were supported by the Deutsche Forschungsgemeinschaft (DFG) through SFB460, and this work was funded by the Future Ocean Excellence Cluster Project CP1140. M. P. Humphreys is funded by the Natural Environment Research Council (UK) through CaNDyFloSS: Carbon and Nutrient Dynamics and Fluxes over Shelf Systems (NE/K00185X/1). We also thank Aley Kozyr from CDIAC for preparing the NAC13v1 website on CDIAC.
Edited by: D. Carlson
Reviewed by: A. Olsen and A. Schmittner
References
Becker, M., Andersen, N., Erlenkeuser, H., Tanhua, T., Humphreys, M. P., and Körtzinger, A.: An Internally Con-sistent Dataset ofδ13C-DIC Data in the North Atlantic Ocean, doi:10.3334/CDIAC/OTG.NAC13v1, 2016.
Curry, W. B. and Oppo, D. W.: Glacial water mass geometry and the distribution ofδ13C of6CO2in the western Atlantic Ocean,
Pa-leoceanography, 20, PA1017, doi:10.1029/2004PA001021, 2005. Friis, K., Najjar, R. G., Follows, M. J., Dutkiewicz, S., Körtzinger, A., and Johnson, K. M.: Dissolution of calcium carbonate: ob-servations and model results in the subpolar North Atlantic, Bio-geosciences, 4, 205–213, doi:10.5194/bg-4-205-2007, 2007. Gruber, N., Keeling, C. D., and Stocker, T. F.: Carbon-13 constraints
on the seasonal inorganic carbon budget at the BATS site in the northwestern Sargasso Sea, Deep-Sea Res. Pt. I, 45, 673–717, doi:10.1016/S0967-0637(97)00098-8, 1998.
Gruber, N., Keeling, C. D., Bacastow, R. B., Guenther, P. R., Lueker, T. J., Wahlen, M., Meijer, H. A. J., Mook, W. G., and Stocker, T. F.: Spatiotemporal patterns of carbon-13 in the global surface oceans and the oceanic suess effect, Global Biogeochem. Cy., 13, 307–335, doi:10.1029/1999GB900019, 1999.
Gruber, N., Keeling, C. D., and Bates, N. R.: Interannual Variability in the North Atlantic Ocean Carbon Sink, Science, 298, 2374– 2378, doi:10.1126/science.1077077, 2002.
Humphreys, M. P., Achterberg, E. P., Griffiths, A. M., McDonald, A., and Boyce, A. J.: Measurements of the stable carbon isotope composition of dissolved inorganic carbon in the northeastern Atlantic and Nordic Seas during summer 2012, Earth Syst. Sci. Data, 7, 127–135, doi:10.5194/essd-7-127-2015, 2015.
Humphreys, M. P., Greatrix, F. M., Tynan, E., Achterberg, E. P., Griffiths, A. M., Fry, C. H., Garley, R., McDonald, A., and Boyce, A. J.: Stable carbon isotopes of dissolved inorganic car-bon for a zonal transect across the subpolar North Atlantic Ocean in summer 2014, Earth Syst. Sci. Data, 8, 221–233, doi:10.5194/essd-8-221-2016, 2016.
Johnson, G. C., Robbins, P. E., and Hufford, G. E.: Systematic Adjustments of Hydrographic Sections for Internal Consistency, J. Atmos. Ocean. Tech., 18, 1234–1244, doi:10.1175/1520-0426(2001)018<1234:SAOHSF>2.0.CO;2, 2001.
Jutterström, S., Anderson, L. G., Bates, N. R., Bellerby, R., Johan-nessen, T., Jones, E. P., Key, R. M., Lin, X., Olsen, A., and Omar, A. M.: Arctic Ocean data in CARINA, Earth Syst. Sci. Data, 2, 71–78, doi:10.5194/essd-2-71-2010, 2010.
Keeling, C. and Guenther, P.: Shore Based Carbon Anal-ysis: Duplicate Carbon Measurements Made by the Car-bon Dioxide Research Group during the 1983–1988 cruises, doi:10.3334/CDIAC/otg.KEELING_DATA, 1994.
Keir, R., Rehder, G., Suess, E., and Erlenkeuser, H.: The 13C anomaly in the northeastern Atlantic, Global Biogeochem. Cy., 12, 467–477, 1998.
Key, R. M., Tanhua, T., Olsen, A., Hoppema, M., Jutterström, S., Schirnick, C., van Heuven, S., Kozyr, A., Lin, X., Velo, A., Wal-lace, D. W. R., and Mintrop, L.: The CARINA data synthesis project: introduction and overview, Earth Syst. Sci. Data, 2, 105– 121, doi:10.5194/essd-2-105-2010, 2010.
Körtzinger, A., Quay, P. D., and Sonnerup, R. E.: Relationship between anthropogenic CO2 and the 13C Suess effect in the
North Atlantic Ocean, Global Biogeochem. Cy., 17, 5-1–5-20, doi:10.1029/2001GB001427, 1005, 2003.
Kroopnick, P. M.: The distribution of 13C of 6 CO2 in the
world oceans, Deep-Sea Res., 32, 57–84, doi:10.1016/0198-0149(85)90017-2, 1985.
Olsen, A. and Ninnemann, U.: Large δ13C Gradients in the Preindustrial North Atlantic Revealed, Science, 330, 658–659, doi:10.1126/science.1193769, 2010.
Olsen, A., Omar, A. M., Bellerby, R. G., Johannessen, T., Ninne-mann, U., Brown, K. R., Olsson, K. A., Olafsson, J., Nondal, G., Kivimäe, C., Kringstad, S., Neill, C., and Olafsdottir, S.: Mag-nitude and origin of the anthropogenic CO2 increase and13C
Suess effect in the Nordic seas since 1981, Global Biogeochem. Cy., 20, GB3027, doi:10.1029/2005GB002669, 2006.
Olsen, A., Key, R. M., van Heuven, S., Lauvset, S. K., Velo, A., Lin, X., Schirnick, C., Kozyr, A., Tanhua, T., Hoppema, M., Jutterström, S., Steinfeldt, R., Jeansson, E., Ishii, M., Pérez, F. F., and Suzuki, T.: The Global Ocean Data Analysis Project version 2 (GLODAPv2) – an internally consistent data prod-uct for the world ocean, Earth Syst. Sci. Data, 8, 297–323, doi:10.5194/essd-8-297-2016, 2016.
Pierrot, D., Brown, P., Van Heuven, S., Tanhua, T., Schuster, U., Wanninkhof, R., and Key, R. M.: CARINA TCO2 data in the Atlantic Ocean, Earth Syst. Sci. Data, 2, 177–187, doi:10.5194/essd-2-177-2010, 2010.
Quay, P. D., Sonnerup, R., Westby, T., Stutsman, J., and McNi-chol, A.: Changes in the13C/12C of dissolved inorganic carbon in the ocean as a tracer of anthropogenic CO2uptake, Global
Biogeochem. Cy., 17, 1–20, doi:10.1029/2001GB001817, 2003. Quay, P. D., Sonnerup, R., Stutsman, J., Maurer, J., Körtzinger, A., Padin, X. A., and Robinson, C.: Anthropogenic CO2
accu-mulation rates in the North Atlantic Ocean from changes in the
13C/12C of dissolved inorganic carbon, Global Biogeochem. Cy.,
21, 1–15, doi:10.1029/2006GB002761, 2007.
Quay, P. D., Stutsman, J., Feely, R. A., and Juranek, L. W.: Net com-munity production rates across the subtropical and equatorial Pa-cific Ocean estimated from air-seaδ13C disequilibrium, Global Biogeochem. Cy., 23, 1–15, doi:10.1029/2008GB003193, 2009. Racapé, V., Pierre, C., Metzl, N., Monaco, C. L., Reverdin, G., Olsen, A., Morin, P., Vázquez-Rodríguez, M., Ríos, A. F., and Pérez, F. F.: Anthropogenic carbon changes in the Irminger Basin (1981–2006): Couplingδ13C DIC and DIC observations, J. Ma-rine Syst., 126, 24–32, doi:10.1016/j.jmarsys.2012.12.005, 2013. Schmittner, A., Gruber, N., Mix, A., Key, R., Tagliabue, A., and Westberry, T.: Biology and air–sea gas exchange controls on the distribution of carbon isotope ratios (δ13C) in the ocean, Biogeo-sciences, 10, 5793–5816, doi:10.5194/bg-10-5793-2013, 2013. Tanhua, T., Brown, P. J., and Key, R. M.: CARINA: nutrient
data in the Atlantic Ocean, Earth Syst. Sci. Data, 1, 7–24, doi:10.5194/essd-1-7-2009, 2009.
Tanhua, T., Steinfeldt, R., Key, R. M., Brown, P., Gruber, N., Wan-ninkhof, R., Perez, F., Körtzinger, A., Velo, A., Schuster, U., van Heuven, S., Bullister, J. L., Stendardo, I., Hoppema, M., Olsen, A., Kozyr, A., Pierrot, D., Schirnick, C., and Wallace, D. W. R.: Atlantic Ocean CARINA data: overview and salinity adjust-ments, Earth Syst. Sci. Data, 2, 17–34, doi:10.5194/essd-2-17-2010, 2010a.
Tanhua, T., van Heuven, S., Key, R. M., Velo, A., Olsen, A., and Schirnick, C.: Quality control procedures and methods of the CARINA database, Earth Syst. Sci. Data, 2, 35–49, doi:10.5194/essd-2-35-2010, 2010b.