R E S E A R C H
Open Access
A multiplatform approach identifies
miR-152-3p as a common epigenetically
regulated onco-suppressor in prostate
cancer targeting
TMEM97
João Ramalho-Carvalho
1,2,3,11, Céline S. Gonçalves
4,5, Inês Graça
1, David Bidarra
1, Eva Pereira-Silva
1, Sofia Salta
1,
Maria Inês Godinho
6, Antonio Gomez
2,12, Manel Esteller
2,7,8, Bruno M. Costa
4,5, Rui Henrique
1,9,10†and Carmen Jerónimo
1,10*†Abstract
Background:Prostate cancer (PCa) is a major cause of morbidity and mortality in men worldwide. MicroRNAs are globally downregulated in PCa, especially in poorly differentiated tumors. Nonetheless, the underlying mechanisms are still elusive. Herein, using combined analysis of microRNAs expression and genomewide DNA methylation, we aimed to identify epigenetically downregulated microRNAs in PCa.
Results:We found that miR-152-3p was underexpressed in PCa and that lower expression levels were associated with promoter hypermethylation in accordance with TCGA dataset analysis. Functional in vitro assays suggest that miR-152-3p suppresses cell viability and invasion potential, whereas it promotes cell cycle arrest at S and G2/M phases. Additionally, miR-152-3p expression was associated with longer disease-free survival in PCa patients from TCGA. Finally,TMEM97, which is overexpressed in PCa, was identified as a novel miR-152-3p target gene.
Conclusions:Our findings demonstrate the advantages of using a combinatory approach to identify microRNAs downregulated due to aberrant promoter methylation. MiR-152-3p downregulation and promoter methylation was found to be prevalent in primary PCa, which impairs its role in control of cell viability, cell cycle regulation and invasion.
Keywords:miR-152-3p, Prostate cancer, Cell cycle, DNA methylation, CRISPR,TMEM97
Background
MicroRNAs (miRNAs) are a class of small (~ 22-nucleotide) RNAs that mediate post-transcriptional gene silencing by guiding Argonaute (AGO) proteins to target mRNAs [1,2], either by repressing translation or by promoting destabilization [3]. Target guidance and specificity is mainly determined by nucleotides at positions 2–7 of the miRNA (the seed-sequence) [4]. Such mechanisms are critical for
homeostasis maintenance, both under physiological condi-tions and in cell’s response to environment alterations, in-cluding stress signals [5]. Thus, a vast number of biological processes are subject to miRNA-dependent regulation, encompassing cell proliferation, signaling, differentiation, stress response, DNA repair, cell adhesion and motility, inflammation, cell survival, senescence, and apoptosis [1]. Interestingly, miRNA’s expression, processing, and func-tional output are also stringently controlled [6]. Indeed, miRNAs’ expression and activity are tightly spatially and temporally regulated, and its disruption has been extensively linked to human disease, including the development of cancer and metastasis formation [1, 7]. Globally, miRNAs are mostly downregulated in cancer, including that of the prostate [1]. Multiple mechanism are known to induce miRNA deregulation, including epigenetic alterations,
* Correspondence:[email protected]; [email protected]
†Equal contributors
1Cancer Biology & Epigenetics Group–Research Center (CI-IPOP),
Portuguese Oncology Institute of Porto (IPO Porto), F Bdg, 1st floor, Rua Dr António Bernardino de Almeida, 4200-072 Porto, Portugal
10Department of Pathology and Molecular Immunology, Institute of Biomedical
Sciences Abel Salazar–University of Porto (ICBAS-UP), Porto, Portugal Full list of author information is available at the end of the article
aberrant transcription factors binding (e.g., p53, MYC), miRNA biogenesis machinery disruption, RNA editing, post-transcriptional RNA modifications, Argonaute loading, and RNA decay [7,8].
Prostate cancer (PCa) is the most common non-cutaneous cancer worldwide in men, and a leading cause of cancer-related death in developed countries [9]. Multiple factors, comprising age, family history, genetic susceptibility and eth-nicity, contribute to the high incidence of PCa [10]. Owing to its complexity and heterogeneity, and despite extensive stud-ies, the molecular mechanisms that drive prostatic carcino-genesis are still far from complete understanding. Because miRNAs regulate a wide range of signaling pathways that are frequently deregulated in PCa, this class of noncoding RNAs might be of critical relevance for tumor development and progression. Thus, its study may provide novel insights into PCa biology and afford innovative tools for patient manage-ment, aiding in diagnosis and prognosis assessmanage-ment, as well as the identification of new therapeutic targets [11].
Methods Aim
Here, we attempted to discover new epigenetically regulated miRNA loci in PCa using a combinatory approach that com-pared miRNAs expression profiling with DNA methylation patterns. The candidate microRNAs were subsequently vali-dated in two large patient cohorts, which included ours and that of TCGA; in vitro assays were performed to characterize their role in cancer cell biology, and in silico analysis, followed by in vitro validation, allowed for the identification of relevant target mRNAs. Overall, our data extends current knowledge about epigenetic deregulation and biological sig-nificance of miRNAs in prostate carcinogenesis. A flow chart depicting the different steps followed in this study is pro-vided in Additional file1: Figure S1. All methods were per-formed in accordance with the relevant guidelines and regulations both for tissue samples and in vitro assays.
Patient and samples
PCa tissue samples (n= 100) from patients diagnosed and primarily treated with radical prostatectomy at Portuguese Oncology Institute of Porto, Portugal, were prospectively collected. Fourteen normal prostate tissue (MNPT) samples, of peripheral zone of prostates without PCa, from patients submitted to radical cystoprostatectomy due to bladder cancer, served as controls. All specimens, promptly frozen at−80 °C, were cut for nucleic acid ex-traction. For routine histopathological examination, formalin-fixed and paraffin-embedded (FFPE) fragments were also collected. Relevant clinical data was retrieved from clinical charts. This study was approved by the institutional ethics committee [Comissão de Ética para a Saúde- Instituto Português de Oncologia do Porto Francisco Gentil, EPE (CES-IPOPFG-EPE 215/013)].
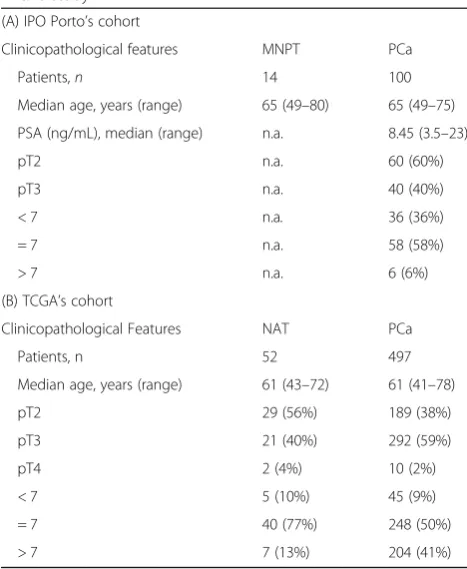
Moreover, in compliance with the Helsinki Declaration and after CES approval, informed consent was obtained for all patients previously to surgery. Additionally, a Co-hort of patients available at TCGA were included for val-idation. The clinical and pathological data of both cohorts of patients (IPO Porto’s cohort and TCGA’s cohort) in-cluded in this study is reported in Table1.
PCa cell lines and demethylation treatment
Prostate cell lines, LNCaP, 22RV1, DU145, PC-3 (malig-nant), and RWPE (benign) were used for in vitro studies. LNCaP and 22Rv1 cells were grown in RPMI 1640, whereas DU145 and PC-3 cells were maintained in MEM and 50% RPMI-50% F-12 medium, while RWPE was cul-tured in Keratinocyte-SFM, containing human recombin-ant Epidermal Growth Factor 1-53 and Bovine Pituitary Extract (GIBCO, Invitrogen, Carlsbad, CA, USA), respect-ively. HEK293Ta were maintained in DMEM. All basal culture media were supplemented with 10% fetal bovine serum and 1% penicillin/streptomycin (GIBCO, Invitro-gen, Carlsbad, CA, USA). Cells were maintained in an in-cubator at 37 °C with 5% CO2. All cell lines were
G-banding karyotyped (for validation) and routinely tested
for Mycoplasma spp. contamination (PCR Mycoplasma
Detection Set, Clontech Laboratories).
Table 1Clinical and pathological data of the patients included in this study
(A) IPO Porto’s cohort
Clinicopathological features MNPT PCa
Patients,n 14 100
Median age, years (range) 65 (49–80) 65 (49–75)
PSA (ng/mL), median (range) n.a. 8.45 (3.5–23)
pT2 n.a. 60 (60%)
pT3 n.a. 40 (40%)
< 7 n.a. 36 (36%)
= 7 n.a. 58 (58%)
> 7 n.a. 6 (6%)
(B) TCGA’s cohort
Clinicopathological Features NAT PCa
Patients, n 52 497
Median age, years (range) 61 (43–72) 61 (41–78)
pT2 29 (56%) 189 (38%)
pT3 21 (40%) 292 (59%)
pT4 2 (4%) 10 (2%)
< 7 5 (10%) 45 (9%)
= 7 40 (77%) 248 (50%)
> 7 7 (13%) 204 (41%)
MNPTmorphologically normal prostate tissue,PCaprostate cancer,NAT normal adjacent tissue,n.a.not applicable
One micromolar of the DNA methyltransferases inhibi-tor 5-aza-2-deoxycytidine (5-Aza-CdR; Sigma-Aldrich, Schnelldorf, Germany) was used for DNA demethylation. Cells were harvested and RNA extracted after 72-h expos-ure to the demethylating agent.
Nuclei acid extraction and bisulfite conversion
DNA was extracted from fresh frozen tissue samples and cell lines using phenol: chloroform (Sigma). RNA was isolated using TRIzol (Invitrogen, Carlsbad, CA, USA) according to the manufacturer’s instructions.
Bisulfite conversion of genomic DNA (1000 ng) was accomplished using EZ DNA Methylation Kit (Zymo Re-search), following the manufacturer’s instructions.
sgRNA cloning
Complementary single-stranded oligos (Additional file 1: Table S1) were phosphorylated and annealed by combining 100 μM oligos, 1× T4 PNK Buffer, 1 mM ATP, 5 U T4 PNK and incubating the reaction at 37 °C/30 min, 95 °C/ 5 min followed by a ramp down to 25 °C at 5 °C/min. Annealed oligos were diluted at 1:100 in sterile water and ligated to plasmid vector lentiCRISPRv2 (gift from Feng Zhang (Addgene plasmid #52961)) using the following pa-rameters: 50 ng BsmBI (Fermentas) digested plasmid, 1μl diluted oligo duplex, 1× Ligation Buffer (Roche), and 5 U T4 DNA Ligase (Roche) incubated at RT/30 min. The ligation reactions were used to transform highly competent
Escherichia colicells according to the manufacturer’s proto-col [12]. Transformation mixtures were plated in LB-agar plates. After colony selection, they grew in liquid LB and plasmid DNA was harvested using PureLink HiPure Plasmid Maxiprep Kit (Invitrogen, Carlsbad, CA, USA). The resulting DNA was then subjected to Sanger sequencing to confirm the correct either the orientation and sequence of each sgRNA.
Lentivirus production, purification, and transduction
To produce lentivirus, 4 × 10⁶HEK293T cells per sgRNA were seeded in ten 100-mm dishes 1 day before transfec-tion. For each dish, we diluted 10 μg of plasmid DNA (corresponding to individual sgRNA), 3.5 μg of pVSV-G, 5μg of pMDL RRE, and 2.5μg of pRSV-REV in 450μl of 0.1× TE/H2O, added 50μl of CaCl2 and incubated 5 min at RT. Plasmid DNA was precipitated by adding 500μl 2× HBS to the solution while vortexing at full speed. The pre-cipitate was added immediately to the plate and the cells were incubated for 14 h at 37 °C, after which the medium was refreshed. Lentivirus-containing supernatants were collected 60 h post-transfection, filtered through a 0.45-μm membrane (Milipore Steriflip HV/PVDF) and stored at−80 °C. Cell lines were infected with lentivirus superna-tants supplemented with 8 μg/ml polybrene (Sigma). At 24 h post-infection, medium was replaced and cells were
selected with 2 μg/ml puromycin (Gibco). Antibiotic se-lection was stopped as soon as no surviving cells remained in the no-transduction control plate.
PCR and sanger sequencing
Genomic DNA (∼1 × 10⁵ cells) from cloned cells was isolated with DNeasy Blood and Tissue kit (Qiagen). PCR reactions were carried out with 500 ng of genomic DNA using Phusion DNA polymerase (Thermo Scientific) according to the manufacturer’s instructions. The PCR products were run in a gel and purified using the Agarose Gel DNA Extraction Kit (Roche). The primer pairs spanning the target site (covering around 500 bp for each cutting site) are listed in the Additional file 1: Table S1. Purified PCR samples (50 ng) were prepared for sequencing using 4μl of BigDye terminator v3.1 (Applied Biosystems) and 5 pM primer in final volume of 20μl. PCR program: 1 min at 96 ° C (1×), followed by 30 s at 96 °C, 15 s at 50 °C, and 4 min at 60 °C (30×), and finishing with 1 min incubation at 4 °C (1×). Samples were analyzed in an Applied Biosystems 3730xl DNA Analyser. The quantitative assessment of CRISPR-Cas9 genome editing was done using a freely avail-able online software—TIDE [13]. Specifically, using Sanger sequencing reactions (sgRNA NT, sgTMEM97#1.1, sgTMEM97#1.2, sgTMEM97#2.1 and sgTMEM97#2.2), in-sertions/deletions (indels) and editing efficacy was assessed by TIDE software [13]. For that, the chromatogram sequence files of respectively the control sample (i.e., transduced with the sgRNA NT) and the test sample (i.e., transduced with the target sgRNA) were analyzed. As output, the quantitative spectrum of indels around the cut site was obtained [13].
MicroRNA expression profiling
MiRNAs expression was assessed in ten PCa and four MNPT using microRNA Ready-to-Use PCR Human Panel (I + II) v2.R (Exiqon, Vedbaek, Denmark), com-prising 752 miRNAs as previously described [14,15]. Ex-tracted RNAs were submitted to cDNA synthesis using miRCURY LNA Universal RT microRNA PCR (Exiqon, Vedbaek, Denmark) following the manufacturer’s in-structions. Data were analyzed using the comparative Ct method, and the median value was calculated for refer-ence genes’expression normalization. MiRNAs with fold change of−1.5 in PCa compared with MNPT were con-sidered downregulated.
MicroRNA’s promoter methylation analysis in prostate tissues
the manufacturer’s instructions. Two hundred nanograms of bisulfite-converted DNA was used for hybridization on the HumanMethylation450 BeadChip (Illumina). Briefly, samples were whole-genome amplified followed by enzym-atic end-point fragmentation, precipitation, and resuspen-sion. The resuspended samples were hybridized onto the BeadChip for 16 h at 48 °C, then washed. A single nucleo-tide extension with labeled dideoxynucleonucleo-tides was per-formed, and repeated rounds of staining were applied with a combination of labeled antibodies differentiating between biotin and DNP.
HumanMethylation450 BeadChip data were processed using Bioconductor minfi package [16]. The “lllumina” procedure that mimics the method of GenomeStudio (Illumina) was performed, including background correc-tion and normalizacorrec-tion considering the first array of the plate as reference. Probes with one or more single nucleo-tide polymorphisms (SNPs) with a minor allele frequency (MAF) > 1% (1000 Genomes) in the first 10 bp of the in-terrogated CpG were removed. The methylation level (β value) for each of the 485,577 CpG sites was calculated as the ratio between the methylated probe intensity and the overall intensity (sum of methylated and unmethylated probe intensities) multiplied by 100. After normalization step, probes mapped within X and Y chromosomes were removed. All analyses were performed in human genome version 19 (hg19), and data was deposited in GEO reposi-tory under accession number GSE52955.
TCGA dataset analysis
Data on miRNA expression and clinical information (when available) from PCa and matched normal tissue samples was retrieved from The Cancer Genome Atlas (TCGA) database. The mRNA expression data from sam-ples hybridized at University of North Carolina, Lineber-ger Comprehensive Cancer Center, using Illumina HiSeq 2000 mRNA Sequencing version 2, were downloaded from data matrix including 494 miSeq, 496 RNA-Seq, and 498 Methylation Array for PCa samples and 52 matched normal adjacent tissue samples (NAT). To pre-vent duplicates, when there was more than one portion per patient, median values were used. The provided value was pre-processed and normalized according to“level 3” specifications of TCGA. Clinical data of each patient was provided by Biospecimen Core Resources (BCRs). Data is available for download through https://gdc-portal.nci.nih.
gov/projects/TCGA-PRAD.
Real-time quantitative PCR (RT-qPCR)
MiR-152-3p transcript levels were assessed using Taq-Man MicroRNA Assay (assay ID: 000475; Applied Bio-systems) and normalized with RNU48 (assay ID: 001006; Applied Biosystems).
Real-time quantitative PCR analysis was performed using gene-specific primers and normalized usingGUSB housekeeping gene (Additional file1: Table S1). Specific-miRNA cDNA was obtained using TaqMan MicroRNA Reverse Transcription Kit from Applied Biosystems (Fos-ter City, CA, USA). Total cDNA synthesis was per-formed using high-capacity cDNA Reverse Transcription Kit (Applied Biosystems, Foster City, CA, USA).
NOL4 and TMEM97mRNA levels were confirmed in
the same group of tissue samples previously indicated. A total of 300 ng was reverse transcribed and amplified using TransPlex® Whole Transcriptome Amplification Kit (Sigma-Aldrich®, Schnelldorf, Germany) with subse-quent purification using QIAquick® PCR Purification Kit (QIAGEN, Hilden, Germany), according to the manufac-turer’s instructions. Expression levels were evaluated using TaqMan® Gene Expression Assays (Applied Biosys-tems, Foster City, CA, USA), and GUSB was used as a reference gene for normalization.
The expression of each gene or small RNA was ob-tained using the formula: Relative expression = (Target gene mean quantity/Reference gene mean quantity). Ra-tios were then multiplied by 1000 for easier tabulation. Each plate included multiple non-template controls, and serial dilutions (× 10) of a cDNA obtained from human prostate RNA (Carlsbad, CA, USA) were used to con-struct a standard curve for each plate. All experiments were run in triplicates (Additional file1: Table S1).
DNA methylation analysis
DNA methylation analysis was performed by quantita-tive methylation PCR (qMSP) using KAPA SYBR FAST qPCR Kit (Kapa Biosystems, MA, USA) and pyrose-quencing. All reactions were run in triplicates in 384-well plates using Roche LightCycler 480 II, withβ-actin (ACTB) as internal reference gene for normalization. Pri-mer sequences (Additional file 1: Table S1) were de-signed using Methyl Primer Express 1.0 and purchased from Sigma-Aldrich (St. louis, MO, USA).
Pre-miR transfections
To overexpress miR-152-3p, synthetic, commercially available, miRNAs’ precursors (pre-miR-152-3p, ID: PM12269; pre-miR-NC, ID: AM17110; Ambion, Carls-bad, CA, USA) were transfected at 30 nM. Transfections were performed using Oligofectamine (Invitrogen, Carls-bad, CA, USA), per manufacturer’s instructions.
Viability assay
Cell viability was evaluated by MTT assay. Briefly, PCa cells were seeded onto 96-well flat-bottomed culture plates, allowed to adhere overnight later (number of cells plated before transfection: LNCaP: 10000 cells/well; PC3: 3000 cells/well), and transfected 24 h later. At each time point, 0. 5 mg/ml of MTT reagent [3-(4, 5dimethylthiazol-2-yl)-2, 5-diphenyl-tetrazolium bromide] was added to each well, and the plates were incubated in the dark for 1 h at 37 °C. For-mazan crystals were then dissolved in DMSO and absorb-ance was read at 540 nm in a microplate reader (FLUOstar Omega, BMG Labtech, Offenburg, Germany), subtracting the background, at 630 nm. The number of cells was calcu-lated using the formula: [(OD experiment x Number of cells at day 0)/Mean OD at day 0]. Three replicates were performed for each condition and at least three independ-ent experimindepend-ents were carried out.
GFP-competitive proliferation assay
LNCaP cells were infected with sgRNAs targeting the exon 1 or exon 2 of TMEM97. Separately, we generated polyclonal LNCaP cells stably expressing GFP using pLX304-GFP30 (gift from David Root; Addgene plasmid # 25890). GFP expressing cells were mixed in a 1:3 ratio with cells containing individual sgRNAs. The percentage of GFP-expressing cells was assessed by flow cytometry at the beginning of the experiment (T = 0) and every 72 h onwards (T= 3d;T= 6d, andT= 9d). For each condition, 10,000 events were recorded. The cells were measured on a BD FACSCalibur cytometer (BD Biosciences, San Jose, CA, USA) and analyzed using FlowJo software.
Apoptosis evaluation
Evaluation of apoptosis was performed using APOPercen-tage apoptosis assay kit (Biocolor Ltd., Belfast, Northern Ireland) according to the manufacturer’s instructions. PCa cells were seeded onto 24-well plates (LNCaP: 50000 cells/well, and PC3: 30000 cells/well) and 24 h later were transfected. Apoptotic cells were assessed at the end of the day 3, in a FLUOstar Omega microplate reader at 550 nm and the background subtracted at 620 nm. The results were normalized to number of viable cell obtained in the MTT assay according to the following formula (OD of apoptosis assay at 72 h/ OD of MTT at 72 h).
Cell cycle analysis
Cell cycle distribution of LNCaP and PC3 cells was deter-mined by flow cytometry. Briefly, 72 h after transfections, 5 × 10⁵ harvested cells were fixed overnight at 4 °C with 70% cold ethanol. After cold PBS washing, cells were re-suspended in staining Propidium Iodide Solution (Cytognos S.L, Salamanca, Spain) and incubated for 30 min at room temperature. All cells were then measured on a Cytomics FC500 flow cytometer (Beckman Coulter, Fullerton, CA, USA) and analyzed using Modfit LT (Verity Software House, Inc., Topshan, Maine, USA).
Cell invasion assay
Cell invasion was determined using BD BioCoat Matrigel Invasion Chamber (BD Biosciences, Franklin Lakes, NJ, USA). Briefly, 5 × 10⁴ cells/mL of LNCaP or PC3 cells were added to the upper chamber. Both cell lines were transfected for 72 h with miRNA molecules, after which, the non-invading cells were removed with cotton swabs from the upper side of the membrane. The membrane bottom containing invading cells was fixed in methanol, washed in PBS, and stained with DAPI (Vector Laborator-ies, Burlingame, CA). All the invading cells were counted under a fluorescent microscope. PC3 cell line invasion capability was quantified upon trans-well matrigel inva-sion assays (n = 3 for each sample) comparing pre-miR-152-3p to pre-miR-NC cells. Error bars in all panels indi-cate standard deviation, unless otherwise specified.
Transcriptomic evaluation of altered genes following miR-152-3p manipulation
Cells (LNCaP: 400000 cells/well, and PC3: 150000 cells/ well) were plated in 6-well, in the day before transfection. Cells were collected 72 h post transfection and RNA was extracted and used as template for cDNA synthesis. RT-qPCR was performed as previously described and data an-alyzed according to the comparative Ct method [17].
Gene expression microarrays
RNA was extracted from tissue samples using TRIzol (Invitrogen by Life Technologies, Carlsbad, CA), as previ-ously described [18], and 1μg of RNA was processed into cDNA and hybridized to Affymetrix GeneChip Human Exon 1.0 ST arrays, following the manufacturer’s recom-mendations [19]. The Affymetrix Expression Console v1.1 software was used to obtain exon-level robust multi-array average (RMA)-normalized expression values for the core probe sets only. The data is freely available in GEO reposi-tory under accession number GSE42954.
Luciferase assay
using Lipofectamine 2000 transfection reagent (Invitrogen, Carlsbad, CA, USA). Thirty nanomolars of synthetic pre-miRNA was used. Luciferase activity was assessed with the Secrete-Pair™Dual Luminescence Assay Kit (GeneCo-poeia, Rockville, MD, USA) according to the manufac-turer’s instructions. The ratio of luminescence intensities (RLU, Relative Light Unit) of the GLuc (Gaussia luciferase) over SEAP (secreted Alkaline Phosphatase) was obtained as follows: GLuc/SEAP, for each triplicate.
Statistical analysis
Non-parametric tests (Kruskal-Wallis and Mann-Whitney
Utest) were used for group comparisons analysis for both expression and methylation levels for the two patient co-horts (IPO’s and TCGA) and for the in vitro assays. Corre-lations between expression levels and methylation were evaluated by Spearman’s correlation test. Data are shown as mean ± s.d., unless otherwise specified. Student’sttest was used for invasion assays. To evaluate the prognostic value of mir152 andTMEM97expression in PCa patients from the TCGA dataset, univariable (Log-rank test) and multivariable (Cox regression) analyses of disease-free sur-vival were performed, where putative confounding effects (Gleason score and patients’ age) were considered. Disease-free survival was calculated from the date of the radical prostatectomy to the date of relapse, or date of last follow-up or death if relapse-free. For the purposes of sur-vival analyses, high gene expression was considered for samples within the 90th percentile (10% of samples with highest gene expression values). All statistical tests were two-sided. All experiments were run in triplicate. Statistical analysis was carried out using Graph Pad Prism version 5 and IBM SPSS statistics version 22. Significance level was set atp< 0.05.
Results
Identification of hypermethylated and downregulated microRNAs in prostate cancer
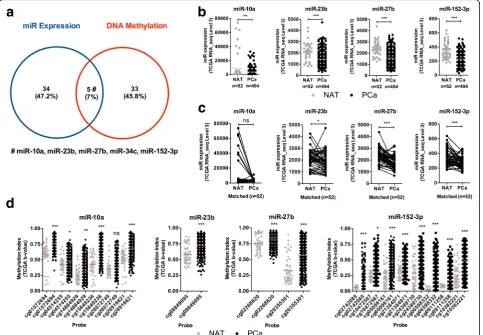
Global miRNA expression was assessed using microRNA Ready-to-Use PCR Human Panel (I + II) v2.0 (Exiqon, Vedbaek, Denmark). To identify differentially expressed miRNAs in PCa, compared to morphologically normal prostate tissue (MNPT), 740 miRNAs were profiled in 10 PCa tissues and 4 MNPT [20]. Using a cutoff value of log fold change <−1.5, 39 miRs were found downregu-lated in PCa compared to MNPT (Additional file 1: Table S2 and Figure S1). From these miRNAs, 10 were selected for validation in a larger and independent data-set (miR-10a, miR-23b, miR-27b, miR-135b, miR-143, miR-152-3p, miR-187, miR-204, miR-205, miR-221), i.e., the miRNAseq expression data from PCa patients and matched normal samples deposited in The Cancer Genome Atlas (TCGA) (n= 326 andn= 52, respectively) (Fig.1a–c and Additional file1: Figure S2).
We also determined global differences in DNA methyla-tion in the prostate tissues [21]. This cohort was com-posed of 5 MNPT and 25 PCa. DNA samples were hybridized on the Infinium DNA methylation BeadChip platform (Illumina), which analyzes more than 450,000 CpG sites in the genome [22]. After normalization, we fil-tered out poor-quality probes and those containing single nucleotide polymorphisms (SNPs; > 1%) [23] and copy number variations (CNV; > 5%) in the detection sequence. Following these filters, DNA methylation profiling dis-closed 38 hypermethylated promoter regions in known miRNA regions, three of which were further validated in TCGA dataset (Additional file1: Table S2 and Figure S3).
Because gene expression and DNA promoter methylation correlate with gene regulatory activity status, we merged the results of the two analytical platforms (expression by Exiqon platform and methylation profiling by Illumina) to identify miRNAs with decreased expression associated with promoter hypermethylation in PCa. From this combined analysis, 5 miRNAs emerged as simultaneously downregu-lated and hypermethydownregu-lated in PCa: 10a, 23b, miR-27b, miR-34c, and miR-152-3p (Fig. 1a; Additional file 1: Table S2, highlighted in blue). In TCGA dataset, the com-mon microRNAs were confirmed to be downregulated in primary PCa compared to noncancerous prostate tissues (Fig. 1b), but miR-34c showed no statistical significance. Moreover, and except for miR-10a, all displayed signifi-cantly lower expression in PCa in comparison with matched non-cancerous prostate tissues (Fig.1c). Because miRNA’s promoter methylation status was available at TCGA database, these data were also retrieved and it con-firmed our finding of increased methylation indexes in these miR’s obtained with the Infinium 450 K DNA methy-lation profiling platform (Fig. 1d). Then, we focused our study on miR-152-3p as it fulfilled the criteria for downreg-ulation associated with promoter hypermethylation in PCa. Remarkably, we had already suggested that miR-152-3p was regulated by DNA methylation in PCa [21, 24], con-firming previous published findings [25,26] which support the observations that miR-152-3p is a common epigeneti-cally regulated miRNA in PCa.
MiR-152-3p expression and promoter methylation analysis in prostate cells
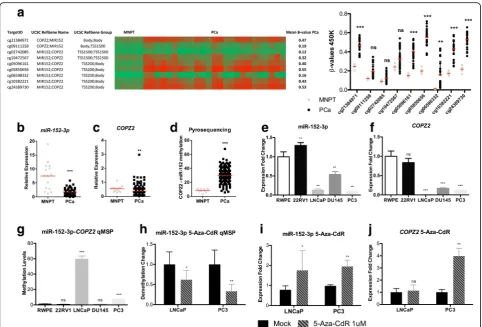
MiR-152-3p is located at chromosome 17q21.32, within an intronic region of COPZ2. Data from the 450 K array re-vealed that 9 probes targeting this locus were differentially methylated (Fig. 2a). The cg05850656 and cg24389730 showed the highestβvalues (0.55 and 0.53). These probes map to TSS200-Body for miR-152-3p-COPZ2 locus. To further validate these findings, miR-152-3p (Fig. 2b) and
downregulation of both in PCa compared to MNPT was confirmed (p< 0.0001 andp= 0.0022, respectively).
In both patients’cohorts, miR-152-3p and COPZ2 ex-pression levels were inversely and significantly correlated with methylation levels in PCa samples (p=−0.444,p< 0. 0001, and p =−0.435, p< 0.0001 for IPO Porto cohort;
p=−0.331,p< 0.0001 andp=−0.561,p< 0.0001, TCGA Cohort, respectively).
Pyrosequencing analysis demonstrated that the pro-moter shared by miR-152-3p andCOPZ2was aberrantly methylated in PCa (Fig.2d;p< 0.0001).
In LNCaP, DU 145, and PC3 cells, miR-152-3p and
COPZ2expression levels were also significantly lower than those found on RWPE cells, which are benign epithelial prostate cells (Figs. 2e, f), whereas promoter methylation levels followed the opposite trend, specifically for the latter two cell lines—LNCaP and PC3 (Fig. 2g). These findings
suggest that miR-152-3p is transcribed in parallel with its host gene,COPZ2. Exposure of PCa cells to demethylating agent 5-Aza-2-deoxycytidine (5-Aza-CdR) caused a 38 and 67% reduction in COPZ2-miR-152-3p promoter methyla-tion levels, in LNCaP (p = 0.0411) and PC3 cells (p = 0. 0043), respectively (Fig. 2h). Nonetheless, the impact in gene expression differed as miR-152-3p re-expression was observed in both cell lines (LNCaP, FC: 1.75; and PC3, FC: 1.94) (Fig.2i), whereasCOPZ2 transcript levels were only significantly restored in PC3 cells (FC: 3.98) (Fig.2j).
MiR-152-3p attenuates malignant phenotype in vitro
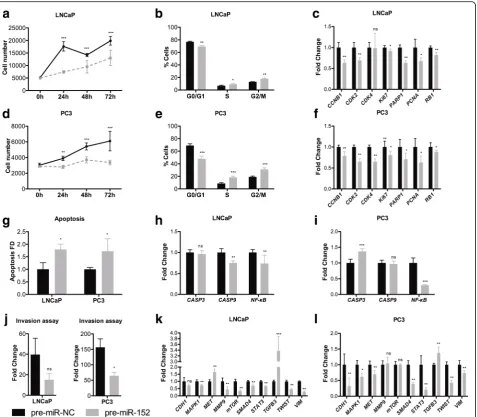
Using in vitro assays, we found that miR-152-3p overexpres-sion significantly decreased cell viability in both LNCaP and PC3 cells (Fig.3a, d) and promoted a significant accumula-tion of cells in S and G2/M phases (Fig.3b, e). Accordingly, at transcriptional level, both cell lines displayed a significant
Fig. 1Identification of miRNAs downregulated by DNA methylation in prostate cancer, using a combinatorial approach.aVenn diagram of the intersection of the miR expression (Exiqon) versus DNA methylation (Infinium HumanMethylation450 BeadChip) for miRNA promoters. Intersection is shown for the downregulated miRNAs and hypermethylated miRNAs. The five common miRNAs based on expression level and DNA methylation in
PCa tissues are miR-10a, miR-23b, miR-27b, miR-34c, and miR-152-3p.bIndependent validation using the TCGA Prostate RNA-seq cohort for miR-10a,
miR-23b, miR-27b, and miR-152-3p in PCa samples compared to NAT samples.cMiRNA expression analysis of 52 matched normal and PCa samples
pairs using TCGA cohort. Except for miR-10a, all miRs were significantly downregulated in PCa.dDNA methylation levels (β-Values) for each probe in
specific miRNA loci, comparing normal and PCa samples using TCGA Prostate 450 K cohort. Overall, DNA methylation gain (hypermethylation) was
decrease of several cell cycle regulators (Fig. 3c, f). Con-versely, miR-152-3p’s mimic transfection associated with in-creased apoptosis in LNCaP (p = 0.0286) and PC3 (p = 0. 0286) cells (Fig.3g; Additional file 1: Figure S4). These re-sults were further supported by the significantly reduced NF-kB expression in both PCa cell lines, as well as significantly increased CASP3 expression levels, although only in PC3 transfected cells (Fig.3h, i). Moreover, miR-152-3p overex-pression significantly reduced PC3 invasion ability in PC3 cells (p= 0.0286; Fig.3j) and associated with specific epithe-lial–mesenchymal transition genes’ downregulation. Indeed, along with TWIST and VIM downregulation, MAPK1,
SMAD4, and STAT3were significantly downregulated after miR-152-3p restored expression in both LNCaP and PC3 cells (Fig.3k, l).
miR-152-3p targetsNOL4andTMEM97
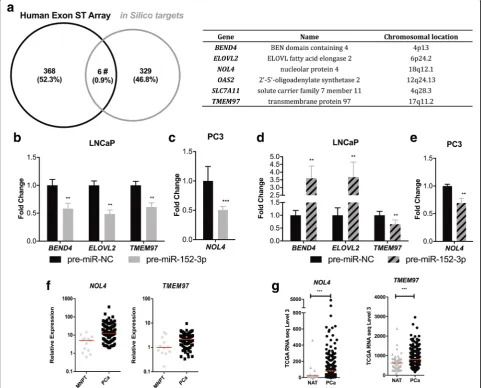
Because the previous results suggested that miR-152-3p was an onco-suppressor, we sought to identify its targets for post-transcriptional regulation, using a combination of multiple in silico target prediction tools (putative tar-gets must contain at least one miRNA response element (MRE)) (Additional file1: Table S3) and a publicly avail-able gene expression dataset. Among the 329 genes
Fig. 2COPZ2-miR-152-3p transcriptional unit’s DNA methylation and expression validation in IPO Porto’s cohort of prostate samples.a
HumanMethylation450 BeadChip data for miR-152-3p locus, showing a significant increase in cg21384971, cg05096161, cg05850656, cg06598332,
cg10382221, and cg24389730.bSignificant miR-152-3p downregulation in PCa (n= 100) compared to morphologically normal prostate tissues
(MNPT,n= 14), as determined by RT-qPCR (p< 0.0001).cSignificantly decreasedCOPZ2transcript levels in PCa samples (p= 0.0022).dCOPZ2
-miR-152-3p promoter hypermethylation in PCa samples determined by pyrosequencing (p = < 0.0001).eMiR-152-3p expression levels in PCa cell
lines compared to benign RWPE cells [expression (E):1] assessed by RT-qPCR. Expression is significantly lower in LNCaP (E ~ 0.13), DU145 (E ~ 0.54)
and PC3 (E ~ 0.09) cells.fSignificantly lowerCOPZ2expression levels by RT-qPCR in LNCaP (E ~ 0.005), DU145 (E ~ 0.17) and PC3 (E ~ 0.12) cells
compared to RWPE (E 1).gProstate cell lines’DNA methylation profiling. LNCaP (FC of methylation levels: ~ 59) and PC3 (FC: ~ 7) cells showed
increased miR152-COPZ2promoter hypermethylation compared to RWPE (FC: 1), 22RV1 and DU145 cells.hA 72-h 5-Aza-CdR exposure, associated
with significant decrease in promoter methylation levels of the transcriptional unitCOPZ2-miR-152-3p in LNCaP (decreased ~ 40%) and PC3
(decreased ~ 68%) cells. LNCaP and PC3 cells miR-152-3p (i) andCOPZ2’s(j) expression levels following 72-h exposure to 5-Aza-CdR associated
with increased miR-152-3p expression levels (FC:1.75; 1.95, respectively) andCOPZ2(FC:1.12; 3.98, respectively). Error bars represent the s.d. for
three biological replicates. Mann-WhitneyUtest: *p< 0.05, **p< 0.01, ***p< 0.001.βvalues range from 0 to 1 and were determined by the ratio
predicted as miR-152-3p targets in silico, only six—
BEND4, ELOVL2, NOL4, OAS2, SLC7A11, and
TMEM97—disclosed a gene expression log fold change > 1.5 in PCa samples (n = 368) analyzed by GeneChip Human Exon ST Array (Fig. 4a). Moreover, forced ex-pression of miR-152-3p caused a significant downregula-tion of BEND4, ELOVL2, and TMEM97 in LNCaP cells (Fig. 4b), whereas in PC3 cells, only NOL4 transcript levels significantly diminished following miR-152-3p’s
overexpression (Fig. 4c). LNCaP cells overexpressing miR-152-3p exposed to 5-Aza-CdR showed significantly reducedTMEM97expression levels (Fig.4d), andNOL4 was downregulated in PC3 cells (Fig.4e).
To further confirm the biological significance of our previous findings, NOL4and TMEM97 expression levels were assessed in two independent cohorts of PCa patients (from our institution and from TCGA). Remarkably, we found that TMEM97 and NOL4 expression levels were
Fig. 3miR-152-3p overexpression associated with attenuated malignant features in LNCaP and PC3 cells.a,dmiR-152-3p overexpression in LNCaP and PC3
cells significantly decreased cell viability compared to pre-miR-NC transfected cells (MTT assay at 24, 48, and 72 h).b,eCell cycle arrest at S and G2/M phases
was depicted for LNCaP and PC3 cells overexpressing miR-152-3p (cytometry analysis was performed 72 h after transfection).c,fReduced transcription levels of
several cell cycle-promoting genes in miR-152-3p overexpressing LNCaP and PC3 cells.gMiR-152-3p overexpression associated with significant increase in
apoptosis compared to cells transfected with negative control miRNA.h, iApoptosis-related genes’expression levels were deregulated in PCa miR-152-3p
overexpressing cells. Significantly reducedNF-kBlevels were found in both miR-152-3p overexpressing cell lines.jMiR-152-3p forced expression in LNCaP and
PC3 cells associated with a significant decrease number of cells invading through the Matrigel coated Boyden chamber assay.k,lTranscriptional deregulation
of EMT and invasion-related genes in miR-152-3p transfected LNCaP and PC3. DifferentialMET, mTOR and MMP9S results suggest cell-specific gene regulation.
significantly upregulated in PCa cases from both cohorts, compared to normal prostate tissues (p= 0.0132 andp= 0.0004, respectively, in IPO Porto’s cohort;p< 0.0001 and
p< 0.0001, respectively, in TCGA cohort; Fig.4f, g).
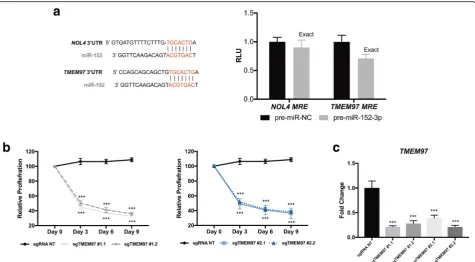
TMEM97knockdown decreases cell proliferation
Since bothNOL4and TMEM973′UTRs contain a MRE for miR-152-3p (Fig.5a, left panel), the functional inter-action between miR-152-3p andNOL4, on the one hand,
and miR-152-3p and TMEM97, on the other hand, was
investigated using luciferase assays. Interestingly, a 30% reduction (p = 0.0022) in luciferase activity for the
TMEM97MRE was found, although only a 10% decrease
was depicted for theNOL4MRE (Fig.5a, right panel). Thus, we tested 4 individual sgRNAs designed to target
TMEM97.We validated the candidate sgRNAs with a com-petitive proliferation assay. LNCaP cells were transduced with the indicated sgRNAs and allowed to proliferate for 9 days. No clonal selection was performed; thus, cells’ population not only comprises a pool of homozygous/het-erozygous mutants, but also unmutated cells (Additional file1: Figure S5).
CRISPR-Cas9-mediated knockout of TMEM97 with four different sgRNAs (sgTMEM97 exon#1 and exon#2) in
Fig. 4Identification of putative targets of miR-152-3p in PCa cell lines.aGenes selected for validation in our experimental settings: combining in
silico prediction targets with genome-wide expression using GeneChip® Human Exon ST Array.bMiR-152-3p overexpression in LNCaP cells
associ-ated with significant decreased levels ofBEND4(~ 40%), ELOVL2(52%) andTMEM97(40%) as determined by RT-qPCR.cPC3 miR-152-3p’s
trans-fected cells displayed significantly decreasedNOL4expression (approximately 50%).d,eEffect of 5-Aza-CdR treatment in the selected target
genes transcript levels in LNCaP revealedTMEM97downregulation (up to 35%), whereas in PC3 cells it associated with significantly decreased
NOL4transcript levels (−30%).NOL4andTMEM97upregulation in PCa tissues.fSignificantly higherNOL4andTMEM97expression in PCa tissue
samples (n= 100) compared with morphologically normal prostate tissue (n= 14), determined by RT-qPCR.gExpression levels in TCGA Prostate
by RNA-seq cohort (NAT:n= 52; PCa:n= 497). MNPT: Morphologically Normal Prostate Tissue; NAT: Normal Adjacent Tissue; PCa: Prostate Cancer.
LNCaP cells resulted in a significant decrease in proliferation (Fig. 5b). Remarkably, all four sgRNAs significantly dimin-ished TMEM97 mRNA levels (Fig. 5c), probably due to nonsense-mediated decay [27]. Cas9-nuclease activity gener-ates DNA double-strand breaks that result in deletions and insertions at the vicinity of the sgRNA recognition site. We examined the range of deletions/insertions caused by each sgRNA targetingTMEM97(Additional file1: Figure S5).All the sgTMEM97 caused on-target indels, with a percentage ranging from 42.3–79.2%.
Overall, the sgRNAs targetingTMEM97mimicked the restoration of miR-152, suggesting that this gene is re-quired for LNCaP cells growth.
miR-152,TMEM97, andNOL4clinical potential in PCa
Lastly, to further evaluate the biological significance of the previous findings in primary PCa, the prognostic value of miR-152, NOL4, and TMEM97 expression levels was assessed in both PCa patients’cohorts. Although, no associ-ations were found in IPO Porto’s cohort, in TCGA’s cohort, higher miR-152-3p expression levels (90th percentile) pre-dicted longer disease-free survival in univariable analysis (Log-rank testp= 0.004; Fig.6a) and in multivariable Cox regression analysis adjusted for patients’age and Gleason score (HR = 0.228,p= 0.012; Table2). However,TMEM97 or NOL4 expression levels did not significantly associate with PCa patients’outcome (Fig.6b, c, Table2).
Discussion
MiRNAs are key players in cellular differentiation and homeostasis, being involved in regulation of transcrip-tional programs through the elimination of aberrant transcripts and suppression of random fluctuations in transcript copy number [28]. Thus, its deregulation impairs cellular homeostasis and is involved in the emer-gence of several pathologies, including PCa.
In this study, we aimed to extend current knowledge on the impact of epigenetic deregulation of miRNAs expres-sion in PCa. For that purpose, we used a combined analysis that allowed the identification of downregulated and aber-rantly methylated microRNAs. Interestingly, only 8% of downregulated miRNAs in PCa tissues were found to be simultaneously aberrantly methylated. Thus, promoter hypermethylation does not seem to be a prevalent mechan-ism underlying microRNA downregulation in this cancer model, and other causes, whether genetic [29], epigenetic [30] or microenvironment-related (e.g., abnormal AR sig-naling [31]), are likely to be more frequent. Notwithstand-ing, we have recently shown that aberrant microRNA promoter methylation might constitute a clinically useful tool for PCa detection and prognostication [24]. Although the number of candidate microRNAs was small, the com-bined approach used in this study seems to be more robust and efficient than each strategy (i.e., micro-RNA expression analysis and differential methylation mapping) alone,
Fig. 5NOL4andTMEM97are miR-152-3p targetsaSchematic representation of the miR-152-3p’s MRE inNOL4andTMEM97. Luciferase activity in HEK293Ta
cells co-transfected with reporter constructs containingNOL4MRE orTMEM97MRE and either pre-miR-152-3p or pre-miR-NC.bValidation of candidate sgRNAs
forTMEM97by a competitive proliferation assay in LNCaP cells.cSgRNA NT indicates a nontargeting. GFP levels were measured by flow cytometry. Values are
considering the significantly higher proportion of validated candidates obtained compared to previous studies from our group [15,21]. Moreover, the results also validate this ap-proach as it confirmed previous reports on miR-23b and miR-27b (members of the cluster miR-23b/27b/24-1) downregulation associated with promoter methylation in PCa [32–34]. Remarkably, two novel microRNAs within this category were found—miR-10a and miR-152-3p— al-though only the latter was validated in two independent datasets.
Interestingly, several miRNAs, including 135b, miR-143, miR-187, miR-204, miR-205 and miR-221 that were commonly downregulated in the Exiqon expression dataset, were also downregulated in TCGA dataset. In contrast, the number of putatively downregulated microRNAs due to ab-errant DNA methylation found in the HumanMethyla-tion450 BeadChip and validated in TCGA dataset was much smaller. Thus, our data indicate that miRNA expres-sion’s profiling is more likely to identify bona fide miRNA deregulated due to promoter methylation compared to DNA methylation profiling, as aberrant DNA methylation might not indicate effective transcriptional silencing. Never-theless, DNA methylation profiling might be particularly suitable for integrative analytic approaches [35].
Because miR-152-3p fulfilled the criteria for methylation-associated downregulation and it had not been previously reported in PCa, we sought to investigate its role in prostate carcinogenesis. Our study indicates that miR-152-3p is a sense-oriented intronic miRNA that forms a transcriptional unit (TU) with the respective host gene, COPZ2, being processed as part of the host gene mRNA [36,37]. Globally, aberrant promoter methylation associated with simultan-eous downregulation of COPZ2-miR152 expression. This further supports that host gene promoter methylation sta-tus is, indeed, associated with miRNAs deregulation, as
previously suggested [26]. Nonetheless, the results of 5-Aza-CdR exposure in LNCaP suggest that this is not the only mechanism regulating COPZ2-miR152 expression, and we are tempted to speculate whether an independent promoter might be located upstream in the host gene, as reported for other genes [38,39].
MiR-152-3p promoter methylation has also been reported in endometrial cancer [40] and in MLL-rearranged infant acute lymphoblastic leukemia [41]. In accordance with previ-ous reports, our results also suggest an onco-suppressor function for miR-152-3p in PCa. Indeed, in non-small cell lung cancer miR-152-3p suppressed cell proliferation, colony formation, migration and invasion [42], in endometrial can-cer miR-152-3p restored expression prevented tumor cell growth both in vitro and in vivo [40], and in ovarian cancer miR-152-3p was suggested to contribute to cisplatin resist-ance in vitro and in vivo through direct DNMT1 targeting [43]. Moreover, in the TCGA PCa cohort,DNMT1 upregula-tion associated with miR-152 promoter hypermethylaupregula-tion (Pearson’s = 0.12,p= 0.0236), although with limited statistical significance [26]. Interestingly, in prostatectomy samples, lower miR-152-3p expression levels were previously signifi-cantly associated with higher risk for biochemical recurrence, although only in univariable analysis [44]. Concordantly, our study shows miR-152-3p has prognostic value, although only in the TCGA cohort. Daniunaite et al. showed, using Kaplan-Meier analysis, that mir-152 promoter hypermethyla-tion had a significant negative impact on BCR-free survival [26]. However, in a recent study aiming at PCa early detec-tion, miR-152-3p expression did not discriminate PCa pa-tients from the matched healthy controls in plasma samples [45]. Moreover,TMEM97 and NOL4 expression levels did not associate with patients’prognosis in both cohorts.
In vitro functional assays demonstrated that miR-152-3p controls cell viability in PCa cells acting as S and G2/
Fig. 6miR-152-3p is valuable prognostic biomarker in PCa.a–cDisease-free survival analyses were performed in PCa patients from the TCGA
dataset.aHigh miR-152-3p expression levels significantly associated with longer disease-free survival (p= 0.004; Log-rank test).bTMEM97andc
M cell-cycle transitions regulator, in both cell lines tested, but more expressively PC3 cells. However, these effects might be cell-context dependent. In line with functional assays’results, miR-152-3p overexpression associated with different specific transcript alterations depending on the tested cell line. Our results indicate that miR-152-3p fine-tunes the expression of several genes involved in the MAPK/ERK, TFG-Beta, JAK–STAT3 and EMT pathways. Thus, our data not only supports that miR-152-3p is a promising molecular target that inhibits PCa cell cycle and invasion [25, 46], but also demonstrates its role in apoptosis regulation. Since these biological processes are critical for cancer progression, a major role for miR-152-3p in PCa progression might be anticipated.
To better understand the role of miR-152-3p, we attempted to identify putative targets. In silico analysis followed by validation in two independent patient cohorts indicated NOL4 (nucleolar protein 4) and TMEM97 (transmembrane protein 97) as miR-152-3p targets. Al-though no information is available for the role ofNOL4in cancer, TMEM97 has been shown to be upregulated in several malignancies, including glioma [47] as well as colorectal [48] and ovarian [49] cancers. Interestingly, in glioma cells, TMEM97 depletion inhibited cancer cell growth and metastasis formation, in parallel with deregu-lation of EMT-related genes. In our model,TMEM97 dis-ruption decreased LNCaP proliferation, further suggesting its involvement in cell growth. Remarkably, increased
TMEM97 expression correlated with shorter survival in glioma [47], ovarian [49], non-small cell lung [50], and colorectal [48] cancer patients. Moreover,TMEM97 cyto-plasmic expression has been positively correlated with
PCNAexpression [48], which acts as a scaffold to recruit proteins involved in DNA replication or DNA repair, be-ing required for post-replication repair [51]. Remarkably, in our study, miR-152-3p overexpression associated with
PCNAdownregulation in both cell lines. Therefore, since
TMEM97 might be functionally associated with PCNA
[52], it might suggest that both are controlled by 3p. Concerning other previously reported miR-152-3p’s targets, we were not able to confirm DNMT1 as a miR-152-3p’s direct target [25,43,53].
Conclusions
In conclusion, this study uncovered novel miRNAs downregulated by aberrant DNA methylation, including a transcriptional unit formed by COPZ2-miR-152-3p. Furthermore, it was demonstrated that miR-152-3p downregulation is a common feature in PCa, favoring the acquisition and development of the malignant traits, as in vitro miR-152-3p’s restored expression attenuated PCa cell phenotype, by impairment of cell viability, cell cycle progression and invasion, through targeting of sev-eral genes involved in critical cancer-related pathways.
Additional file
Additional file 1:Supplementary information. Table S1 Primers and TaqMan assays used in this study; Table S2 microRNAs selected for evaluation in TCGA dataset; Table S3 Putative miR-152 target genes determined by multiple in silico prediction tools; Figure S1 Flow chart depicting the different steps followed to ascertain downregulated miRNAs in PCa; Figure S2 Representative examples of downregulated microRNAs at the TCGA cohort from the initial microRNA profiling by Exiqon; Figure S3 Representative examples of microRNAs downregulated at the TCGA cohort derived from the DNA methylation mapping by
450 K Illumina’s array; Figure S4 Efficiency of miR-152 mimic’s transfection
in PCa cell lines; Figure S5 TIDE analysis of deletions/insertions caused by each sgRNA targeting TMEM97. (PDF 4188 kb)
Table 2Disease-free survival analysis by Cox regression in TCGA patients
DFS Multivariable analysis
HR 95% CI for HR pvalue
mir152
mir152 expression levela 0.228 0.072–0.722 0.012
Age 0.999 0.970–1.028 0.928
Gleason Scoreb
6 < 0.0001
7 5.528 0.754–40.536 0.093
8 11.104 1.455–84.709 0.020
9 23.559 3.247–170.946 0.002
10 24.146 1.502–388.242 0.025
TMEM97
TMEM97expression levela 1.007 0.550–1844 0.980
Age 1.000 0.971–1.029 0.978
Gleason Scoreb
6 < 0.0001
7 5.369 0.732–39.373 0.098
8 10.978 1.438–83.790 0.002
9 23.087 3.179–167.641 0.005
10 30.812 2.786–340.785 0.978
NOL4
NOL4expression levela 0.778 0.392–1.545 0.473
Age 1.000 0.972–1.029 0.979
Gleason Scoreb
6 < 0.0001
7 5.309 0.724–38.935 0.101
8 10.967 1.438–83.629 0.021
9 22.911 3.158–166.213 0.002
10 31.102 2.811–344.117 0.005
pvalue significant whenp< 0.05 HRhazard ratio,CIconfidence interval. a
Reference group: high expression level b
Abbreviations
5-Aza-CdR:5-Aza-2-deoxycytidine; AGO: Argonaute; CNV: Copy Number Variations; FFPE: Formal-Fixed and Paraffin-Embedded; MAF: Minor Allele Frequency; miRNAs: microRNAs; MNPT: Morphologically Normal Prostate
Tissue; NAT: Normal Adjacent Tissue;NOL4: Nucleolar Protein 4; PCa: Prostate
Cancer; qMSP: quantitative Methylation Specific PCR; SNP: Single Nucleotide
Polymorphisms;TMEM97: Transmembrane Protein 7
Acknowledgements
The authors are grateful to the Departments of Urology and Laboratory Medicine of the Portuguese Oncology Institute of Porto for their collaboration.
Funding
This study was funded by research grants from Research Center of Portuguese Oncology Institute of Porto (FB-GEBC-27 and 19-CI-IPOP-2016). JR-C and CSG are supported by FCT- Fundação para a Ciência e Tecnologia PhD fellowships (SFRH/ BD/71293/2010 and SFRH/BD/92786/2013), SS is supported by a PhD fellowship IPO/ESTIMA-1 NORTE-01-0145-FEDER-000027, and IG is a research fellow from the strategic funding of FCT (PCT: PEst- UID/DTP/00776/2013 and COMPETE: POCI-01-0145-FEDER-006868). BMC is funded by FCT-Fundação para a Ciência e a Tecnologia (IF/00601/2012). The funders had no role in study design, data collection and analysis, decision to publish, or preparation of the manuscript.
Availability of data and materials
All data generated or analyzed during this study are included in this published article [and its supplementary information files].
Authors’contributions
JR-C, RH, and CJ conceived and designed the experiments. JR-C, IG, DB, EPS, SS, and MIG performed the experiments. JR-C, CSG, IG, AG, BMC, RH, and CJ analyzed the data. CSG, MIG, ME, BMC, RH, and CJ contributed reagents/ material/analysis. All authors read and approved the final manuscript.
Ethics approval and consent to participate
This study was approved by the institutional ethics committee [Comissão de Ética para a Saúde- Instituto Português de Oncologia do Porto Francisco Gentil, EPE (CES-IPOPFG-EPE 215/013)]. Moreover, in compliance with the Helsinki Declaration and after CES approval, informed consent was obtained for all patients.
Consent for publication Not applicable
Competing interests
The authors declare that they have no competing interests.
Publisher’s Note
Springer Nature remains neutral with regard to jurisdictional claims in published maps and institutional affiliations.
Author details
1Cancer Biology & Epigenetics Group–Research Center (CI-IPOP),
Portuguese Oncology Institute of Porto (IPO Porto), F Bdg, 1st floor, Rua Dr António Bernardino de Almeida, 4200-072 Porto, Portugal.2Cancer
Epigenetics and Biology Program, Bellvitge Biomedical Research Institute, Barcelona, Catalonia, Spain.3Biomedical Sciences Graduate Program, Institute
of Biomedical Sciences Abel Salazar–University of Porto (ICBAS-UP), Porto, Portugal.4Life and Health Sciences Research Institute (ICVS), School of
Medicine, University of Minho, Campus de Gualtar, Braga, Portugal.5ICVS/3B’s
- PT Government Associate Laboratory, Braga/Guimarães, University of Minho, Campus de Gualtar, Braga, Portugal.6Department of Immunology, Portuguese Oncology Institute of Porto, Porto, Portugal.7Institucio Catalana
de Recerca i Estudis Avançats (ICREA), Barcelona, Catalonia, Spain.
8Physiological Sciences Department, School of Medicine and Health Sciences,
University of Barcelona (UB), Barcelona, Catalonia, Spain.9Department of Pathology, Portuguese Oncology Institute of Porto, Porto, Portugal.
10Department of Pathology and Molecular Immunology, Institute of Biomedical
Sciences Abel Salazar–University of Porto (ICBAS-UP), Porto, Portugal.11Present
Address: Division of Oncogenomics, Netherlands Cancer Institute, Plesmanlaan 121, 1066 CX Amsterdam, the Netherlands.12Present Address: Gene Regulation,
Stem Cells and Cancer Programme, Centre for Genomic Regulation (CRG), The Barcelona Institute of Science and Technology, Barcelona, Spain.
Received: 1 February 2018 Accepted: 19 March 2018
References
1. Ramalho-Carvalho J, Fromm B, Henrique R, Jeronimo C. Deciphering the
function of non-coding RNAs in prostate cancer. Cancer Metastasis Rev. 2016;35:235–62.
2. Fromm B, Billipp T, Peck LE, Johansen M, Tarver JE, King BL, Newcomb JM,
Sempere LF, Flatmark K, Hovig E, Peterson KJ. A uniform system for the annotation of vertebrate microRNA genes and the evolution of the human
microRNAome. Annu Rev Genet. 2015;49:213–42.
3. Jonas S, Izaurralde E. Towards a molecular understanding of
microRNA-mediated gene silencing. Nat Rev Genet. 2015;16:421–33.
4. Lewis BP, Shih IH, Jones-Rhoades MW, Bartel DP, Burge CB. Prediction of
mammalian microRNA targets. Cell. 2003;115:787–98.
5. Vidigal JA, Ventura A. The biological functions of miRNAs: lessons from in
vivo studies. Trends Cell Biol. 2015;25:137–47.
6. Ha M, Kim VN. Regulation of microRNA biogenesis. Nat Rev Mol Cell Biol.
2014;15:509–24.
7. Adams BD, Kasinski AL, Slack FJ. Aberrant regulation and function of
microRNAs in cancer. Curr Biol. 2014;24:R762–76.
8. Lujambio A, Lowe SW. The microcosmos of cancer. Nature. 2012;482:347–55.
9. Siegel RL, Miller KD, Jemal A. Cancer statistics, 2016. CA Cancer J Clin. 2016;
66:7–30.
10. Cancer Genome Atlas Research N. The molecular taxonomy of primary
prostate Cancer. Cell. 2015;163:1011–25.
11. Fabris L, Ceder Y, Chinnaiyan AM, Jenster GW, Sorensen KD, Tomlins S,
Visakorpi T, Calin GA. The potential of MicroRNAs as prostate Cancer
biomarkers. Eur Urol. 2016;70:312–22.
12. Korkmaz G, Lopes R, Ugalde AP, Nevedomskaya E, Han R, Myacheva K,
Zwart W, Elkon R, Agami R. Functional genetic screens for enhancer elements in the human genome using CRISPR-Cas9. Nat Biotechnol. 2016; 34:192–8.
13. Brinkman EK, Chen T, Amendola M, van Steensel B. Easy quantitative
assessment of genome editing by sequence trace decomposition. Nucleic Acids Res. 2014;42:e168.
14. Costa-Pinheiro P, Ramalho-Carvalho J, Vieira FQ, Torres-Ferreira J, Oliveira J,
Goncalves CS, Costa BM, Henrique R, Jeronimo C. MicroRNA-375 plays a dual role in prostate carcinogenesis. Clin Epigenetics. 2015;7:42.
15. Pires-Luis AS, Vieira-Coimbra M, Ferreira MJ, Ramalho-Carvalho J,
Costa-Pinheiro P, Antunes L, Dias PC, Lobo F, Oliveira J, Graca I, et al. Prognostic significance of MST1R dysregulation in renal cell tumors. Am J Cancer Res.
2016;6:1799–811.
16. Aryee MJ, Jaffe AE, Corrada-Bravo H, Ladd-Acosta C, Feinberg AP, Hansen
KD, Irizarry RA. Minfi: a flexible and comprehensive Bioconductor package for the analysis of Infinium DNA methylation microarrays. Bioinformatics. 2014;30:1363–9.
17. Schmittgen TD, Livak KJ. Analyzing real-time PCR data by the comparative
C(T) method. Nat Protoc. 2008;3:1101–8.
18. Vieira FQ, Costa-Pinheiro P, Ramalho-Carvalho J, Pereira A, Menezes FD,
Antunes L, Carneiro I, Oliveira J, Henrique R, Jeronimo C. Deregulated expression of selected histone methylases and demethylases in prostate
carcinoma. Endocr Relat Cancer. 2014;21:51–61.
19. Paulo P, Ribeiro FR, Santos J, Mesquita D, Almeida M, Barros-Silva JD,
Itkonen H, Henrique R, Jeronimo C, Sveen A, et al. Molecular subtyping of primary prostate cancer reveals specific and shared target genes of different
ETS rearrangements. Neoplasia. 2012;14:600–11.
20. Ramalho-Carvalho J, Martins JB, Cekaite L, Sveen A, Torres-Ferreira J, Graca I,
Costa-Pinheiro P, Eilertsen IA, Antunes L, Oliveira J, et al. Epigenetic disruption of miR-130a promotes prostate cancer by targeting SEC23B and
DEPDC1. Cancer Lett. 2017;385:150–9.
21. Ramalho-Carvalho J, Graca I, Gomez A, Oliveira J, Henrique R, Esteller M,
Jeronimo C. Downregulation of miR-130b~301b cluster is mediated by aberrant promoter methylation and impairs cellular senescence in prostate cancer. J Hematol Oncol. 2017;10:43.
22. Sandoval J, Heyn H, Moran S, Serra-Musach J, Pujana MA, Bibikova M,
Esteller M. Validation of a DNA methylation microarray for 450,000 CpG sites
in the human genome. Epigenetics. 2011;6:692–702.
23. Genomes Project C, Abecasis GR, Altshuler D, Auton A, Brooks LD, Durbin
RM, Gibbs RA, Hurles ME, McVean GA. A map of human genome variation
24. Torres-Ferreira J, Ramalho-Carvalho J, Gomez A, Menezes FD, Freitas R, Oliveira J, Antunes L, Bento MJ, Esteller M, Henrique R, Jeronimo C. MiR-193b promoter methylation accurately detects prostate cancer in urine sediments and miR-34b/c or miR-129-2 promoter methylation define subsets of clinically aggressive tumors. Mol Cancer. 2017;16:26.
25. Theodore SC, Davis M, Zhao F, Wang H, Chen D, Rhim J, Dean-Colomb W,
Turner T, Ji W, Zeng G, et al. MicroRNA profiling of novel African American and Caucasian prostate Cancer cell lines reveals a reciprocal regulatory relationship
of miR-152 and DNA methyltranferase 1. Oncotarget. 2014;5:3512–25.
26. Daniunaite K, Dubikaityte M, Gibas P, Bakavicius A, Rimantas Lazutka J, Ulys
A, Jankevicius F, Jarmalaite S. Clinical significance of miRNA host gene
promoter methylation in prostate cancer. Hum Mol Genet. 2017;26:2451–61.
27. Popp MW, Maquat LE. Leveraging rules of nonsense-mediated mRNA decay
for genome engineering and personalized medicine. Cell. 2016;165:1319–22.
28. Ebert MS, Sharp PA. Roles for microRNAs in conferring robustness to
biological processes. Cell. 2012;149:515–24.
29. Bonci D, Coppola V, Musumeci M, Addario A, Giuffrida R, Memeo L, D'Urso
L, Pagliuca A, Biffoni M, Labbaye C, et al. The miR-15a-miR-16-1 cluster controls prostate cancer by targeting multiple oncogenic activities. Nat
Med. 2008;14:1271–7.
30. Jiang X, Hu C, Arnovitz S, Bugno J, Yu M, Zuo Z, Chen P, Huang H, Ulrich B,
Gurbuxani S, et al. miR-22 has a potent anti-tumour role with therapeutic potential in acute myeloid leukaemia. Nat Commun. 2016;7:11452.
31. Kroiss A, Vincent S, Decaussin-Petrucci M, Meugnier E, Viallet J, Ruffion A,
Chalmel F, Samarut J, Allioli N. Androgen-regulated microRNA-135a decreases prostate cancer cell migration and invasion through
downregulating ROCK1 and ROCK2. Oncogene. 2015;34:2846–55.
32. Goto Y, Kojima S, Nishikawa R, Enokida H, Chiyomaru T, Kinoshita T,
Nakagawa M, Naya Y, Ichikawa T, Seki N. The microRNA-23b/27b/24-1 cluster is a disease progression marker and tumor suppressor in prostate
cancer. Oncotarget. 2014;5:7748–59.
33. Rice MA, Ishteiwy RA, Magani F, Udayakumar T, Reiner T, Yates TJ, Miller P,
Perez-Stable C, Rai P, Verdun R, et al. The microRNA-23b/-27b cluster suppresses prostate cancer metastasis via huntingtin-interacting protein
1-related. Oncogene. 2016;35:4752–61.
34. Majid S, Dar AA, Saini S, Arora S, Shahryari V, Zaman MS, Chang I, Yamamura
S, Tanaka Y, Deng G, Dahiya R. miR-23b represses proto-oncogene Src kinase and functions as methylation-silenced tumor suppressor with diagnostic and prognostic significance in prostate cancer. Cancer Res. 2012; 72:6435–46.
35. Heyn H. Quantitative trait loci identify functional noncoding variation in
Cancer. PLoS Genet. 2016;12:e1005826.
36. Berezikov E. Evolution of microRNA diversity and regulation in animals. Nat
Rev Genet. 2011;12:846–60.
37. Kim YK, Kim VN. Processing of intronic microRNAs. EMBO J. 2007;26:775–83.
38. Isik M, Korswagen HC, Berezikov E. Expression patterns of intronic
microRNAs in Caenorhabditis elegans. Silence. 2010;1:5.
39. Martinez NJ, Ow MC, Reece-Hoyes JS, Barrasa MI, Ambros VR, Walhout AJ.
Genome-scale spatiotemporal analysis of Caenorhabditis elegans microRNA
promoter activity. Genome Res. 2008;18:2005–15.
40. Tsuruta T, Kozaki K, Uesugi A, Furuta M, Hirasawa A, Imoto I, Susumu N, Aoki
D, Inazawa J. miR-152 is a tumor suppressor microRNA that is silenced by
DNA hypermethylation in endometrial cancer. Cancer Res. 2011;71:6450–62.
41. Stumpel DJ, Schotte D, Lange-Turenhout EA, Schneider P, Seslija L, de
Menezes RX, Marquez VE, Pieters R, den Boer ML, Stam RW.
Hypermethylation of specific microRNA genes in MLL-rearranged infant acute lymphoblastic leukemia: major matters at a micro scale. Leukemia. 2011;25:429–39.
42. Su Y, Wang Y, Zhou H, Lei L, Xu L. MicroRNA-152 targets ADAM17 to
suppress NSCLC progression. FEBS Lett. 2014;588:1983–8.
43. Xiang Y, Ma N, Wang D, Zhang Y, Zhou J, Wu G, Zhao R, Huang H, Wang X,
Qiao Y, et al. MiR-152 and miR-185 co-contribute to ovarian cancer cells cisplatin sensitivity by targeting DNMT1 directly: a novel epigenetic therapy
independent of decitabine. Oncogene. 2014;33:378–86.
44. Lichner Z, Fendler A, Saleh C, Nasser AN, Boles D, Al-Haddad S, Kupchak P,
Dharsee M, Nuin PS, Evans KR, et al. MicroRNA signature helps distinguish early from late biochemical failure in prostate cancer. Clin Chem. 2013;59: 1595–603.
45. Chen H, Liu H, Zou H, Chen R, Dou Y, Sheng S, Dai S, Ai J, Melson J, Kittles
RA, et al. Evaluation of plasma miR-21 and miR-152 as diagnostic biomarkers
for common types of human cancers. J Cancer. 2016;7:490–9.
46. Zhu C, Li J, Ding Q, Cheng G, Zhou H, Tao L, Cai H, Li P, Cao Q, Ju X, et al.
miR-152 controls migration and invasive potential by targeting TGFalpha in prostate cancer cell lines. Prostate. 2013;73:1082–9.
47. Qiu G, Sun W, Zou Y, Cai Z, Wang P, Lin X, Huang J, Jiang L, Ding X, Hu G.
RNA interference against TMEM97 inhibits cell proliferation, migration, and
invasion in glioma cells. Tumour Biol. 2015;36:8231–8.
48. Moparthi SB, Arbman G, Wallin A, Kayed H, Kleeff J, Zentgraf H, Sun XF.
Expression of MAC30 protein is related to survival and biological variables in
primary and metastatic colorectal cancers. Int J Oncol. 2007;30:91–5.
49. Yang S, Li H, Liu Y, Ning X, Meng F, Xiao M, Wang D, Lou G, Zhang Y. Elevated
expression of MAC30 predicts lymph node metastasis and unfavorable prognosis in patients with epithelial ovarian cancer. Med Oncol. 2013;30:324.
50. Han KY, Gu X, Wang HR, Liu D, Lv FZ, Li JN. Overexpression of MAC30 is
associated with poor clinical outcome in human non-small-cell lung cancer.
Tumour Biol. 2013;34:821–5.
51. Svetlova MP, Solovjeva LV, Nikiforov AA, Chagin VA, Lehmann AR, Tomilin
NV. Staurosporine-sensitive protein phosphorylation is required for
postreplication DNA repair in human cells. FEBS Lett. 1998;428:23–6.
52. Grinchuk OV, Motakis E, Kuznetsov VA. Complex sense-antisense
architecture of TNFAIP1/POLDIP2 on 17q11.2 represents a novel transcriptional structural-functional gene module involved in breast cancer progression. BMC Genomics. 2010;11 Suppl 1:S9.
53. Xu Q, Jiang Y, Yin Y, Li Q, He J, Jing Y, Qi YT, Xu Q, Li W, Lu B, et al. A regulatory circuit of miR-148a/152 and DNMT1 in modulating cell transformation and tumor angiogenesis through IGF-IR and IRS1. J Mol Cell Biol. 2013;5:3–13.
• We accept pre-submission inquiries
• Our selector tool helps you to find the most relevant journal
• We provide round the clock customer support
• Convenient online submission
• Thorough peer review
• Inclusion in PubMed and all major indexing services • Maximum visibility for your research
Submit your manuscript at www.biomedcentral.com/submit