A b s t r a c t. Shear behaviour of a grain assembly in a shear box under the condition of no externally applied load was investigated numerically using the Discrete Element Method. The assembly was a monodisperse system compri-sing 3000 circular elements, 1 mm in diameter with an ini-tially random configuration. Both macroscopic and micro-scopic behaviour was investigated including particle mo-vement in the box, the mechanics of critical failure of the assembly and the relationship between inter-particle forces and the total normal force acting on the wall of the fixed upper box (i.e., the quantity defined as the shear force in a standard shear box test). Particle movement including a number of micro-scale failures occurred in the assembly of the upper box. An increase in the sum of contact forces and a reduction in interlocking were observed prior to the critical failures. There was a good correlation between the shear force measured at the side wall of the box and the sum of contact forces in the upper box.
K e y w o r d s: grain assembly, shear behaviour, numerical simulation, Discrete Element Method
INTRODUCTION
Improvement of cereal grain processing te-chnology requires better understanding of the mechanical behaviour of a grain assembly. Most theoretical and experimental analyses of the mechanical behaviour of an assembly of granular materials such as cereal grains employ continuum models which, by their nature, are very limited in their description of behaviour at the particle scale. An alternative to the conti-nuum approaches is the Discrete Element
Me-thod (DEM) in which the movement of each particle is calculated individually over a short time step. Calculation of the movement and in-teraction of particles can accurately represent the discrete nature of the medium and reveal detail of the micro-mechanical behaviour as well as provide a prediction of flow or defor-mation at the bulk scale. From a microscopic point of view, shear may occur between partic-les in contact during flow and during bulk de-formation of particulate media. Microscopic shear results in macroscopic shear such as ve-locity distributions in the gravity flow down an inclined plane, shear failure during quasi-static compression, etc. Understanding the micro-mechanical behaviour of a grain assembly du-ring sheadu-ring is an important aspect of the development of better continuum models of flow and deformation at the bulk scale.
An example of a system where a micro-mechanical model could be a useful tool for exploring the assumptions implicit in the conti-nuum models is a shear box test from which the internal friction coefficient of a particulate as-sembly is determined. Although the asas-sembly under the test is comprised of discrete particles, the model (Coulomb’s law) from which the coefficient is determined assumes that the mate-rial is a continuum and shear occurs along the ANALYSIS OF THE SHEAR BEHAVIOUR OF A GRAIN ASSEMBLY
USING DEM SIMULATION
E. Sakaguchi1, J.F. Favier2
1Department of Bioproduction and Environment Engineering, Tokyo University of Agriculture, 1-1-1 Sakuragaoka, Setagaya-ku, Tokyo, 156-8502, Japan
2
Department of Agricultural and Environmental Science, University of Newcastle upon Tyne, Newcastle upon Tyne, NE1 7RU, UK
shear plane between the upper and lower boxes. This assumption is implicit in the method of measurement of the shear force. The shear force is assumed to be transmitted uniformly through the bulk above the shear plane, and is measured at the side wall of the static half of the box. However, microscopic shear can take place at all the contact points between particles and ma-croscopic shear can occur at regions in addition to the shear plane. Shear forces are transferred via contacts between the particles which can move relative to one another. This may cause an anisotropic force transmission. It is likely that discrepancies between the assumed and the actual shear behaviour are greater for non-cohesive and relatively large particles such as rice grains than for fine, cohesive particles such as soil particles. Investigation of what actually happens internally in the box during shearing is required in order to determine more precisely the meaning of the internal friction coefficient for the assemblies of cereal grains.
One of the first investigations of the shear deformation of granular media using the DEM was by Thornton and Barnes [4] who modelled 2-D quasi-static compression of a nominal circular domain within a larger bulk comprising circular disks. They showed that force distri-bution was by means of particular particle con-tact pathways (which they termed “force chains”) rather than uniformly through the bulk. The particular particles carrying the major portion of the load (i.e., elements in the force chain) and the orientation of the force chains was de-pendent on the direction of the applied load, the particle size distribution and other micro-me-chanical variables. Shear deformation of gra-nular media was later simulated in 3-D by Thornton and Sun [5] but not under conditions applying to a shear box test. Hidakaet al. [1] investigated shear behaviour in a shear box under conditions of no externally applied load (i.e., loading by the self-weight of the grains only) and an externally applied vertical load using a DEM simulation with discs and physical experiment. Both the experimental and the DEM results showed evidence of macroscopic
shear in regions of the shear box additional to the theoretical (i.e., using a continuum model) shear plane in the box. In that work the number of model particles was limited to 420 and the micro-mechanical mechanisms underlying the macroscopic shear were not investigated.
In this study the shear behaviour of a grain assembly in the shear box was analysed using a 2-D DEM simulation. As the first step of the analysis, the assembly was sheared under a condition of loading only by the self-weight of the grain assembly. Critical failure of the as-sembly during shearing and the relationship be-tween inter-particle forces in the assembly and transmission of shear force to the walls were examined.
SIMULATION METHOD
Shear conditions
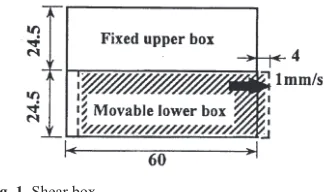
The dimensions of the shear box are shown in Fig. 1. The upper box was fixed and the total normal force acting on the right side wall was calculated during shearing as the so called “she-ar force” in the she“she-ar box test. She“she-aring was ge-nerated by moving the lower box horizontally at 1 mm s-1with a maximum shear displacement of 4 mm.
DEM simulation conditions
not included in the model. A time step of 1×10⁻⁴s was chosen to give an acceptable com-putational time. The spring constant between particles for the normal contact force,
k
n, was set to 20 000 N m-1using a constraint previou-sly described by Sakaguchiet al.[2]. Thek
be-tween a particle and wall,k
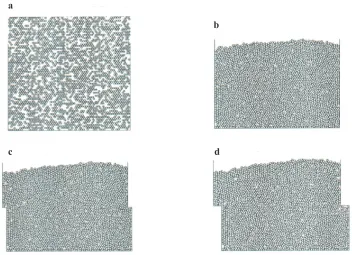
for tangential con-tact force and the damping constant h were determined using the method described by Sa-kaguchiet al.[2]. Spring, damping and friction constants used in the contact force model were as shown in Table 1.Particles were generated and placed ran-domly in the shear box (Fig. 3a) followed by consolidation of particles for 1 s under a gravity field using a method described by Sakaguchiet al.[3] giving an initial random arrangement of particles as shown in Fig. 3b. The grain assem-bly was then sheared for 4 s. The position co-ordinates of all particles, the shear force, particle velocity, contact forces at all contact points, the number of contact points, the contact network and the porosity in the box during shearing were recorded.
Fig. 2.Contact force model.
Parameter between
particles particle and wall
Spring constant (N m-1)
Damping constant (kg s-1)
Friction coefficient
kn
ks hn hs m
20 000 5 000
7.10 3.55 1.0
30 000 7 500
8.70 4.35 0.5
T a b l e 1.Mechanical constants in the contact force model
Fig. 3.Snapshots of the simulation results: before consolidation by gravity force (a), shear displacement : 0 mm (b), 2 mm (c), and 4 mm (d).
a
b
RESULTS AND DISCUSSION
Free surface profile
There was a decrease in the height of the free surface near the left side wall and an associated increase in the height near the right side wall as shown in Figs 3b-d. The change of the free surface profile was similar to that observed in the experiment and simulation by Hidakaet al.[1]. From the distribution of the displacement locus of particles, a convective-like flow of particles was observed in the upper box. The flow was rotational in an anti-clock-wise direction with the centre of rotation in the middle of the box near the free surface. Such a
change in the free surface profile meant that macroscopic shear occurred at regions in the upper box in addition to the assumed line of shear during shearing.
Critical failure
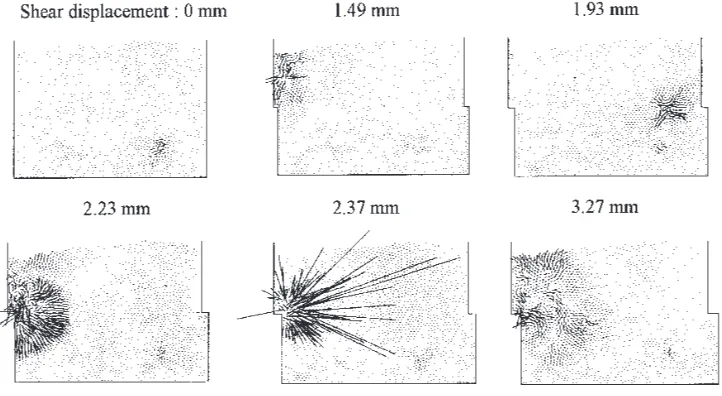
The particle velocity vectors and the inter-particle contact force vectors are shown in Figs 4 and 5, respectively. The contact network in which the contact between particles is repre-sented by drawing a line between the centres of particles in contact is shown in Fig. 6. Failure during shearing occurred near both side walls as shown in Fig. 4. Similar macroscopic shear
Fig. 4.Velocity distributions.
Fig. 6.Contact network.
failure was observed in experiment and simula-tion by Hidakaet al. [1]. At a shear displace-ment of 2.37 mm in particular, a large failure was observed close to the shear line near the left side wall. At the same time, as shown in Fig. 5, the contact force increased and was concentra-ted in the region where the largest failure took place. Immediately after the large failure a part of the contact network near the left side wall of the upper box was cut (Fig. 6). In other words the particle packing became looser in that region resulting in a new local arrangement of particles after the large failure.
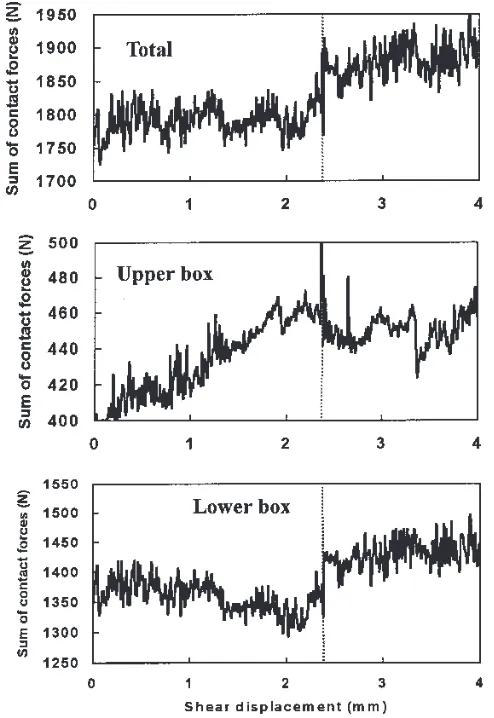
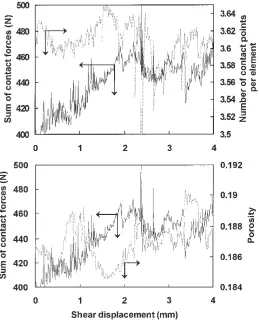
The change in the sum of contact forces in the shear box with shear displacement is shown in Fig. 7. The value of a contact force is re-presented by the magnitude of a contact force
vector. The sum of the contact forces in the upper box increased with fluctuation until the large failure took place. This was balanced by a reduction in the sum of contact forces in the lower box. As shown in Fig. 7, the change in the sum of contact forces with the shear displace-ment after the large failure was distinctly different from those before the failure. This in-dicates that the large failure can be considered as a critical failure during shearing and high-lights how DEM investigation of the relation-ship between particle interlocking and contact forces in granular media can provide insights into the modes of critical failure within the bulk. Figure 8 shows microscopic relationship be-tween the total contact force and particle contacts in the upper box during shear. During
the shear displacement from 1.5 to 2.37 mm the contact point number decreased and porosity increased in the upper box. This meant that packing gradually became looser and bed volume expanded as the degree of interlocking progressively reduced. At the same time the sum of contact forces in the upper box con-tinued to increase. When the interlocking was at last overcome by the contact force a critical failure took place. After the critical failure, some particles moved from the upper to the lower box and the movement resulted in an increase in contact forces near the line of shear in the lower box due to consolidation under the new arrangement of particles (Fig. 7).
Correlation between shear force and contact force
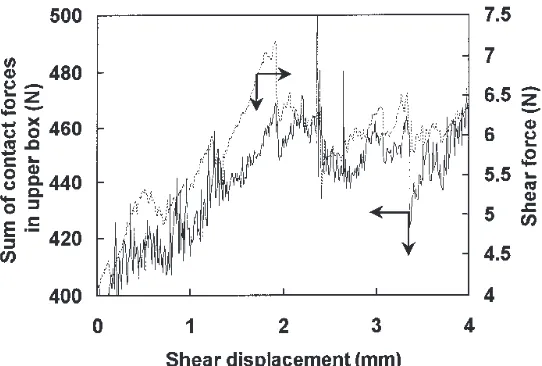
Figure 9 shows the changes of the shear force and the sum of contact forces in the upper box with shear displacement during shearing. The change of shear force had almost the same trend as the sum of contact forces. This agre-ement indicates that the gross change in the sum of contact forces was propagated to the fixed right side wall through particular paths in the
contact network shown in Fig. 6. There was however, a small difference between them in their profile. The peak indicating a critical failure did not correspond to the maximum in the change of the shear force while the sum of contact forces in the upper box was the ma-ximum. As shown in Fig. 5, the failure took place near the left side wall. It appears that the contact forces generated in the failure were attenuated during their transmission to the right side wall. Moreover, the shear force was much smaller in magnitude than the sum of contact forces (Fig. 9). These differences between the two kinds of forces may be caused by energy dissipation due to the frictional force in the microscopic shear between particles and tran-slational and rotational motions of each particle. Force is also attenuated by elastic and viscous energy dissipation during propagation in a con-tinuum. The energy dissipation in a granular assembly is larger than that in a continuum be-cause of the possibility of relative movement of each particle in the assembly. Particularly, in this simulation, it is likely that the change of free surface profile due to the condition of no ex-ternally applied load resulted in the large at-tenuation during transmission of forces.
CONCLUSIONS
The use of DEM simulation provided an insight into the microscopic shear behaviour of a grain assembly in the shear box under the condition of no externally applied load. Particle movement including microscale failure was observed not only along the shear line but also in other regions in the fixed upper box. This particle movement caused the change of free surface profile of the assembly. In the upper box, an increase in the sum of contact forces and a reduction in interlocking were observed prior to the critical failure of the grain bulk. Good correlation was observed between the sum of contact forces in the upper box and the shear force which is the total of normal forces applied on the side wall of the upper box. The shear force was smaller in magnitude than the sum of contact forces due to attenuation during transmission of contact forces to the side wall in the upper box. The simulation outlined here was for a condition under which bulk movement of grains in the upper box was not constrained. Direct comparison with a standard shear box test can not therefore be made from these results
which represent the first stage in such an analysis. Further work will investigate the shear behaviour of a grain assembly under an applied load and the relationship between the micro-mechanical behaviour and the internal friction coefficient.
REFERENCES
1. Hidaka J., Shimoi N., Miwa S.:Numerical simulation of shearing failure process in a granular assembly (in Japanese). Proc. Spring Conf. Japanese Society of Powder Technology, Oosaka, 18-21,1987.
2. Sakaguchi E., Kawakami S., Suzuki M., Urakawa T., Favier J. F.: Effective use of DEM simulation for development of grain processing technology appli-cation of shaking separation phenomenon of paddy and brown rice. AgEng 8(OSLO), Report No.98-F-021, 1-8, 1998.
3. Sakaguchi E., Kawakami S., Tobita F.:Simulation on flowing phenomena of grains by distinct element method. AgEng 4(MILANO), Report No. 94-G-025, 1-8,1994.
4. Thornton C., Barnes D. J.:Computer simulated de-formation of compact granular assemblies. Acta Me-chanica 64, 45-61, 1986.