VOLUME NO. 5 (2015), ISSUE NO. 08 (AUGUST) ISSN 2231-5756
A Monthly Double-Blind Peer Reviewed (Refereed/Juried) Open Access International e-Journal - Included in the International Serial Directories Indexed & Listed at:
Ulrich's Periodicals Directory ©, ProQuest, U.S.A., EBSCO Publishing, U.S.A., Cabell’s Directories of Publishing Opportunities, U.S.A., Open J-Gage, India [link of the same is duly available at Inflibnet of University Grants Commission (U.G.C.)],
VOLUME NO. 5 (2015), ISSUE NO. 08 (AUGUST) ISSN 2231-5756
INTERNATIONAL JOURNAL OF RESEARCH IN COMMERCE, IT & MANAGEMENT
CONTENTS
Sr.
No.
TITLE & NAME OF THE AUTHOR (S)
Page
No.
1
.
TIME LAG ANALYSIS OF SELECTED INDIAN COMPANIES
DR. RAMANJIT KAUR
1
2
.
A STUDY ON WOMEN EMPLOYEE ATTRITION IN IT INDUSTRY WITH SPECIAL REFERENCE TO
TECHNOPARK, THIRUVANANTHAPURAM
DR. R. MOHAN KUMAR & A. ASTALIN MELBA
5
3
.
CUSTOMERS PERCEPTION TOWARDS ELECTRIC TWO WHEELER VEHICLES IN BANGALORE CITY: A
STUDY ON GO GREEN BATTERY OPERATED VEHICLES
SANTHOSH.M & RAGHAVENDRA.K.A
9
4
.
STATUS OF SCHEDULE TRIBES IN TELANGANA REGION
A. LAKSHMI
15
5
.
COMPANIES ACT 2013: A NEW INITIATIVE TOWARDS CORPORATE GOVERNANCE
BHARAT N. BASRANI
18
6
.
CATALOGUING OF ISSUES BIRTHING LIFE INSURANCE POLICIES LAPSATION: A CASE STUDY OF
HARYANA
DR. SILENDER SINGH HOODA
21
7
.
MICROFINANCE AND IT’s PROGRESS IN UTTARAKHAND
GAURAV PANT
24
8
.
STRATEGIC ISSUES OF MAKE IN INDIA CAMPAIGN
DR. SONIA, DR. GARIMA DALAL, YOGITA & SUMEET MALIK
29
9
.
THE STUDY OF IMPACT SIMULTANEOUS OF CAPITAL STRUCTURE AND COMPETITIVE POSITION IN
PRODUCT MARKET (MARKET SHARE) OF COMPANY LISTED IN TEHRAN STOCK EXCHANGE
YAVAR MOBASHER & MOHAMMAD REZA POURALI
33
10
.
SEGMENTATION STUDIES FOR GREEN MARKETING AND THEIR LIMITATIONS
RAJEEV GUPTA
39
11
.
TRANSFORMING THE NIGERIAN ECONOMY THROUGH FOREIGN DIRECT INVESTMENT: THE ROLE OF
FINANCIAL DEVELOPMENT
DR. NSEABASI IMOH ETUKAFIA & DR. AKPAN JAMES WILLIAMS
43
12
.
A STUDY OF FEMININE SANITARY WELL BEING OF KORKU TRIBE IN SOUTH MADHYA PRADESH
DR. SUNEELI ANAND & PARTH GUPTA
50
13
.
A CAPSULIZATION OF REGNANT CONTENTIONS IN HRM
KIRTI S BIDNUR
54
14
.
MICRO FINANCE INSTITUTIONS (MFIs): AN ANALYSIS OF THEIR FUNCTIONING IN BELLARY DISTRICT
DURGASHAMILI.SUNKARA & GURUDATT.KAMATH B
58
15
.
VALUE ADDITION ON KENYAN TEAS: EFFECTS ON INTERNATIONAL MARKET SUSTAINABILITY AND
COMPETITIVENESS
ESTHER WANJIRU MAINA
65
16
.
EMPLOYEE RETENTION: MANAGING THE HUMAN RESOURCE IN EDUCATION SECTOR
JWALA HANDOO & TANIA MENGI
68
17
.
PERFORMANCE EVALUATION OF MUTUAL FUNDS OF ICICI AND SBI
CHILLAKURU ESWARAMMA
71
18
.
MULTIVARIATE MODEL FOR PREDICTING THE IMPACT OF FIRM SPECIFIC VARIABLES ON FINANCIAL
PERFORMANCE OF AIR INDIA LIMITED
SWARICHA JOHRI
78
19
.
A STUDY ON ECONOMICS OF TOURISM WITH SPECIAL REFERENCE TO VELANKANNI- NAGAPATTINAM
DISTRICT
W.ROSE MARY FLORENCE
82
20
.
INNOVATION CAPACITY: A PREREQUISITE FOR ‘MAKE IN INDIA’
AAINA DHINGRA
89
VOLUME NO. 5 (2015), ISSUE NO. 08 (AUGUST) ISSN 2231-5756
INTERNATIONAL JOURNAL OF RESEARCH IN COMMERCE, IT & MANAGEMENT
CHIEF PATRON
PROF. K. K. AGGARWAL
Chairman, Malaviya National Institute of Technology, Jaipur
(An institute of National Importance & fully funded by Ministry of Human Resource Development, Government of India)
Chancellor, K. R. Mangalam University, Gurgaon
Chancellor, Lingaya’s University, Faridabad
Founder Vice-Chancellor (1998-2008), Guru Gobind Singh Indraprastha University, Delhi
Ex. Pro Vice-Chancellor, Guru Jambheshwar University, Hisar
FOUNDER PATRON
LATE SH. RAM BHAJAN AGGARWAL
Former State Minister for Home & Tourism, Government of Haryana
Former Vice-President, Dadri Education Society, Charkhi Dadri
Former President, Chinar Syntex Ltd. (Textile Mills), Bhiwani
FORMER CO-ORDINATOR
DR. S. GARG
Faculty, Shree Ram Institute of Business & Management, Urjani
ADVISORS
PROF. M. S. SENAM RAJU
Director A. C. D., School of Management Studies, I.G.N.O.U., New Delhi
PROF. M. N. SHARMA
Chairman, M.B.A., Haryana College of Technology & Management, Kaithal
PROF. S. L. MAHANDRU
Principal (Retd.), Maharaja Agrasen College, Jagadhri
EDITOR
PROF. R. K. SHARMA
Professor, Bharti Vidyapeeth University Institute of Management & Research, New Delhi
CO-EDITOR
DR. BHAVET
Faculty, Shree Ram Institute of Engineering & Technology, Urjani
EDITORIAL ADVISORY BOARD
DR. RAJESH MODI
Faculty, Yanbu Industrial College, Kingdom of Saudi Arabia
PROF. SANJIV MITTAL
University School of Management Studies, Guru Gobind Singh I. P. University, Delhi
PROF. ANIL K. SAINI
Chairperson (CRC), Guru Gobind Singh I. P. University, Delhi
DR. SAMBHAVNA
VOLUME NO. 5 (2015), ISSUE NO. 08 (AUGUST) ISSN 2231-5756
INTERNATIONAL JOURNAL OF RESEARCH IN COMMERCE, IT & MANAGEMENT
DR. MOHENDER KUMAR GUPTA
Associate Professor, P. J. L. N. Government College, Faridabad
DR. SHIVAKUMAR DEENE
Asst. Professor, Dept. of Commerce, School of Business Studies, Central University of Karnataka, Gulbarga
ASSOCIATE EDITORS
PROF. NAWAB ALI KHAN
Department of Commerce, Aligarh Muslim University, Aligarh, U.P.
PROF. ABHAY BANSAL
Head, Department of Information Technology, Amity School of Engineering & Technology, Amity
University, Noida
PROF. A. SURYANARAYANA
Department of Business Management, Osmania University, Hyderabad
PROF. V. SELVAM
SSL, VIT University, Vellore
DR. PARDEEP AHLAWAT
Associate Professor, Institute of Management Studies & Research, Maharshi Dayanand University, Rohtak
DR. S. TABASSUM SULTANA
Associate Professor, Department of Business Management, Matrusri Institute of P.G. Studies, Hyderabad
SURJEET SINGH
Asst. Professor, Department of Computer Science, G. M. N. (P.G.) College, Ambala Cantt.
FORMER TECHNICAL ADVISOR
AMITA
Faculty, Government M. S., Mohali
FINANCIAL ADVISORS
DICKIN GOYAL
Advocate & Tax Adviser, Panchkula
NEENA
Investment Consultant, Chambaghat, Solan, Himachal Pradesh
LEGAL ADVISORS
JITENDER S. CHAHAL
Advocate, Punjab & Haryana High Court, Chandigarh U.T.
CHANDER BHUSHAN SHARMA
Advocate & Consultant, District Courts, Yamunanagar at Jagadhri
SUPERINTENDENT
VOLUME NO. 5 (2015), ISSUE NO. 08 (AUGUST) ISSN 2231-5756
INTERNATIONAL JOURNAL OF RESEARCH IN COMMERCE, IT & MANAGEMENT
CALL FOR MANUSCRIPTS
We invite unpublished novel, original, empirical and high quality research work pertaining to recent developments & practices in the areas of Computer Science & Applications; Commerce; Business; Finance; Marketing; Human Resource Management; General Management; Banking; Economics; Tourism Administration & Management; Education; Law; Library & Information Science; Defence & Strategic Studies; Electronic Science; Corporate Governance; Industrial Relations; and emerging paradigms in allied subjects like Accounting; Accounting Information Systems; Accounting Theory & Practice; Auditing; Behavioral Accounting; Behavioral Economics; Corporate Finance; Cost Accounting; Econometrics; Economic Development; Economic History; Financial Institutions & Markets; Financial Services; Fiscal Policy; Government & Non Profit Accounting; Industrial Organization; International Economics & Trade; International Finance; Macro Economics; Micro Economics; Rural Economics; Co-operation; Demography: Development Planning; Development Studies; Applied Economics; Development Economics; Business Economics; Monetary Policy; Public Policy Economics; Real Estate; Regional Economics; Political Science; Continuing Education; Labour Welfare; Philosophy; Psychology; Sociology; Tax Accounting; Advertising & Promotion Management; Management Information Systems (MIS); Business Law; Public Responsibility & Ethics; Communication; Direct Marketing; E-Commerce; Global Business; Health Care Administration; Labour Relations & Human Resource Management; Marketing Research; Marketing Theory & Applications; Non-Profit Organizations; Office Administration/Management; Operations Research/Statistics; Organizational Behavior & Theory; Organizational Development; Production/Operations; International Relations; Human Rights & Duties; Public Administration; Population Studies; Purchasing/Materials Management; Retailing; Sales/Selling; Services; Small Business Entrepreneurship; Strategic Management Policy; Technology/Innovation; Tourism & Hospitality; Transportation Distribution; Algorithms; Artificial Intelligence; Compilers & Translation; Computer Aided Design (CAD); Computer Aided Manufacturing; Computer Graphics; Computer Organization & Architecture; Database Structures & Systems; Discrete Structures; Internet; Management Information Systems; Modeling & Simulation; Neural Systems/Neural Networks; Numerical Analysis/Scientific Computing; Object Oriented Programming; Operating Systems; Programming Languages; Robotics; Symbolic & Formal Logic; Web Design and emerging paradigms in allied subjects.
Anybody can submit the soft copy of unpublished novel; original; empirical and high quality research work/manuscriptanytime in M.S. Word format
after preparing the same as per our GUIDELINES FOR SUBMISSION; at our email address i.e. [email protected] or online by clicking the link online submission as given on our website (FOR ONLINE SUBMISSION, CLICK HERE).
GUIDELINES FOR SUBMISSION OF MANUSCRIPT
1. COVERING LETTER FOR SUBMISSION:
DATED: _____________
THE EDITOR
IJRCM
Subject: SUBMISSION OF MANUSCRIPT IN THE AREA OF .
(e.g. Finance/Mkt./HRM/General Mgt./Engineering/Economics/Computer/IT/ Education/Psychology/Law/Math/other, please specify)
DEAR SIR/MADAM
Please find my submission of manuscript entitled ‘___________________________________________’ for possible publication in one of your journals.
I hereby affirm that the contents of this manuscript are original. Furthermore, it has neither been published elsewhere in any language fully or partly, nor is it under review for publication elsewhere.
I affirm that all the co-authors of this manuscript have seen the submitted version of the manuscript and have agreed to their inclusion of names as co-authors.
Also, if my/our manuscript is accepted, I agree to comply with the formalities as given on the website of the journal. The Journal has discretion to publish our contribution in any of its journals.
NAME OF CORRESPONDING AUTHOR :
Designation :
Institution/College/University with full address & Pin Code : Residential address with Pin Code : Mobile Number (s) with country ISD code : Is WhatsApp or Viber active on your above noted Mobile Number (Yes/No) : Landline Number (s) with country ISD code :
E-mail Address :
Alternate E-mail Address :
VOLUME NO. 5 (2015), ISSUE NO. 08 (AUGUST) ISSN 2231-5756
INTERNATIONAL JOURNAL OF RESEARCH IN COMMERCE, IT & MANAGEMENT
NOTES:
a) The whole manuscript has to be in ONE MS WORD FILE only, which will start from the covering letter, inside the manuscript.
pdf. version is liable to be rejected without any consideration.
b) The sender is required to mention the following in the SUBJECT COLUMNof the mail:
New Manuscript for Review in the area of (e.g. Finance/Marketing/HRM/General Mgt./Engineering/Economics/Computer/IT/
Education/Psychology/Law/Math/other, please specify)
c) There is no need to give any text in the body of mail, except the cases where the author wishes to give any specific message
w.r.t. to the manuscript.
d) The total size of the file containing the manuscript is expected to be below 1000 KB.
e) Abstract alone will not be considered for review and the author is required to submit the complete manuscript in the first
instance.
f) The journal gives acknowledgement w.r.t. the receipt of every email within twenty four hours and in case of non-receipt of acknowledgment from the journal, w.r.t. the submission of manuscript, within two days of submission, the corresponding author is required to demand for the same by sending a separate mail to the journal.
g) The author (s) name or details should not appear anywhere on the body of the manuscript, except the covering letter and the cover page of the manuscript, in the manner as mentioned in the guidelines.
2. MANUSCRIPT TITLE: The title of the paper should be bold typed, centeredand fully capitalised.
3. AUTHOR NAME (S) & AFFILIATIONS: Author (s) name, designation, affiliation (s), address, mobile/landline number (s), and
email/alternate email address should be given underneath the title.
4. ACKNOWLEDGMENTS: Acknowledgements can be given to reviewers, guides, funding institutions, etc., if any.
5. ABSTRACT: Abstract should be in fully italicized text, ranging between 150 to 300 words. The abstract must be informative and
explain the background, aims, methods, results & conclusion in a SINGLE PARA. Abbreviations must be mentioned in full.
6. KEYWORDS: Abstract must be followed by a list of keywords, subject to the maximum of five. These should be arranged in
alphabetic order separated by commas and full stop at the end. All words of the keywords, including the first one should be in small letters, except special words e.g. name of the Countries, abbreviations.
7. JEL CODE: Provide the appropriate Journal of Economic Literature Classification System code (s). JEL codes are available at
www.aeaweb.org/econlit/jelCodes.php, however, mentioning JEL Code is not mandatory.
8. MANUSCRIPT: Manuscript must be in BRITISH ENGLISH prepared on a standard A4 size PORTRAIT SETTING PAPER. It should be free
from any errors i.e. grammatical, spelling or punctuation. It must be thoroughly edited at your end.
9. HEADINGS: All the headings must be bold-faced, aligned left and fully capitalised. Leave a blank line before each heading.
10. SUB-HEADINGS: All the sub-headings must be bold-faced, aligned left and fully capitalised.
11. MAIN TEXT:
THE MAIN TEXT SHOULD FOLLOW THE FOLLOWING SEQUENCE:
INTRODUCTION
REVIEW OF LITERATURE
NEED/IMPORTANCE OF THE STUDY
STATEMENT OF THE PROBLEM OBJECTIVES
HYPOTHESIS (ES)
RESEARCH METHODOLOGY
RESULTS & DISCUSSION FINDINGS
RECOMMENDATIONS/SUGGESTIONS
CONCLUSIONS LIMITATIONS
SCOPE FOR FURTHER RESEARCH REFERENCES
APPENDIX/ANNEXURE
VOLUME NO. 5 (2015), ISSUE NO. 08 (AUGUST) ISSN 2231-5756
INTERNATIONAL JOURNAL OF RESEARCH IN COMMERCE, IT & MANAGEMENT
12. FIGURES & TABLES: These should be simple, crystal CLEAR, centered, separately numbered & self explained, and titles must be
above the table/figure. Sources of data should be mentioned below the table/figure. It should be ensured that the tables/figures
are referred to from the main text.
13. EQUATIONS/FORMULAE: These should be consecutively numbered in parenthesis, horizontally centered with equation/formulae
number placed at the right. The equation editor provided with standard versions of Microsoft Word should be utilised. If any other equation editor is utilised, author must confirm that these equations may be viewed and edited in versions of Microsoft Office that does not have the editor.
14. ACRONYMS: These should not be used in the abstract. The use of acronyms is elsewhere is acceptable. Acronyms should be defined
on its first use in each section: Reserve Bank of India (RBI). Acronyms should be redefined on first use in subsequent sections.
15. REFERENCES: The list of all references should be alphabetically arranged. The author (s) should mention only the actually utilised
references in the preparation of manuscript and they are supposed to follow Harvard Style of Referencing. Also check to make sure
that everything that you are including in the reference section is duly cited in the paper. The author (s) are supposed to follow the
references as per the following:
All works cited in the text (including sources for tables and figures) should be listed alphabetically. Use (ed.) for one editor, and (ed.s) for multiple editors.
When listing two or more works by one author, use --- (20xx), such as after Kohl (1997), use --- (2001), etc, in chronologically ascending order.
Indicate (opening and closing) page numbers for articles in journals and for chapters in books.
The title of books and journals should be in italics. Double quotation marks are used for titles of journal articles, book chapters, dissertations, reports, working papers, unpublished material, etc.
For titles in a language other than English, provide an English translation in parenthesis.
Headers, footers, endnotes and footnotes should not be used in the document. However, you can mention short notes to elucidate
some specific point, which may be placed in number orders after the references.
PLEASE USE THE FOLLOWING FOR STYLE AND PUNCTUATION IN REFERENCES:
BOOKS
Bowersox, Donald J., Closs, David J., (1996), "Logistical Management." Tata McGraw, Hill, New Delhi. Hunker, H.L. and A.J. Wright (1963), "Factors of Industrial Location in Ohio" Ohio State University, Nigeria.
CONTRIBUTIONS TO BOOKS
Sharma T., Kwatra, G. (2008) Effectiveness of Social Advertising: A Study of Selected Campaigns, Corporate Social Responsibility, Edited by David Crowther & Nicholas Capaldi, Ashgate Research Companion to Corporate Social Responsibility, Chapter 15, pp 287-303.
JOURNAL AND OTHER ARTICLES
Schemenner, R.W., Huber, J.C. and Cook, R.L. (1987), "Geographic Differences and the Location of New Manufacturing Facilities," Journal of Urban Economics, Vol. 21, No. 1, pp. 83-104.
CONFERENCE PAPERS
Garg, Sambhav (2011): "Business Ethics" Paper presented at the Annual International Conference for the All India Management Association, New Delhi, India, 19–23
UNPUBLISHED DISSERTATIONS
Kumar S. (2011): "Customer Value: A Comparative Study of Rural and Urban Customers," Thesis, Kurukshetra University, Kurukshetra.
ONLINE RESOURCES
Always indicate the date that the source was accessed, as online resources are frequently updated or removed.
WEBSITES
VOLUME NO. 5 (2015), ISSUE NO. 08 (AUGUST) ISSN 2231-5756
INTERNATIONAL JOURNAL OF RESEARCH IN COMMERCE, IT & MANAGEMENT
TIME LAG ANALYSIS OF SELECTED INDIAN COMPANIES
DR. RAMANJIT KAUR
PRINCIPAL
GURU HARGOBIND SAHIB KHALSA GIRLS COLLEGE
KARHALI SAHIB
ABSTRACT
This study aims to examine the time lag analysis of balance sheet date and date of auditor’s report, date of auditor’s report and annual general meeting date and balance sheet date and annual general meeting date of 50 selected Indian companies related to the period from 2002-03 to 2008-09. The results revealed that the company wise time lag from auditor’s report to annual general meeting witnessed ups and downs in Bharti Airtel Ltd., NTPC Ltd., NMTC and Sun Pharmaceuticals Ltd. The company wise time lag from balance sheet to auditor’s report witnessed fluctuations in Reliance Industries Ltd., Bharti Airtel Ltd., NMDC, Sun Pharmaceuticals Ltd., GAIL India, Hero Motocorp Ltd., Sterlite Industry Ltd. and Bharat Petroleum corp. Ltd. However, it increased significantly in Infosys Ltd., HDFC Bank Ltd., Ambuja Cement Ltd. and Hindalco Industry Ltd. The time lag from balance sheet to annual general meeting reported no definite trend in Reliance Industries Ltd. and Sun Pharmaceuticals Ltd. The study suggested that the companies with increasing time lag should check this trend and the fluctuations need to be curbed in order to get a definite trend in time lag.
KEYWORDS
INTRODUCTIONorporate annual reports are prepared to transmit the information to the stakeholders according to their needs. As the informational needs of the stakeholders who have active interest in corporate reporting are on rise, there is a dire need for timely and credible corporate reports. Time lag in corporate disclosure refers to the time gap between the end of the accounting period and the date on which the corporate annual financial reports are issued. According to Section 210 (3) of the Companies Act, 1956, (i) The first annual general meeting of the company to be held within 9 months of its incorporation; (ii) Any subsequent annual general meeting of the company to be held within 6 months after the submission of its annual account. According to Section 219 (1) of the Act, a copy of annual report which is to be laid in annual general meeting by a company must be delivered at least twenty-one days before the date of the meeting to every member of the company. In this backdrop, an attempt has been made to analyse the time lag of the selected Indian companies.
REVIEW OF LITERATURE
Various researchers have studied the different aspects of timeliness in corporate reporting. Givoly and Palmon (1982) discovered that there was an improvement in the timeliness of annual reports of 210 companies listed on New York Stock Exchange (NYSE) over a period of 15 years from 1960 to 1974. To describe timeliness corporate size and complexity of operations were taken into consideration. According to them, delay in reporting appeared to be more closely associated to industry patterns and traditions rather than to the company attributes studied and reporting time lags decreased over time. Sharma (1991) examined financial reporting in Central Public Government Enterprises incorporated under Companies Act 1956. He concluded that size of the firm and age has a significant relationship with its reporting time lag. Ahmad (2003) investigates the timeliness of corporate annual reporting in three South Asian countries, namely, Bangladesh, India and Pakistan from 558 annual reports of different companies for the year 1998. It is found that around 90 % of the companies’ balance sheet end date falls in June and December in Bangladesh, March in India, and June and September in Pakistan. A multivariate regression analysis indicates that financial year-end date is a significant determinant in each country.
Ismail and Chandler (2004) examined the timeliness of quarterly financial reports published by companies listed on the Kuala Lumpur Stock Exchange (KLSE). In their study, they also determined the association between timeliness and each of the following company attributes – size, profitability, growth and capital structure. An analysis of 117 quarterly reports ended on 30 September 2001 reveals that all, except one company reported within an allowable reporting lag of two months. According to the study, there is a significant association between timeliness and each of the four companies attributes.
Conover, Miller and Szakmary (2008) study financial reporting lags, the incidence of late filing, and the relationship between reporting lags, firm performance and the degree of capital market scrutiny. They use a large sample of firms spanning 22 countries over an eleven-year period. A focal point of their analysis is whether the incidence of late filing, and the relations between reporting days and other variables differ systematically between common and code law countries. Relative to U.S. firms, they report that the time taken and allowed for filing is usually longer in other countries and that the statutory requirement is more frequently violated. Timely filing is found to be less frequent in code law countries. Poor firm performance and longer reporting lags are more strongly linked in common law countries Therefore, the above analysis describes that plenty of research has been conducted to explore new insights into the field of timeliness in corporate disclosure.
OBJECTIVES
The main aim of the study is to examine the time lag of the selected Indian companies. More specifically, the study is concentrated on the following objectives: 1. To study the company wise time lag between balance sheet date and date of auditor’s report.
2. To access the company wise time lag between date of auditor’s report and annual general meeting date. 3. To examine the company wise time lag between balance sheet date and annual general meeting date.
RESEARCH METHODOLOGY
For the fulfillment of the objective of the study, data has been obtained from the annual reports of 50 selected Indian companies. The data has been collected from the Annual Reports of the companies from 2002-03 to 2008-09. To achieve the objectives of the study, various statistical tools such as average, coefficient of variation, compound growth rate and t-values has been computed.
RESULTS AND DISCUSSIONS
COMPANY-WISE TIME LAG BETWEEN BALANCE SHEET AND AUDITOR’S REPORT
A perusal of Table 1 indicated that the company wise time lag from balance sheet to auditor’s report witnessed ups and downs in Reliance Industries Ltd., Bharti Airtel Ltd., NMDC, Sun Pharmaceuticals Ltd., GAIL India, Hero Motocorp Ltd., Sterlite Industry Ltd. and Bharat Petroleum corp. Ltd. The time lag from balance sheet to auditor’s report increased significantly in Infosys Ltd., HDFC Bank Ltd., Ambuja Cement Ltd. and Hindalco Industry Ltd. The time lag from balance sheet to auditor’s report declined significantly in NTPC, State Bank of India, Indian Oil Corporation, Mahindra & Mahindra Ltd., etc. In the remaining companies, there was either stagnation or fluctuations in time lag from balance sheet to auditor’s report. The declining time lag from balance sheet to auditor’s report is an encouraging trend. However, the companies with increasing time lag should check this trend and the fluctuations need to be curbed in order to get a definite trend in time lag from balance sheet to auditor’s report.
VOLUME NO. 5 (2015), ISSUE NO. 08 (AUGUST) ISSN 2231-5756
INTERNATIONAL JOURNAL OF RESEARCH IN COMMERCE, IT & MANAGEMENT
TABLE 1 : COMPANY-WISE REPORTING TIME LAG BETWEEN BALANCE SHEET TO AUDITOR’S REPORT (Number of days)
S. No. Company 2002-03 2003-04 2004-05 2005-06 2006-07 2007-08 2008-09 Average C.V. C.G.R. t-value 1. Reliance Ind. Ltd. 23 29 27 27 150 21 190 66.71 107.24 30.27 1.51
2. ONGC Ltd. 84 83 81 87 86 86 85 84.57 2.45 0.60 1.36
3. ITC, Ltd. 53 58 57 56 56 53 52 55.00 4.20 -0.91 1.19 4. Infosys Tech. Ltd. 10 13 14 14 13 15 15 13.43 12.80 5.23 2.82* 5. Bharti Airtel Ltd. 169 23 117 28 27 25 29 59.71 98.59 -20.96 1.96 6. NTPC Ltd. 107 84 74 61 60 59 52 71.00 26.97 -10.42 7.23** 7. State Bank of India 90 58 50 49 42 32 30 50.14 40.32 -15.33 8.87** 8. HDFC Bank Ltd. 15 16 13 17 24 24 23 18.86 24.77 10.15 3.18* 9. HDFC Ltd. 37 37 35 32 33 30 34 34.00 7.59 -2.58 2.46 10. Wipro Tech. Ltd. 17 16 22 36 20 18 22 21.57 31.42 3.32 0.59 11. ICICI Bank Ltd. 25 27 30 29 28 26 25 27.14 7.19 -0.51 0.35 12. Hindustan Uni. Ltd. 48 42 45 51 44 45 40 45.00 8.11 -1.53 1.02 13. NMDC Ltd. 122 65 56 40 60 46 59 64.00 42.17 -9.52 1.82 14. Indian Oil Corp. Ltd. 84 69 60 56 58 58 59 63.43 15.76 -5.02 2.77* 15. BHEL Ltd. 74 127 62 61 116 53 53 78.00 39.36 -7.30 1.18 16. MMTC Ltd. 161 100 95 73 96 91 129 106.43 27.46 -2.97 0.59 17. Sun Pharma. Ind. Ltd. 33 21 140 68 48 60 60 61.43 62.50 10.61 0.84 18. Tata Motors Ltd. 57 49 47 49 48 58 59 52.43 10.08 1.66 0.85 19. Jindal Steel & Power
Ltd.
38 48 42 68 51 57 57 51.57 19.67 6.47 2.03
20. GAIL India Ltd. 81 91 82 28 38 43 73 62.29 40.49 -8.80 1.12 21. Bajaj Auto Ltd. 44 49 41 49 47 52 51 47.57 8.22 2.53 1.83 22. Hero Motor Corp. Ltd. 10 12 12 60 41 24 21 25.71 72.01 18.87 1.36 23. Mahindra & Mahindra
Ltd.
61 61 60 59 58 58 58 59.29 2.33 -1.02 6.89**
24. Nestle India Ltd. 75 73 65 79 64 65 50 67.29 14.22 -5.09 2.59* 25. Axis Bank Ltd. 36 29 21 17 17 21 20 23.00 30.43 -8.93 2.58* 26. Tata Steel Ltd. 59 50 49 48 47 87 55 56.43 25.06 3.10 0.71
27. SAIL 58 58 55 55 51 46 58 54.43 8.28 -1.91 1.24
28. Sterlite Ind Ltd. 29 75 62 61 33 26 28 44.86 45.46 -9.69 1.32 29. Kotak Mahindra Bank
Ltd.
54 55 68 45 38 51 42 50.43 19.79 -5.17 1.68
30. UltraTech Cement Ltd. 65 53 98 21 22 21 23 43.29 69.42 -20.61 3.02* 31. Asian Paints Ltd. 58 41 41 40 40 39 42 43.00 15.54 -3.83 1.76 32. Bank of Baroda 57 47 50 54 56 55 27 49.43 21.25 -6.27 1.44
33. PNB 84 45 29 48 53 45 50 50.57 32.87 -3.35 0.55
34. Maruti Suzuki India Ltd. 36 48 36 26 24 24 24 31.14 29.63 -10.19 3.67* 35. HCL Tech. Ltd. 74 77 81 50 44 32 56 59.14 31.46 -10.81 2.48 36. Dr. Reddy's Lab Ltd 60 58 36 61 48 50 48 51.57 17.19 -2.39 0.67 37. Cipla Ltd. 119 114 116 112 111 109 106 112.43 3.87 -1.70 7.52** 38. Siemens Ltd. 38 56 55 54 53 56 57 52.71 12.57 4.30 1.81 39. Ambuja Cement Ltd. 31 28 30 33 32 33 35 31.71 7.22 2.74 2.94* 40. Hindalco Ind. Ltd. 30 26 30 29 34 81 91 45.86 60.35 22.69 3.15* 41. Tata Power Co. Ltd. 58 51 60 59 60 61 58 58.14 5.74 1.29 1.15 42. BOSCH Ltd. 71 59 67 74 66 63 64 66.29 7.58 -0.69 0.46 43. ACC Ltd. 32 35 24 32 31 36 35 32.14 12.63 2.10 0.76 44. Grasim Ind. Ltd. 29 28 29 27 25 29 31 28.29 6.68 0.44 0.31 45. Lupin Ltd. 20 28 50 47 39 44 43 38.71 28.05 11.12 2.01 46. Ranbaxy Lab. Ltd. 113 119 110 88 88 86 56 94.29 23.00 -10.09 4.74** 47. Canara Bank 42 42 37 24 32 26 29 33.14 22.20 -7.61 2.72* 48. Bharat Petroleum Cor.
Ltd.
59 50 49 179 54 78 59 75.43 61.89 3.59 0.37
49. Bank of India 30 52 29 28 23 30 29 31.57 29.54 -4.99 1.13 50. Dabur India Ltd. 46 35 28 25 38 30 29 33.00 21.85 -4.83 1.37
Source: Annual Reports of Sampled Companies Note: 1. ** & * means significant at 1% and 5% level of significance respectively.
COMPANY-WISE TIME LAG FROM AUDITOR’S REPORT TO ANNUAL GENERAL MEETING
VOLUME NO. 5 (2015), ISSUE NO. 08 (AUGUST) ISSN 2231-5756
INTERNATIONAL JOURNAL OF RESEARCH IN COMMERCE, IT & MANAGEMENT
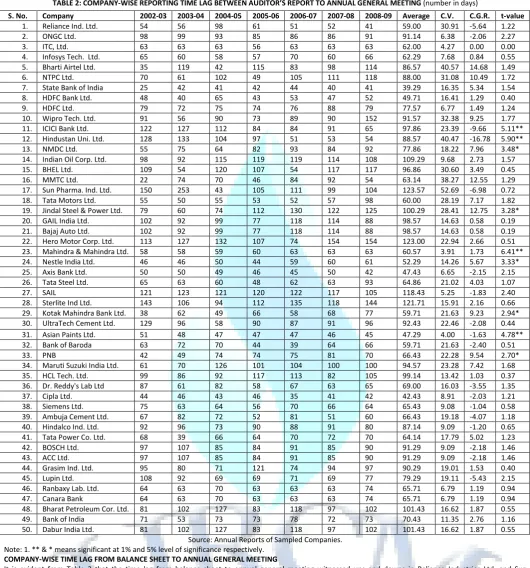
TABLE 2: COMPANY-WISE REPORTING TIME LAG BETWEEN AUDITOR’S REPORT TO ANNUAL GENERAL MEETING (number in days)
Source: Annual Reports of Sampled Companies. Note: 1. ** & * means significant at 1% and 5% level of significance respectively.
COMPANY-WISE TIME LAG FROM BALANCE SHEET TO ANNUAL GENERAL MEETING
It is evident from Table 3 that the time lag from balance sheet to annual general meeting witnessed ups and downs in Reliance Industries Ltd. and Sun Pharmaceuticals Ltd. The time lag from balance sheet to annual general meeting increased significantly only in Jindal Steel & Power Ltd. and Mahindra & Mahindra Ltd. The time lag from balance sheet to annual general meeting declined significantly in State Bank of India, ICICI Bank Ltd. Hindustan Unilever Ltd., BHEL, Axis Bank Ltd., SAIL, UltraTech Cement Ltd., Dr. Reddy Lab Ltd. etc. In the remaining companies, there was either stagnation or ups and downs in time lag from balance sheet to annual general meeting. The declining trend in time lag from balance sheet to annual general meeting in 12 companies is a good sign of reporting company affairs to the stakeholders. But, the companies with increasing time lag should check this trend and the fluctuations need to be curbed in order to get a definite trend in time lag from balance sheet to annual general meeting.
S. No. Company 2002-03 2003-04 2004-05 2005-06 2006-07 2007-08 2008-09 Average C.V. C.G.R. t-value 1. Reliance Ind. Ltd. 54 56 98 61 51 52 41 59.00 30.91 -5.64 1.22
2. ONGC Ltd. 98 99 93 85 86 86 91 91.14 6.38 -2.06 2.27
3. ITC, Ltd. 63 63 63 56 63 63 63 62.00 4.27 0.00 0.00
4. Infosys Tech. Ltd. 65 60 58 57 70 60 66 62.29 7.68 0.84 0.55 5. Bharti Airtel Ltd. 35 119 42 115 83 98 114 86.57 40.57 14.68 1.49 6. NTPC Ltd. 70 61 102 49 105 111 118 88.00 31.08 10.49 1.72 7. State Bank of India 25 42 41 42 44 40 41 39.29 16.35 5.34 1.54 8. HDFC Bank Ltd. 48 40 65 43 53 47 52 49.71 16.41 1.29 0.40
9. HDFC Ltd. 79 72 75 74 76 88 79 77.57 6.77 1.49 1.24
10. Wipro Tech. Ltd. 91 56 90 73 89 90 152 91.57 32.38 9.25 1.77 11. ICICI Bank Ltd. 122 127 112 84 84 91 65 97.86 23.39 -9.66 5.11** 12. Hindustan Uni. Ltd. 128 133 104 97 51 53 54 88.57 40.47 -16.78 5.90** 13. NMDC Ltd. 55 75 64 82 93 84 92 77.86 18.22 7.96 3.48* 14. Indian Oil Corp. Ltd. 98 92 115 119 119 114 108 109.29 9.68 2.73 1.57 15. BHEL Ltd. 109 54 120 107 54 117 117 96.86 30.60 3.49 0.45 16. MMTC Ltd. 22 74 70 46 84 92 54 63.14 38.27 12.55 1.29 17. Sun Pharma. Ind. Ltd. 150 253 43 105 111 99 104 123.57 52.69 -6.98 0.72 18. Tata Motors Ltd. 55 50 55 53 52 57 98 60.00 28.19 7.17 1.82 19. Jindal Steel & Power Ltd. 79 60 74 112 130 122 125 100.29 28.41 12.75 3.28* 20. GAIL India Ltd. 102 92 99 77 118 114 88 98.57 14.63 0.58 0.19 21. Bajaj Auto Ltd. 102 92 99 77 118 114 88 98.57 14.63 0.58 0.19 22. Hero Motor Corp. Ltd. 113 127 132 107 74 154 154 123.00 22.94 2.66 0.51 23. Mahindra & Mahindra Ltd. 58 58 59 60 63 63 63 60.57 3.91 1.73 6.41** 24. Nestle India Ltd. 46 46 50 44 59 60 61 52.29 14.26 5.67 3.33* 25. Axis Bank Ltd. 50 50 49 46 45 50 42 47.43 6.65 -2.15 2.15 26. Tata Steel Ltd. 65 63 60 48 62 63 93 64.86 21.02 4.03 1.07 27. SAIL 121 123 121 120 122 117 105 118.43 5.25 -1.83 2.40 28. Sterlite Ind Ltd. 143 106 94 112 135 118 144 121.71 15.91 2.16 0.66 29. Kotak Mahindra Bank Ltd. 38 62 49 66 58 68 77 59.71 21.63 9.23 2.94* 30. UltraTech Cement Ltd. 129 96 58 90 87 91 96 92.43 22.46 -2.08 0.44 31. Asian Paints Ltd. 51 48 47 47 47 46 45 47.29 4.00 -1.63 4.78** 32. Bank of Baroda 63 72 70 44 39 64 66 59.71 21.63 -2.40 0.51
33. PNB 42 49 74 74 75 81 70 66.43 22.28 9.54 2.70*
VOLUME NO. 5 (2015), ISSUE NO. 08 (AUGUST) ISSN 2231-5756
INTERNATIONAL JOURNAL OF RESEARCH IN COMMERCE, IT & MANAGEMENT
TABLE 3 : COMPANY-WISE REPORTING TIME LAG BETWEEN BALANCE SHEET AND ANNUAL GENERAL MEETING (number of days)
S. No. Company 2002-03 2003-04 2004-05 2005-06 2006-07 2007-08 2008-09 Average C.V. C.G.R. t-value 1. Reliance Ind. Ltd. 77 85 125 88 201 73 231 125.71 51.33 13.18 1.45 2. ONGC Ltd. 182 182 174 172 172 176 176 175.71 2.58 -0.8 2.07 3. ITC, Ltd. 116 121 120 112 119 116 115 117.00 2.70 -0.42 0.81 4. Infosys Tech. Ltd. 75 73 72 71 83 75 81 75.71 6.04 1.54 1.48 5. Bharti Airtel Ltd. 204 142 159 143 110 123 143 146.29 20.49 -5.96 2.14 6. NTPC Ltd. 177 145 176 110 165 170 170 159 15.16 0.47 0.13 7. State Bank of India 115 100 91 91 86 72 71 89.43 17.24 -7.43 9.34** 8. HDFC Bank Ltd. 63 56 78 60 77 71 75 68.57 12.9 3.58 1.54 9. HDFC Ltd. 116 109 110 106 109 118 113 111.57 3.83 0.25 0.32 10. Wipro Tech. Ltd. 108 72 112 109 109 108 174 113.14 26.72 8.23 1.94 11. ICICI Bank Ltd. 147 154 142 113 112 117 90 125 18.52 -7.75 5.19** 12. Hindustan Uni. Ltd. 176 175 149 148 95 98 94 133.57 27.81 -11.72 6.25** 13. NMDC Ltd. 177 140 120 122 153 130 151 141.86 14.27 -1.35 0.49 14. Indian Oil Corp. Ltd. 182 161 175 175 177 172 167 172.71 3.99 -0.41 0.5 15. BHEL Ltd. 183 181 182 168 170 170 170 174.86 3.86 -1.47 3.40* 16. MMTC Ltd. 183 174 165 119 180 183 183 169.57 13.72 0.67 0.21 17. Sun Pharma. Ind. Ltd. 183 274 183 173 159 159 164 185 21.92 -5.41 1.87 18. Tata Motors Ltd. 112 99 102 102 100 115 157 112.43 18.32 4.73 1.69 19. Jindal Steel & Power Ltd. 117 108 116 180 181 179 182 151.86 23.61 10.44 3.62* 20. GAIL India Ltd. 183 183 181 105 156 157 161 160.86 17.11 -2.95 0.80 21. Bajaj Auto Ltd. 117 122 107 106 103 101 107 109 7.01 -2.41 2.73* 22. Hero Motor Corp. Ltd. 123 139 144 167 115 178 175 148.71 16.92 4.86 1.61 23. Mahindra & Mahindra Ltd. 119 119 119 119 121 121 121 119.86 0.89 0.36 3.87* 24. Nestle India Ltd. 121 119 115 123 123 125 111 119.57 4.18 -0.33 0.39 25. Axis Bank Ltd. 86 79 70 63 62 71 62 70.43 13.14 -4.59 3.01* 26. Tata Steel Ltd. 124 113 109 96 109 150 148 121.29 17.02 4.00 1.29 27. SAIL 179 181 176 175 173 163 163 172.86 4.18 -1.80 5.58** 28. Sterlite Ind Ltd. 172 181 156 173 168 144 172 166.57 7.48 -1.36 0.93 29. Kotak Mahindra Bank Ltd. 92 117 117 111 96 119 119 110.14 10.36 2.20 1.06 30. UltraTech Cement Ltd. 194 149 156 111 109 112 119 135.71 23.59 -8.20 3.52* 31. Asian Paints Ltd. 109 89 88 87 87 85 87 90.29 9.24 -2.75 2.24 32. Bank of Baroda 120 119 120 98 95 119 93 109.14 11.92 -3.50 1.86
33. PNB 126 94 103 122 128 12 120 117 11.26 2.37 1.04
34. Maruti Suzuki India Ltd. 97 118 162 127 128 124 124 125.71 15.28 2.17 0.72 35. HCL Tech. Ltd. 173 163 173 167 157 114 161 158.29 12.9 -3.60 1.48 36. Dr. Reddy's Lab Ltd 147 119 118 119 115 113 113 120.57 9.9 -3.23 2.75* 37. Cipla Ltd. 163 160 159 158 146 150 148 154.86 4.32 -1.78 4.53** 38. Siemens Ltd. 113 119 119 110 123 122 121 118.14 4.1 1.03 1.40 39. Ambuja Cement Ltd. 98 110 102 85 113 84 95 98.14 11.46 -1.88 0.86 40. Hindalco Ind. Ltd. 122 122 103 119 122 172 171 133 20.42 6.90 2.39 41. Tata Power Co. Ltd. 126 90 126 123 130 133 128 122.29 11.93 3.12 1.25 42. BOSCH Ltd. 168 166 152 158 157 148 154 157.57 4.6 -1.62 2.74* 43. ACC Ltd. 100 100 102 87 115 98 98 100 8.23 0.07 0.04 44. Grasim Ind. Ltd. 124 108 100 148 99 123 128 118.57 14.78 1.24 0.41 45. Lupin Ltd. 128 120 119 116 110 113 120 118 4.92 -1.39 1.78 46. Ranbaxy Lab. Ltd. 177 182 180 151 151 149 130 160 12.38 -5.22 5.38** 47. Canara Bank 106 105 107 87 95 89 103 96.86 8.51 -2.24 0.66 48. Bharat Petroleum Cor. Ltd. 140 152 176 262 172 175 161 176.86 22.5 2.45 0.60 49. Bank of India 101 105 102 101 101 102 102 102 1.39 -0.14 0.49 50. Dabur India Ltd. 124 97 106 99 104 101 106 105.29 8.49 -1.45 0.96
Source: Annual Reports of Sampled Companies.
Note: 1. ** & * means significant at 1% and 5% level of significance respectively.
CONCLUSION
From the above observations it has been concluded that no definite trend has been found in case of time lag between balance sheet date and auditor’s report date, auditor’s report date and annual general meeting and balance sheet date and annual general meeting. In case of balance sheet and auditor’s report a significant increasing trend has been observed only in seven companies and declining trend in four companies. In the remaining companies, there was either stagnation or fluctuations in time lag from balance sheet and auditor’s report. Moreover, in case of time lag in auditor’s report and annual general meeting majority of the companies witnessed stagnation or fluctuations. This is a matter of serious concern. The time lag from balance sheet and annual meeting increased significantly only in two companies and shows a declining trend in seven companies. In the remaining companies, there was either stagnation or ups and downs.
REFERENCES
1. Ahmad, K. (2003), “The Timeliness of Corporate Reporting: A Comparative Study of South Asia,” Advances in International Accounting, Vol. 16, pp. 17-43. 2. Conover, C., Miller, R., and Szakmary, A. (2008), “The Timeliness of Accounting Disclosure in International Security Markets,” International Review of
Financial Analysis, Vol. 17, No.5, pp. 849-869.
3. Givoly, D. and Palmon, D. (1982), “The Timeliness of Actual Earnings Announcements: Some Empirical Evidences,” The Accounting Review, Vol. 57, No.3, pp. 468-508.
VOLUME NO. 5 (2015), ISSUE NO. 08 (AUGUST) ISSN 2231-5756
INTERNATIONAL JOURNAL OF RESEARCH IN COMMERCE, IT & MANAGEMENT
A STUDY ON WOMEN EMPLOYEE ATTRITION IN IT INDUSTRY WITH SPECIAL REFERENCE TO
TECHNOPARK, THIRUVANANTHAPURAM
DR. R. MOHAN KUMAR
PROFESSOR & HEAD
DEPARTMENT OF MANAGEMENT STUDIES
SRI KRISHNA ENGINEERING COLLEGE
PANNAPAKKAM
A. ASTALIN MELBA
ASST. PROFESSOR
DEPARTMENT OF MANAGEMENT STUDIES
MARIA COLLEGE OF ENGINEERING & TECHNOLOGY
ATTOOR
ABSTRACT
Women employee attrition in IT industry is high nowadays. This article is to find the level of job satisfaction, safety measures, retaining the employees, working conditions & work life balance and the reason for women Employees attrition in IT Industries. The women employee attrition springs up as a vital issue in IT businesses. The researcher had taken 523 respondents as their sample size from universe and descriptive research design was adopted. This research study uses various methods to analyze the reasons and causes for women employee attrition in Technopark, Thiruvananthapuram. The samples were collected through questionnaire with open ended questions. The tools used for analysing the data are Factor analysis. Based on the analysis and interpretation, it is inferred that the IT companies in Technopark has to implement the Retention strategies by compensation Policies, Changes in work Requirements & improvement in working conditions to sustain in the organisation.
KEYWORDS
level of job satisfaction, safety measures, driving forces, retaining the employees.
1. INTRODUCTION
ttrition can be defined as "A reduction in the number of employees through retirement, resignation or death” and also we can say it as” The rate of shrinkage in size or number". The problem taken for this study is Attrition in IT Industry among the women employees of Technopark, Thiruvananthapuram. In India the software and Information Technology are the fastest growing industries. Today, attrition is one of the major problems faced by the HR managers of the IT industry across the globe; the impact of attrition has received considerable attention by management and HR professionals. The IT industry witnessed an average attrition of 17-25 per cent in FY12 while the average attrition across sectors-manufacturing, banking and others-was at about eight per cent. The software industry clocked one of its highest attrition rates in FY11 (Rajesh Kurup, May 2012).Women Employee Attrition is one of the most critical problems which Indian IT industry faces today. Since IT industries are the economic backbone on providing much needed foreign currency inflow to our country, it is the need of the time to improve the level of satisfaction among the women IT employees Married women employees who are working in the night shift face many problems from family, society and even health problem and there is no safety for women an employee working in night shift. The women’s has to get more support from the society and family members to work and to become more dynamic in the society (Dr. Lakshmipathi. C.G 2014).Time to time, employee surveys are done to figure out what makes employees to love or hate their employer. Based on these surveys, IT companies those who want to retain their women employees take appropriate steps with hope of reducing the attrition. Career development’ is a key retention driver, ‘culture’ in addition to compensation keeps people engaged at the lower levels (Rajeswari Sharma, 2012). Providing salary hikes in accordance with industrial standards and recruiting the women those who has long-term orientation towards the organization will reduce the level of attrition (Pooja Wadhwa Saroj Koul, 2012)
This is an interesting fact that some companies are inherently immune to attrition, whereas some companies fail to control attrition despite desperate efforts. It is the most costly and seemingly intractable human resource challenges confronting organizations. Women attrition (or turnover) represents significant costs to most organizations. It is odd, therefore, that many organizations neither measure such costs nor have targets or plans to reduce them. With focus on recruitment, compensation, training & development, supervision and motivation, the research will point out the extent of women employee attrition and its causes in an organization, especially in Technopark, Thiruvananthapuram. The response from the employees will give a true picture of Attrition. Analyzing the respondents’ answers will help in understanding problems from the employees’ view thus will help to develop the current system and making it more effective.
2. STATEMENT OF THE PROBLEM
The quality of work life provides a boost to women employees’ job satisfaction. The basic nature of the work, the freedom at work and could help the employees in being closely associated with the work. The physical environment of work life, enough safety, healthy and working conditions place a true picture in workers instigation of work. A safe and health working condition and better welfare measures are undoubtedly necessary for a fireless and satisfied work performance. Supervisors are the nearer boss to the workers and a good relationship between them is imperative.
3. OBJECTIVES OF THE STUDY
To find out the driving forces of women attrition in the IT companies in Technopark, Thiruvananthapuram To identify the organizational push and pull factors which causes women attrition in Technopark
To study the various effective retention strategies formulated for retaining women employees in IT companies
4. SIGNIFICANCE OF THE STUDY
The quality of work life denotes all the organizational inputs, which aim at the women employee's safety, healthy and working conditions and enhancing organizational effectiveness. This gives more importance on advance technology and high productivity surpassing the needs and mental states of its employees. This created a negative impact on the working environment among the employees. Thus it was realized that communal support goes hand in hand with technical improvements.
VOLUME NO. 5 (2015), ISSUE NO. 08 (AUGUST) ISSN 2231-5756
INTERNATIONAL JOURNAL OF RESEARCH IN COMMERCE, IT & MANAGEMENT
5. METHODS AND MATERIALS
Research methodology is a way to systematically solve the research problems. It includes the overall research design, the sampling procedure, data collection method and analysis procedure. In this study Empirical Research Design is used to identify the Employee Attrition among the women employees working in Technopark, The structured questionnaire for finding women employees attrition were open ended, multiple choice, ranking questions are the types of questions used. The nature of the data is both Primary and Secondary data. The data’s are collected from internet, books and discussion with the women employees. The primary data are collected through questionnaire and direct personal interviews. The secondary data has been collected through oral communication with the employees, Books and company website. Since the population is hypothetical, the researcher applied simple random sampling method to collect the data. The sample size is 523.
The tool used for analysing the data is Cluster analysis & ANOVA. This procedure attempts to identify relatively homogeneous groups of cases based on selected characteristics, using an algorithm that can handle large numbers of cases. However, the algorithm requires specifying the number of clusters. In this study this technique is carried out based on the socio-economic factors and studyfactors of the respondents on the various aspects relating to Level of safety/healthy/and working conditions
A pilot study was conducted by collecting data from 50 women employees working at Technopark using a well structured questionnaire. Reliability analysis was used to determine the extent to which the items in the questionnaire are related to each other, to get an overall index of the repeatability or internal consistency of the scale as a whole, and to identify problem items that should be excluded from the scale. To check the reliability of the questionnaire alpha analysis was used.In this the number items are 78 and the alpha value is 0.907(i.e. 90.7%).Since the reliability is 90.7%, it is concluded that the data’s are more reliable for the study.
Tools used for analysing data are Cluster analysis & ANOVA. The fixed hypothesis states that Socio-economic factorsassociated on the level of perception on safety / healthy / and working conditions related variables don’t influence the clusters.
6. LIMITATIONS OF THE STUDY
Respondents in equal importance from all companies in Technopark with respect to the number of workers in each department cannot be taken due to the non availability, willingness and free time of the skilled workers
Only few determinants of safety, healthy working conditions are taken for the research analysis
7. STATISTICAL ANALYSIS OF THE STUDY
7.1 CLUSTER ANALYSIS1.1 SOCIO-ECONOMIC FACTORS ASSOCIATED TO THE LEVEL OF PERCEPTION ON SAFETY/HEALTHY/AND WORKING CONDITIONS RELATED VARIABLES The Table 1.1 describes the results of iteration history for each classification of socio-economic factors associated on the level of perception on safety, healthy and working conditions related variables considered.
TABLE 1.1.1: ITERATION HISTORY FOR SOCIO-ECONOMIC FACTORS ON PERCEPTION ON SAFETY/HEALTHY/AND WORKING CONDITIONS Iteration Change in Cluster Centers
1 2 3
1 4.62 5.07 6.00 2 0.51 0.11 0.43 3 0.80 0.10 0.41 4 1.19 0.16 0.09 5 1.25 0.38 0.15 6 0.35 0.08 0.51 7 0.25 0.09 0.10 8 0.28 0.11 0.00 9 0.18 0.04 0.29 10 0.06 0.00 0.14
Iterations stopped because the maximum number of iterations was performed. Iterations failed to converge. The maximum absolute coordinate change for any center is 0.059. The current iteration is 10. The minimum distance between initial centers is 10.724.
The Table 1.1.2 describes the results of ANOVA for each socio-economic factorsclassification on the level of perception on safety/healthy/and working conditions variables considered.
VOLUME NO. 5 (2015), ISSUE NO. 08 (AUGUST) ISSN 2231-5756
INTERNATIONAL JOURNAL OF RESEARCH IN COMMERCE, IT & MANAGEMENT
TABLE 1.1.2: DETAILS OF ANALYSIS OF VARIANCE (ANOVA)
Socio-economic factors connecting to the level of perception on safety/healthy/and working conditions F p-value Significant / Not Significant
Age 4.053 0.018 S
Marital status 1.157 0.315 NS
Experience in present job 1.655 0.192 NS
Total years of experience 3.836 0.022 S
Educational Qualification 4.304 0.014 S
Monthly Income 4.667 0.010 S
Nature of organization 1.610 0.201 NS
Total Number of members in family 0.016 0.984 NS
Household composition 6.724 0.001 S
A1 502.258 0.000 S
A2 513.747 0.000 S
A3 111.561 0.000 S
A4 827.456 0.000 S
A5 6.853 0.001 S
A6 356.613 0.000 S
A7 387.292 0.000 S
A8 137.592 0.000 S
A9 362.299 0.000 S
A10 321.679 0.000 S
A11 285.839 0.000 S
A12 193.645 0.000 S
A13 246.234 0.000 S
A14 33.480 0.000 S
A15 42.591 0.000 S
From the above Table 1.1.2, we conclude that the all variables are influence the clusters except few cases in the perception on safety/healthy/and working conditions related variables.
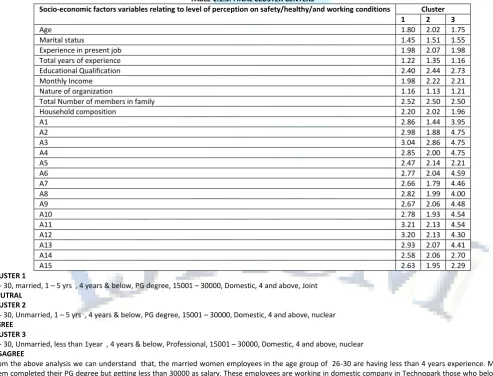
The Table 1.1.3 describes the results of final clusters for each socio-economic factorof respondents on the level of perception on safety/healthy/and working conditions variables considered.
TABLE 1.1.3: FINAL CLUSTER CENTERS
Socio-economic factors variables relating to level of perception on safety/healthy/and working conditions Cluster
1 2 3
Age 1.80 2.02 1.75
Marital status 1.45 1.51 1.55
Experience in present job 1.98 2.07 1.98
Total years of experience 1.22 1.35 1.16
Educational Qualification 2.40 2.44 2.73
Monthly Income 1.98 2.22 2.21
Nature of organization 1.16 1.13 1.21
Total Number of members in family 2.52 2.50 2.50
Household composition 2.20 2.02 1.96
A1 2.86 1.44 3.95
A2 2.98 1.88 4.75
A3 3.04 2.86 4.75
A4 2.85 2.00 4.75
A5 2.47 2.14 2.21
A6 2.77 2.04 4.59
A7 2.66 1.79 4.46
A8 2.82 1.99 4.00
A9 2.67 2.06 4.48
A10 2.78 1.93 4.54
A11 3.21 2.13 4.54
A12 3.20 2.13 4.30
A13 2.93 2.07 4.41
A14 2.58 2.06 2.70
A15 2.63 1.95 2.29
CLUSTER 1
26- 30, married, 1 – 5 yrs , 4 years & below, PG degree, 15001 – 30000, Domestic, 4 and above, Joint NEUTRAL
CLUSTER 2
26- 30, Unmarried, 1 – 5 yrs , 4 years & below, PG degree, 15001 – 30000, Domestic, 4 and above, nuclear AGREE
CLUSTER 3
26- 30, Unmarried, less than 1year , 4 years & below, Professional, 15001 – 30000, Domestic, 4 and above, nuclear DISAGREE
VOLUME NO. 5 (2015), ISSUE NO. 08 (AUGUST) ISSN 2231-5756
INTERNATIONAL JOURNAL OF RESEARCH IN COMMERCE, IT & MANAGEMENT
And in another cluster the women in the age of 26-30 years are unmarried and having the experience less than 4 years. But they are professionals earning less than 30000 per month by working in domestic organizations and they belongs to nuclear family says that the level of perception on safety healthy working conditions provided by the organizations are agreeable.In the final cluster the women in the age of 26-30 years are unmarried and having the experience of less than 1 year are professional qualified earning less than 30000 per month and they are working in domestic organizations belongs to nuclear family says that the level of perception on safety healthy working conditions provided by the organizations are disagreeable.
8. CONCLUSION
It is concluded that the married women working in Technopark are expecting more in regard with safety / healthy/working conditions provided by the organization. In this regards they are not able to give exact opinions due to fear factors or any other personal reasons. At the same time unmarried newly joined women also not at all satisfied with the safety/healthy/working conditions provided by the organization. So from this we can understand, there are lot of organizational factors in relation with safety/healthy/working conditions are need to be improved to retain the women employees in the organization which decrease the rate of attrition of women employees.
REFERENCES
1. Aswathappa, Human Resources and Personnel Management, TATA McGraw Hill, 2003.
2. Chandramohan A and Vasnthikumari K (2006), "Attrition: A Predicament for ITES in India", Journal of Management Matters, Vol. 1, No. 6, pp. 25-31. 3. Deisi Patriota ( June 2009), Employee retention: An integrative view of Supportive Human Resource Practices and Perceived Organizational Support 4. Hari Nair,Nasscom report (2012), Employee Engagement – Scaling Down Attrition
5. Kothari.C.R., Research Methodology, Reprint Edition 2004
6. Narmadha. K (2014),Indian ITES Industry and Employee Attrition –an Overview
7. Pooja Wadhwa Saroj Koul (2012) Critical Factors Affecting Retention: Case of the Indian IT Industry
8. Rajesh Kurup, India Today-May 7, 2012, Attrition dips in IT sector in FY12 following employee retention programmes. 9. Rajeshwari Sharma (2012), Employee retention- Measures and Strategies.
10. Tseng, Chin-Yao and Wallace, Michlelle, Retention of software employees in the IT industry in Taiwan, 2009 WEBSITES
VOLUME NO. 5 (2015), ISSUE NO. 08 (AUGUST) ISSN 2231-5756
INTERNATIONAL JOURNAL OF RESEARCH IN COMMERCE, IT & MANAGEMENT
CUSTOMERS PERCEPTION TOWARDS ELECTRIC TWO WHEELER VEHICLES IN BANGALORE CITY: A STUDY
ON GO GREEN BATTERY OPERATED VEHICLES
SANTHOSH.M
ASSOCIATE PROFESSOR
DEPARTMENT OF MBA
SJB INSTITUTE OF TECHNOLOGY
KENGERI
RAGHAVENDRA.K.A
ASST. PROFESSOR
DEPARTMENT OF MBA,
SJB INSTITUTE OF TECHNOLOGY
KENGERI
ABSTRACT
The study is based on Customers perception towards Electric vehicles (2-wheelers) in Bangalore City with respect to GO Green BOV. The basic objectives of the study are to analyze consumer perception towards Electric two wheelers and develop strategies for improving B2B sales of Electric Two wheelers and to identify the means to enhance the consumer awareness level towards electric vehicles. An Exploratory research was conducted with a sample of 100 respondents conveniently selected from Bangalore City. A structured questionnaire was administered to capture the primary data from the selected respondents. The data was further analyzed using the SPSS package using the Factor analysis, Co-relation, Regression and Cross-tabulation statistical tools. The study revealed that, there is complete lack of awareness about the Electric Bikes even in a city like Bangalore. Most of the respondents are not convinced about the product benefit as they perceive the product to be of Inferior quality and majority of the existing customers are facing problem with after sales servicing and support. The study suggests the company to educate the people about the product and potential benefits. Improve the product quality as well the battery life. The study concludes that that people’s perception about the product is negative but with the support coming forward from the Central govt. and ever increasing prices of petrol, sooner or later the electric bike industry is going to grow drastically
KEYWORDS
awareness, consumer perception, electric vehicles, strategies.
INTRODUCTION
o GreenBOV is the leading manufacturer of Electric two wheeler and three wheeler based out at Bangalore with headquarters in J P Nagar.Go GreenBOV was started in 2007, with an aim to reduce carbon emission and give an eco-friendly environment to the world. Customer base of the company is in entire south at present, but looking for Pan India presence in near future. The parent company of Go GreenBOV ACTD .ACTD was born with a vision to revolutionize policies and create innovative products for the improvement of the sector and the country. Go Green BOV electric two-wheelers are highly advanced with cruise control technology, Theft braking system, Lock braking, International styling, Keyless entry, No number plate, No licensee and a lot of other feature. Go GreenBOV operates throughout Karnataka with a very strong Dealership network. Go Green BOV has the highest number of variants in its product portfolio than any other electric vehicle company in India. Apart from being light on pocket and light on conscience GO Green BOV bikes are easy to use, lightweight and maintenance free providing a stress free experience.
REVIEW OF LITERATURE
Ashish Aggarwal (2014) says that from the research it can concluded that there is strong potential for growth in the electric vehicle industry but it will take some time in India in kickoff because Customers in India are not ready to pay the high price. Also they are very much concerned about the security and quality aspect. Bhupendra Kumar Verma (2011) in his paper sates that on the basis of this study, the following suggestions can be made to help in sales of electric bike more effective. There is need to bring more awareness of various others feature of electric bike brings to a consumer mind by providing them vouchers and literatures in different regional languages. There should be free, fair, justified and honest competition amongst the various electric bike companies. Manufacturer/dealer should be given timely information of the governments Changed policies regarding two wheeler sectors.
Deekshu (2008) found that most of the customers were satisfied with the mileage of the Electric bikes and are convinced about the electric bike benefits and were willing to refer it to their friends. It was found that most of the customers are not satisfied with after sales service. It shows that customers are dissatisfied about after sale service. It was found that maximum number of the customers feel the speed of the Electric bikes to be very low and were not satisfied with the current speed of the bikes. It was found that non-availability of Electric bikes is also a reason for lower market share and consumers not purchasing it.
NEED FOR THE STUDY
The Electric Vehicle (EV) industry is still is nascent stage in India. There is a lot of need to create awareness among the general public to make this alternative model success. While it is for sure that sooner or later the electric vehicle will emerge as a strong component, for the time being there is the need for educating the customers to arouse a need for the product. The objective behind this project is to have a better understanding of the EV market, a SWOT analysis of the EV industry, challenges and opportunities faced by the Industry.
STATEMENT OF THE PROBLEM
A study on Customers perception towards Electric vehicles (2-wheelers) in Bangalore City with respect to GO Green BOV and developing strategies to improve B2B sales of Electric Vehicles.
OBJECTIVES OF THE STUDY
1. To analyze consumer perception towards Electric two wheelers 2. To develop strategies for improving B2B sales of Electric Two wheelers
3. To identify the means to enhance the consumer awareness level towards electric vehicles
VOLUME NO. 5 (2015), ISSUE NO. 08 (AUGUST) ISSN 2231-5756
INTERNATIONAL JOURNAL OF RESEARCH IN COMMERCE, IT & MANAGEMENT
HYPOTHESES
H1: There exists a high degree of co-relation between suggesting an e- bike and convinced with Electric bike
H2: There exist a high degree of co-relation between currently used bikes and how convinced is the person about e-bikes
RESEARCH METHODOLOGY
The success of any event heavily depends upon the way chosen for its execution. This includes ensures of some basic question to the specific focus on constraints as well. In other words they can call the methodology as the backbone of any research. It also includes research or study method. Thus when they talk of methodology they not only talk of methodology they not talk of methods but also consider the logic behind the methods they use in the context of their study objective and explain way use are using them so that Study results are capable of being evaluated logically.
RESEARCH TYPE Exploratory research SAMPLE SIZE 100 SAMPLING AREA Bangalore city SAMPLING TECHNIQUE Convenient sampling DATA COLLECTION TOOLS Structured questionnaire STATISTICAL TOOLS USED
Chi-square Test Co-Relation Factor Analysis STATISTICAL PACKAGE SPSS Package 17.0
RESULTS AND DISCUSSIONS
1. Demographic attributesTABLE 1
Sl no. Attributes No. Of respondents Percentage of respondents 1. Gender Male
Female
35 65
35 65 2. Age 13- 18
19-25 26-40 41-60 Above 60 32 12 24 16 16 32 12 24 16 16 3. Monthly income 10000 – 20000
20000 – 34999 Above 35000 Below 100000 Not applicable 29 42 13 4 12 29 42 13 4 12 4. Occupation Student
Salaried House wife Business others 23 23 21 21 12 23 23 21 21 12 2. How did you come to know about Electric Bikes?
TABLE 2
Frequency Percentage
Friends 20 20
Internet 20 20
News paper/Magazines 28 28
TV 21 21
Others 11 11
3. How will you rate your level of awareness towards Electric Vehicles?
TABLE 3
Frequency Percentage
Poor 19 19
Average 7 7
No option 32 32
Good 18 18
Excellent 24 24 4. Which bike are you using presently?
TABLE 4
VOLUME NO. 5 (2015), ISSUE NO. 08 (AUGUST) ISSN 2231-5756
INTERNATIONAL JOURNAL OF RESEARCH IN COMMERCE, IT & MANAGEMENT
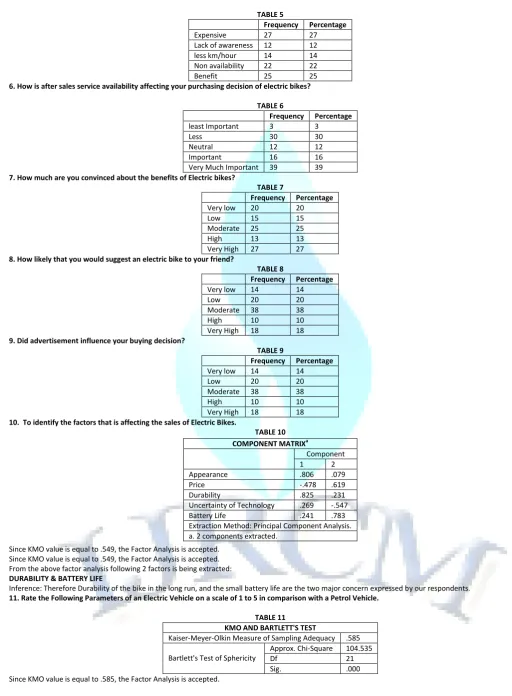
5. Which of the factors do you think that prevents you from making the decision of purchasing the electric bikes?
TABLE 5
Frequency Percentage Expensive 27 27 Lack of awareness 12 12 less km/hour 14 14 Non availability 22 22
Benefit 25 25
6. How is after sales service availability affecting your purchasing decision of electric bikes?
TABLE 6
Frequency Percentage least Important 3 3
Less 30 30
Neutral 12 12
Important 16 16
Very Much Important 39 39 7. How much are you convinced about the benefits of Electric bikes?
TABLE 7
Frequency Percentage Very low 20 20 Low 15 15 Moderate 25 25 High 13 13 Very High 27 27 8. How likely that you would suggest an electric bike to your friend?
TABLE 8
Frequency Percentage Very low 14 14 Low 20 20 Moderate 38 38 High 10 10 Very High 18 18 9. Did advertisement influence your buying decision?
TABLE 9
Frequency Percentage Very low 14 14 Low 20 20 Moderate 38 38 High 10 10 Very High 18 18 10. To identify the factors that is affecting the sales of Electric Bikes.
TABLE 10
Since KMO value is equal to .549, the Factor Analysis is accepted. Since KMO value is equal to .549, the Factor Analysis is accepted. From the above factor analysis following 2 factors is being extracted: DURABILITY & BATTERY LIFE
Inference: Therefore Durability of the bike in the long run, and the small battery life are the two major concern expressed by our respondents. 11. Rate the Following Parameters of an Electric Vehicle on a scale of 1 to 5 in comparison with a Petrol Vehicle.
TABLE 11 KMO AND BARTLETT'S TEST
Kaiser-Meyer-Olkin Measure of Sampling Adequacy .585
Bartlett's Test of Sphericity
Approx. Chi-Square 104.535
Df 21
Sig. .000
Since KMO value is equal to .585, the Factor Analysis is accepted.
COMPONENT MATRIXa
Component 1 2 Appearance .806 .079
Price -.478 .619
VOLUME NO. 5 (2015), ISSUE NO. 08 (AUGUST) ISSN 2231-5756
INTERNATIONAL JOURNAL OF RESEARCH IN COMMERCE, IT & MANAGEMENT
TABLE 12 COMPONENT MATRIXa
Component
1 2
Performance .564 -.356 Mileage / cost per km -.581 .003
Safety -.305 .705
Design .701 .287
Price of the vehicle .606 .218 After sales Service .645 .453 Extraction Method: Principal Component Analysis a. 2 components extracted
From the above factor analysis following 2 factors is being extracted: DESIGN & SAFETY
Inference: Therefore Design of the bike and how safe is it while riding, is the two important factors considered by the respondents while comparing with petrol bike.
12. H1: There exist a high degree of co-relation between suggesting an ebike and convinced with ebike
TABLE 13 CORRELATIONS
How likely that you Would suggest an electric bike to your friend?
How much are you convinced about the benefits of Electric bikes? How likely that you would suggest an
electric bike to your friend?
Pearson Correlation 1 .110
Sig. (2-tailed) .276
N 100 100
How much are you convinced about the benefits of Electric bikes?
Pearson Correlation .110 1
Sig. (2-tailed) .276
N 100 100
Since sig 2 Value 0.276 is greater that .05 (5% level of significance) hence H1 is accepted. From the above data it is evident that, Highly positive Pearson correlation exist between two
variables, when two variables post sales service and responsiveness towards the enquiry in the same direction, the correlation between the two variables is high, if one variable increases by 100, the other variable also increase by 110 according to the results in the table.
13. H2: There exist a high degree of co-relation between currently used bike and how Convinced is the person about e-bikes.
TABLE 14 CORRELATIONS
Which bike are you using presently? How convinced are you about the Electric Bike benefits? Which bike are you using presently? Pearson Correlation 1 .027
Sig. (2-tailed) .792
N 100 100
How convinced are
you about the Electric Bike benefits?
Pearson Correlation .027 1 Sig. (2-tailed) .792
N 100 100
Since sig 2 Value .792 is greater that .05 (5% level of significance) hence H2 is accepted.
From the above data it is evident that, Highly positive Pearson correlation exist between two variables, when two variables post sales service and responsiveness towards the enquiry in the same direction, the correlation between the two variables is high, if one variable increases by 100, the other variable also increases by 127 according to the results in the table.
FINDINGS
There is more no. of petrol vehicles in the market than the Electric ones. Media awareness towa