International Journal of Engineering
J o u r n a l H o m e p a g e : w w w . i j e . i rEffect of Total Solid Content to Biogas Production Rate from Vinasse
Budiyono, I. Syaichurrozi*, S. Sumardiono
Department of Chemical Engineering, University of Diponegoro, Semarang-50275, Indonesia
P A P E R I N F O
Paper history: Received 24 April 2013
Received in revised form 04 June 2013 Accepted 20 June 2013
Keywords:
Anaerobic Biogas COD Kinetic Model Total Solid Vinasse
A B S T R A C T
Vinasse that has high COD and total solid content is bottom product of distillation from unit of bioethanol production. Vinasse treatment using anaerobic digestion produced biogas. The purpose of this research was investigation the effect of total solid content to biogas production rate from vinasse, pH profile and COD removal. This research used anaerobic digester-laboratory scale at room temperature and batch system. Initial pH for all media was adjusted at 7 with the aid of NaOH 10 N solution. The result showed that vinasse:water ratio of 1:3 (TS 7.015±0.007%) produced the most total biogas (37.409 mL/g COD) however vinasse:water ratio of 1:2 (TS 9.310±0.014%) had the biggest COD removal (23.580±0.532%) than others. Variables with TS more than 7.015±0.007% caused the overloading in the digester whereas below of that caused unstable in decomposition process. Total solid that was in high level indicated COD content of substrates in high level. The more of COD concentration of substrates in the digester caused the more of COD removal after fermentation process at anaerobic condition. Vinasse:water of 1:3 that was the best variable in this research had kinetic model of biogas production which was P = 37.485× exp[-exp[((6.665 × e/37.485)/37.485) × (0.959-t)+1]]. Kinetic constants of A (biogas production potential), U (maximum biogas production rate), λ
(minimum time to produce biogas) were 37.485 mL/g COD, 6.665 mL/g COD.day, 0.959 days respectively
doi: 10.5829/idosi.ije.2014.27.02b.02
1. INTRODUCTION1
The rapid growing of population and the development of industrial areas in the world caused increasing trend of energy demand. Fossil fuels such as oil and coal are the main energy sources, but their availability is limited. In addition to non-renewable, use of fossil fuels can reduce the quality of the environment. Burning fossil fuels produces greenhouse gases that cause global warming. These problems can be solved by production of biogas [1-4].
Biogas is the result of fermentation of organic materials under anaerobic condition. Organic materials such as cattle dung, human fesses, straw and husk will be destroyed by anaerobic microorganisms into biogas [5]. The main component of biogas is methane (50-75%) and the remaining is carbon dioxide (25-48%) and small amounts of other gases [6, 7].
Vinasse can be used as feedstock of biogas. Vinasse has COD contents more than 100,000 mg/L [8, 9].
*Corresponding Author Email: [email protected] (I. Syaichurrozi)
Organic materials that have high COD contents can be converted into biogas by microbial activity in the anaerobic digester [10]. From the above information, vinasse can be processed into biogas by using anaerobic digestion.
Vinasse is bottom product of the distillation of the bioethanol production unit. Vinasse has a very high COD, so it cannot be discharged directly into the river [11, 12]. Treatment of vinasse must be done to reduce COD to the extent permitted before it is discharged into the river. Anaerobic treatment is the best choice to treat vinasse because organic materials in the vinasse will be converted into biogas. The biogas thus formed can be used to reduce the need for fossil fuels of bioethanol production unit [13-15]
Espinoza-Escalantea et al. reported that biogas production from vinasse at pH 6.5 was greater than that at pH 4.5 and 5.5 [15]. Buitron and Carjaval noted that vinasse could be optimally converted into biogas at temperature digester of 35oC [14]. Siles et al. stated that ozonation pretreatment could increase the yield coefficient of methane but this process required expensive installation costs [13].
Total solid in vinasse is very high [16]. Zennaki et al. stated that feedstock of biogas with 7-9% solid concentration was best-suited [17]. Budiyono et al. investigated the manure:water ratios to find the best solid concentration in the production of biogas from cow manure [2, 3]. Whereas investigation on the ratio of vinasse:water to find the optimum total solid content to biogas production rate has not yet been studied. This research was focused on investigating the effect of vinase:water ratio against biogas production rate. Furthermore, the data obtained was used to make kinetic model equation of biogas production from vinasse through modified Gomperz equation.
2. MATERIALS AND METHODS
2. 1. Wastewater and Inoculum The wastewater used was vinasse obtained from a bioethanol production. The bioethanol industry located in Solo, Central Java, Indonesia, that produced bioethanol from molasses. Properties of vinasse that was used as biogas feedstock as shown in Table 1.
The rumen fluid was used as inoculum. In this research, rumen fluid that was in fresh condition was obtained from slaughterhouse in Semarang, Central Java, Indonesia.
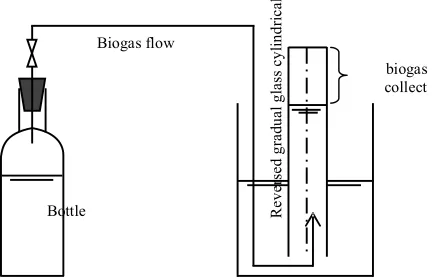
2. 2. Experimental set up Anaerobic digesters were made from polyethylene bottles which have a volume of 5 L. The bottles were plugged with rubber plug and were equipped with valve for biogas measurement. Anaerobic digesters were operated in batch system and at room temperature. Biogas formed was measured by liquid displacement method as also has been used by the other authors [2, 3,[18]. The anaerobic digestion of experimental laboratory set up is shown in Figure 1.
2. 3. Experimental Design
Anaerobic digesters of experimental laboratory using 5 L volume were operated in batch system. Vinasse diluted using tap water with ratio vinasse:water of 1:0, 1:1, 1:2, 1:3, 1;4, 1:5 on the basis of total volume 1 L. pH initial for all variables was adjusted 7.0 by addition of NaOH 10 N. Rumen fluid as methanogenic bacteria provider was added into the digester as much as 10% v/v total volume. Variables in this research are shown in Table 2.
2. 4. Experimental Procedures
Biogas formed was
measured once every two days to know biogas production. pH substrates in the digester were measured by pH meter once every two days to know pH profile daily. COD of initial and final substrates were measured by COD meter.2. 5. Kinetic Model of Biogas Production
Biogas
production kinetic was modeled through modifiedGompertz equation [19]. Kinetic of biogas production in batch condition was assumed that had correspondence to specific growth rate of methanogenic bacteria in digester [3, [20-25]. The modified Gompertz equation as follows:
P = A. exp −exp . (λ −t) + 1 (1)
where P is cumulative of specific biogas production (mL/g COD), A is biogas production potential (mL/g COD), U is maximum biogas production rate (mL/g COD.day), λ is lag phase period or minimum time to produce biogas (days), t is cumulative time for biogas production (days) and e is mathematical constant (2.718282). Kinetic constant of A, λ and U was determined using non-linear regression with help of polymath software [3, 24, 25]
TABLE 1. Vinasse properties
Parameters Values
COD 299,250±1,060
TS 27.865±0.000
VS 284,659±0.000
pH 3.25±0.212
N 1,458±0.000
Remarks: COD, chemical oxygen demand (mg/L); TS, total solid (%); VS, volatile solid (mg/L), pH, power of hydrogen; N, nitrogen content (mg/L).
TABLE 2. Variation of vinasse:water ratio
V:W V (mL) W (mL) R (mL) TS (%)
1:0 1000 0 100 27.910±0.014
1:1 500 500 100 14.005±0.021
1:2 333.3 666.7 100 9.310±0.014
1:3 250 750 100 7.015±0.007
1:4 200 800 100 5.700±0.028
1:5 166.7 833.3 100 4.655±0.021
Remarks: V, vinasse; W, water; R, rumen fluid; TS, total solid (%).
Figure 1. The batch anaerobic digestion of experimental
laboratory set up Biogas flow
R
ev
er
se
d
gr
ad
ua
l g
la
ss
c
yli
nd
ri
cal
Bottle
3. RESULTS AND DISCUSSIONS
3. 1. Biogas Production In anaerobic digestion, organic materials were decomposed by microorganisms through four stages, namely:hydrolysis, acidogenesis, acetogenesis and methanogenesis. The product of the process was biogas.
This research was done to investigate the effect of water addition on total solid (TS %) in the initial substrates. Variation of vinasse:water ratio caused change in solid concentration and COD content of substrates (Table 3).
Putri et al. reported that water molecule was needed to support the hydrolysis reaction at acetogenesis stage. At stage of hydrolysis, hydrolytic microbe degraded complex organic compounds (carbohydrate, protein, fat) into simple organic compounds (glucose, LCVFA, amino acid). At acetogenesis stage, acetogenic bacteria converted ethanol, propionate acid and butyric acid into acetic acid [1].
Sadaka and Engler stated that water made possible the movement and growth bacteria facilitating the dissolution and transport nutrient. Water in the digester reduced limitation of mass transfer of non-homogenous or particulate substrate [26]. Water needed for biogas production from organic wastes that consisted of elements of C, H, O and N. The simple process of formation of biogas was written mathematically [27]: CcHhOoNn + (4c-h-2o+3n)/4 H2O →
(4c+h-2a-3n)/8 CH4 + (4c-h+2a+3n)/8 CO2 + n NH3
(2)
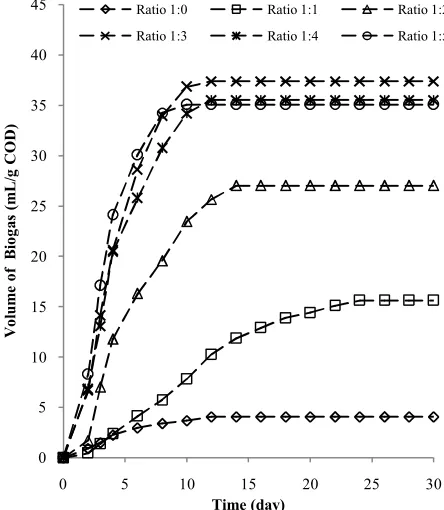
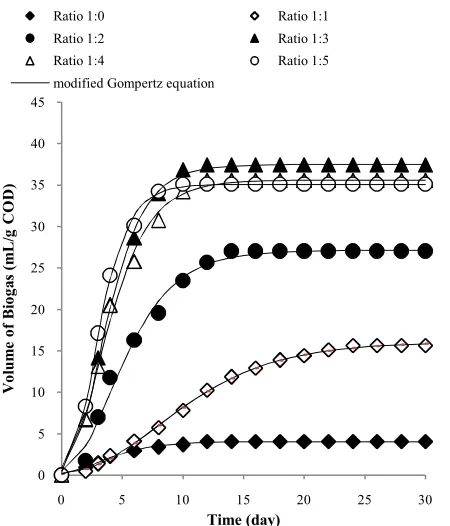
The biogas production rate in variation of vinasse:water is shown in Figure 2. Ratio of vinasse:water variable with comparison 1:0 (R10) had the lowest biogas production rate than other variables. The high ratio of water in the substrate, the biogas production rate was faster. From Figure 2, it was concluded that the order of biogas production rate is: R10<R11<R12<R13. However, R13 had biogas production rate higher than R14 and R15. Biogas began to form on second day for all variables. In variable R10, biogas was produced slowly and ran out at 14th day.
TABLE 3. Effect of vinasse: water to TS and COD
Vinasse: Water TS (%) COD (g)
1:0 27.910±0.014 300.855±1.060
1:1 14.005±0.021 151.230±0.530
1:2 9.310±0.014 101.355±0.354
1:3 7.015±0.007 76.418±0.264
1:4 5.700±0.028 61.455±0.212
1:5 4.655±0.021 51.480±0.177
Remarks: COD, total chemical oxygen demand in the digesters (g); TS, total solid (%)
Figure 2. Effect of vinasse: water ratio to biogas production
rate
Variable R11 had total biogas bigger than R10. In variable R11, biogas formation rate rose slowly until the 12th day, then biogas production was decreasing and was completely discharged at 26th day. In variable R12, biogas production was increasing until the 3rd day, thereafter, biogas production decreasing and ran out at 16th day. In variables R13, R14 and R15, the biogas production rate was very fast, but after 3rd – 5th day, the biogas production was completely discharged at 12 – 16th day (Figure 3(b)). The total biogas formed of R10, R11, R12, R13, R14, R15 was 4.066; 15.643; 27.036; 37.409; 35.553; 35.090 mL/g COD respectively (Figure 2).
Budiyono et al. reported that the ratio cattle manure:water:rumen fluid produced the biggest total biogas which has TS between 7.4 – 9.2% [2]. Budiyono’s result confirmed the report of Zennaki et al. that solids concentration 7 – 9% in the substrate produced biogas optimally [17]. Below total solids level of 7%, process degradation of materials into biogas was unstable while total solids level of 10% caused an overloading of the fermenter [2, 27]
In this research, variable R13 (TS 7.015±0.007%) produced the biggest total biogas and had the fastest biogas production rate. The result of this study was similar with those of the other authors [2, 17, 27]. This research, authors did not use solid waste such as cattle manure but used liquid waste, vinasse. Authors conclude that total solid level of either solid waste or liquid waste need to be considered.
0 5 10 15 20 25 30 35 40 45
0 5 10 15 20 25 30
V
ol
um
e
of
B
iog
as
(
m
L
/g
C
O
D)
Time (day)
Ratio 1:0 Ratio 1:1 Ratio 1:2
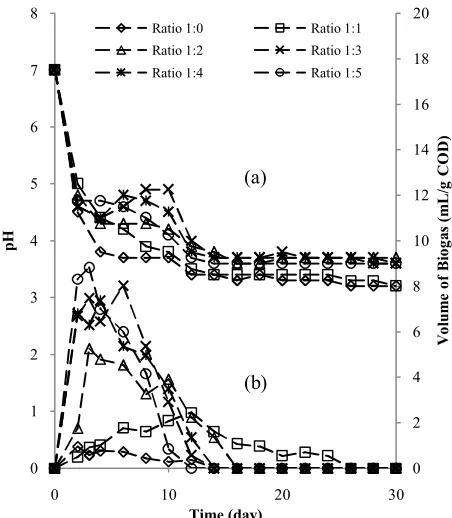
3. 2. pH Profiles In anaerobic digestion, the optimum condition of acidity for biogas production is in the range 6.8 to 8.2. Biogas production rate will decline at pH condition higher or lower than the range [10]. In the early stages of fermentation process, large amounts of organic acid are produced by acid-forming bacteria, so that pH in the digester can reach under 5. Then, the fermentation process continuous and pH value gradually becomes neutral. Decomposition of protein produces NH4-N that makes pH neutral in the digester [28].
Acidogenic bacteria produce acetate, hydrogen gas, carbon dioxide and few other VFA such as propianic and butyric acid. These products make pH drop. A low pH value inhibits the activity of microorganisms that are involved in the biogas production especially methanogenic bacteria [10,[29].
Vinasse contained variety of organic substances such as acetic acid, lactic acid and glycerol [30]. In this research, biogas was formed quickly in the beginning of fermentation, but after 4-12th day (Figure 2 and Figure 3(b)), biogas was decreasing and finally ran out. Acetic acid, lactic acid and glycerol were simple organic compounds which can be easily converted by microorganisms into biogas. The drop in pH decreased biogas production rate (Figure 3). This phenomenon was caused by ratio COD:N of substrate. The good COD:N range to produce biogas optimally is 350:7 – 1000:7 [10]. In this research, vinasse obtained had COD:N ratio = 1436:7.
Carbohydrate-rich substrates were good producers of VFAs and protein-rich substrates were good buffering capacity due to production of ammonia. So, if ratio between carbohydrate (C) and protein (N) are appropriate, biogas will be produced optimally [31].
From Figure 3(a), pH substrates of R10, R11 and R12 always decreased from the beginning until final fermentation. Whereas, pH substrate of R13, R14 and R15 increased from 2 – 4th day until 6 – 8th day, after that pH decreased again till the end of fermentation. This phenomenon indicated that the more water added into the substrate caused reduced concentration of organic compound in the substrate. So, acidogenic bacteria produced VFAs in the optimal amounts and did not disrupt the activity of methanogenic bacteria. Failure process of anaerobic digestion could be due to the unequal population of methanogenic bacteria against acidogenic bacteria that made the state in acidic condition that could hamper the methanogenic growth [28].
3. 3. COD Removal (%)
In anaerobic digestion, organic material that is represented by the COD value will convert into biogas. So, COD of substrate will be decomposed by microorganisms during fermentation process in the digester. The value of percentage of COD decomposition is called COD removal. Speece stated
that 1 gram COD will be destroyed into 0.395 L biogas at 35oC and 1 atm [10].
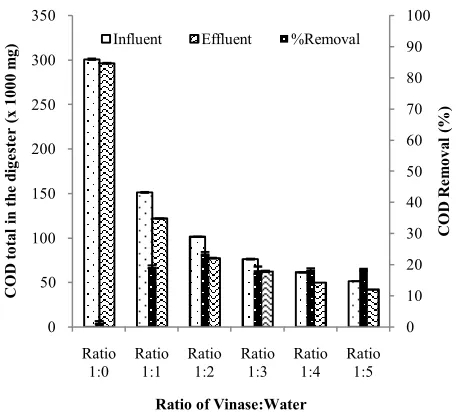
From Figure 4, COD removal of R13 (18.208±1.206%), R14 (18.486±0.324%) and R15 (18.407±0.323%) were less than R12 (23.580±0.532%). This phenomenon indicated that increasing COD concentration in the digester caused increasing COD removal. The results of this research similar with Soeprijanto et al. that COD of vinasse 15,000 mg/L had COD removal that was bigger than 5,000 mg/L and 10,000 mg/L when it treated in the anaerobic digestion [32]. However, R12 produced biogas that was less than R13, R14 and R15. This was caused by activity of acidogenic and methanogenic bacteria. The more organic compounds entered into digesters caused the faster acidogenic bacteria growth rate. Organic compounds will be converted into fatty acid and it caused pH to decrease. Whereas, methanogenic bacteria could not grow well at low pH. This condition caused biogas production low although COD removal was big. This phenomenon could be concluded that the fermentation process was dominated by acidogenesis process and activity of methanogenic bacteria did not grow well in the system (Figure 3).
On the other hand, COD removal of R10 (1.456±0.427%) was less than R11 (19.367±0.436%) and R11 was less than R12 (23.580±0.532%) although COD concentration of R10 was bigger than R11 and R11 was bigger than R12 (Figure 4).
Figure 3. Effect of vinasse :water variation to (a) pH profiles,
(b) volume biogas daily
0 2 4 6 8 10 12 14 16 18 20
0 1 2 3 4 5 6 7 8
0 10 20 30
V
ol
um
e
of
B
iog
as
(
m
L
/g
C
O
D)
pH
Time (day)
Ratio 1:0 Ratio 1:1
Ratio 1:2 Ratio 1:3
Ratio 1:4 Ratio 1:5
(a)
Figure 4. Effect of vinasse:water variation to COD removal
TABLE 4. Kinetic constant of biogas production
V:W Biogas (exp) Modified Gompertz (Model)
A U λ R2
1:0 4.066 4.066 0.592 0.423 0.996
1:1 15.643 16.141 1.106 2.547 0.998
1:2 27.036 27.146 3.428 1.116 0.993
1:3 37.407 37.485 6.665 0.959 0.999
1:4 35.553 35.591 5.703 0.716 0.996
1:5 35.090 35.091 8.104 0.930 0.998
Remarks: V, vinasse; W, water; exp, experimental data (total volume of biogas (mL/g COD)); A, biogas production potential (mL/g COD); U, maximum biogas
production rate (mL/g COD.day); λ, minimum time to produce biogas (days);
R2, correlation coefficient.
In theory, if COD concentration was bigger, COD removal would be higher, but this theory did not apply for relationship of R10, R11 and R12. Organic compound of R10 and R11 was too high so microorganisms have difficulty in degrading organic compound into biogas. Besides that, too much organic materials of vinasse in the digester caused pH to drop easily (Figure 3(b)). The very low pH not only inhibited the activity of methane-forming bacteria, but also activity of acid-forming bacteria themselves; so COD removal of R10 and R11 was less than R12 although their organic compound was bigger. The bigger COD value indicated the bigger solid concentration of the substrate. Variables R10 and R11 had total solid in the substrate, which were 27.910±0.141 and 14.005±0.021 % respectively (Table 3). Total solids level more than 10% caused an overloading of the fermenter [2, 27].
3. 4. Kinetic Model of Biogas Production Biogas production rate for all variables was modeled based on modified Gompertz equation. Kinetic constant of A, U and λ was determined by using non-linear regression. Kinetic constants obtained were presented completely in Table 4. By plotting experimental data and simulation of modified Gompertz equation the graph shown in Figure 5 was obtained.
Table 4 shows the difference in the vinase:water ratio affected value of kinetic constant. Variable R10 had the lowest values of A and U which were 4.066 mL/g COD and 0.592 mL/g COD.day respectively. That means variable R10 in prediction generated little amount of biogas. Meanwhile, variable R13 had the highest values of A and U which were 37.485 mL/g COD and 6.665 mL/g COD.day. Variable R13 not only had high value of A and U, but also had low value of λ. Budiyono et al. stated that variable that had little value of kinetic constant of λ, needed just little time to produce biogas [3]. Zwietering et al. reported that value of λ indicated the time that was required for bacteria to adapt [19]. Based on that, bacteria in variable R13 needed just little time to adapt and produce biogas which was 0.959 days.
Value of kinetic constants from this research and other researches is shown in Table 5. Kinetic constant of λ of this research was smaller than that of others. Biogas was generated after 0.959 days of fermentation, while in others, that needed between 1.2 to 8.5 days. Vinasse contained a lot of simple organic material such as acetic acid, lactic acid and glycerol [30], so that bacteria could easily degrade them into biogas. Budiyono et al. reported that the production of biogas using animal manure as feedstock took a long time because it contained lignocellulosic that was difficult to be degraded [2]. Bacteria needed more time to adapt in media of animal manure than in media of vinasse. Bacterial activity in animal manure [3, 21, 24, 25] required more time than in vinasse to produce biogas firstly (Table 5). Kinetic constant of A of this research was smaller than that of others. Animal manure did not contain toxic organic compound such as phenolic compounds that disturbed bacterial activity. Meanwhile, vinasse contained high phenolic compounds [11, [33]. Phenolic compounds were very difficult to be degraded through biological processes and had phytotoxic that was antimicrobial property. Phenolic compounds inhibited and killed bacteria by ways of: a) reacted with cell membrane, b) inactivated essential enzymes, c) inactivated the function of genetic materials [34]. Based on that, could be concluded that the phenolic compounds caused the biogas formed potentially in little amount.
According to Garcia-Garcia et al. [11], aerobic biological pretreatment using fungal species (Aspergillus terreus and Geotrichum condidun) could reduce phenolic contents in vinasse.
0 10 20 30 40 50 60 70 80 90 100
0 50 100 150 200 250 300 350
Ratio
1:0 Ratio 1:1 Ratio 1:2 Ratio 1:3 Ratio 1:4 Ratio 1:5
C
O
D
R
em
ov
al
(
%)
C
O
D
to
ta
l
in
t
he
d
ig
es
ter
(
x
1000
m
g)
Ratio of Vinase:Water
TABLE 5. Comparison kinetic constant in several researches
Feedstock A (mL/g VS) U (mL/g VS.day) λ (days) R2 Author
Vinasse (conv) 39.406 7.007 0.959 0.999 This research
Cattle manure 418.260 9.490 4.460 - [3]
Municipal solid waste 522 97 1.2 0.983 [21]
Water Hyacinth 449.4 27.9 6.625 0.981 [24]
Poultry Litter 390.4 16.5 8.749 0.999 [25]
Remarks: conv, conversion based on Table 1. (COD/VS = 299,250/284,659 = 1.051; so COD = 1.051*VS)
Figure 5. Comparison of experimental data and modified
Gompertz model
4. CONCLUTION
Vinasse treatment using anaerobic digestion converted organic compounds into biogas. Vinasse:water ratio of 1:3 (TS 7.015±0.007%) produced the most biogas and had the fastest biogas production rate than others. The percentage of COD removal with vinasse:water ratio of 1:2 was higher than ratio of 1:3. This phenomenon was caused by the desired concentration of organic compound and activity of microorganisms in the digester. Kinetic model of biogas production was obtained by using modified Gompertz equation. Vinasse:water ratio of 1:3 that was the best ratio had desired kinetic constants i.e. biogas production potential (A), maximum biogas production rate (U) and minimum time to produce biogas (λ) were 37.485 mL/g COD,
6.665 mL/g COD.day, 0.959 days respectively. The value of λ, A and U in this research was lower than other researches. That was caused by difference in organic matter used as feedstock. Characteristic of vinasse was different from animal manure.
5. ACKNOWLEDGMENTS
The authors thank the Indonesian Ministry of Higher Education via Hibah Kompetensi 2013 grant for financial support.
6. REFERENCES
1. Artanti, D., Saputro, R. R. and Budiyono, B., "Biogas production from cow manure", International Journal of Renewable
Energy Development (IJRED), Vol. 1, No. 2, (2012), 61-64.
2. Budiyono, W., I.N., Johari, S. and Sunarso, "Increasing biogas production rate from cattle manure using rumen fluid as inoculums", International Journal of Basic & Applied Sciences
IJBAS-IJENS, Vol. 10, No., (2010), 68-75.
3. I Nyoman, W. and Seno, J., "The kinetic of biogas production rate from cattle manure in batch mode", International Journal
of Chemical and Biological Engineering, Vol. 3, No. 1,
(2010), 39-45.
4. Brown, D., Shi, J. and Li, Y., "Comparison of solid-state to liquid anaerobic digestion of lignocellulosic feedstocks for biogas production", Bioresource Technology, (2012).
5. Hambali, E., Mujdalifah, S., Tambunan, A. H., Pattiwiri, A. W. and Hendroko, R., "Teknologi bioenergi", AgroMedia, (2007). 6. Juanga, J. P., Visvanathan, C. and Tränkler, J., "Optimization of
anaerobic digestion of municipal solid waste in combined process and sequential staging", Waste Management &
Research, Vol. 25, No. 1, (2007), 30-38.
7. Karellas, S., Boukis, I. and Kontopoulos, G., "Development of an investment decision tool for biogas production from agricultural waste", Renewable and Sustainable Energy
Reviews, Vol. 14, No. 4, (2010), 1273-1282.
8. Lutoslawski, K., Ryznar-Luty, A., Cibis, E., Krzywonos, M. and Miskiewicz, T., "Biodegradation of beet molasses vinasse by a mixed culture of micro organisms: Effect of aeration conditions and ph control", Journal of Environmental Sciences, Vol. 23, No. 11, (2011), 1823-1830.
9. Robles-Gonzalez, V., Lopez-Lopez, E., Martinez-Jeronimo, F., Ortega-Clemente, A., Ruiz-Ordaz, N., Galindez-Mayer, J., Rinderknecht-Seijas, N., and Poggi-Varaldo, H. M., “Combined
0 5 10 15 20 25 30 35 40 45
0 5 10 15 20 25 30
V
ol
um
e
of
B
iog
as
(
m
L
/g
C
O
D)
Time (day)
Ratio 1:0 Ratio 1:1
Ratio 1:2 Ratio 1:3
Ratio 1:4 Ratio 1:5
treatment of mezcal vinasses by ozonation and aerobic biological post-treatment, in 14th International Biotechnology Symposium. Rimini, Italy. (2010)
10. Speece, R. E., "Anaerobic technology for industrial wastewaters", USA, Archae Press, (1996).
11. García, I. G., Venceslada, J., Peña, P. and Gómez, E. R., "Biodegradation of phenol compounds in vinasse using aspergillus terreus and geotrichum candidum", Water Research, Vol. 31, No. 8, (1997), 2005-2011.
12. Zayas, T., Rómero, V., Salgado, L., Meraz, M. and Morales, U., "Applicability of coagulation/flocculation and electrochemical processes to the purification of biologically treated vinasse effluent", Separation and Purification Technology, Vol. 57, No. 2, (2007), 270-276.
13. Siles, J., García-García, I., Martín, A. and Martín, M., "Integrated ozonation and biomethanization treatments of vinasse derived from ethanol manufacturing", Journal of
Hazardous Materials, Vol. 188, No. 1, (2011), 247-253.
14. Buitrón, G. and Carvajal, C., "Biohydrogen production from tequila vinasses in an anaerobic sequencing batch reactor: Effect of initial substrate concentration, temperature and hydraulic retention time", Bioresource Technology, Vol. 101, No. 23, (2010), 9071-9077.
15. Espinoza-Escalante, F. M., Pelayo-Ortíz, C., Navarro-Corona, J., González-García, Y., Bories, A., and Gutiérrez-Pulido, H., "Anaerobic digestion of the vinasses from the fermentation of agave tequilana weber to tequila: The effect of ph, temperature and hydraulic retention time on the production of hydrogen and methane", Biomass and Bioenergy, Vol. 33, No. 1, (2009), 14-20.
16. Robles-González, V., Galíndez-Mayer, J., Rinderknecht-Seijas, N. and Poggi-Varaldo, H. M., "Treatment of mezcal vinasses: A review", Journal of Biotechnology, Vol. 157, No. 4, (2012), 524-546.
17. Zennaki, B. Z., Zadi , A., Lamini, H., Aubinear, M. and Boulif, M., "Methane fermentation of cattle manure: Effects of hrt, temperature & substrate concentration", Tropicul Tural, Vol. 14, (1996), 134-140.
18. Pahl, O., Firth, A., MacLeod, I. and Baird, J., "Anaerobic co-digestion of mechanically biologically treated municipal waste with primary sewage sludge–a feasibility study", Bioresource
Technology, Vol. 99, No. 9, (2008), 3354-3364.
19. Zwietering, M., Jongenburger, I., Rombouts, F. and Van't Riet, K., "Modeling of the bacterial growth curve", Applied and
environmental microbiology, Vol. 56, No. 6, (1990),
1875-1881.
20. Yusuf, M., Debora, A. and Ogheneruona, D., "Ambient temperature kinetic assessment of biogas production from co-digestion of horse and cow dung", Research in Agricultural
Engineering, Vol. 57, No. 3, (2011), 97-104.
21. Zhu, B., Gikas, P., Zhang, R., Lord, J., Jenkins, B., and Li, X., "Characteristics and biogas production potential of municipal
solid wastes pretreated with a rotary drum reactor", Bioresource
Technology, Vol. 100, No. 3, (2009), 1122-1129.
22. Elaiyaraju, P. and Partha, N., "Biogas production from co-digestion of orange peel waste and jatropha de-oiled cake in an anaerobic batch reactor", African Journal of Biotechnology, Vol. 11, No. 14, (2012), 3339-3345.
23. Du Shin, J., Eom, K. C. and Park, S. W., "Predicting methane production potential of anaerobic co-digestion of swine manure and food waste", Environmental Engineering Research (EER), Vol. 13, No. 2, (2008), 93-97.
24. Patil, J. H., Raj, M. A., Muralidhara, P., Desai, S. and Raju, G. M., "Kinetics of anaerobic digestion of water hyacinth using poultry litter as inoculum", International Journal of
Environmental Science and Development, Vol. 3, No. 2,
(2012), 94-98.
25. Adiga, S., Ramya, R., Shankar, B., Patil, J. H. and Geetha, C., "Kinetics of anaerobic digestion of water hyacinth, poultry litter, cow manure and primary sludge: A comparative study", International Proceedings of Chemical, Biological and
Environmental Engineering (IPCBEE), Vol. 42, (2012),
73-78.
26. Sadaka, S. S. and Engler, C. R., "Effects of initial total solids on composting of raw manure with biogas recovery", Compost Science & Utilization, Vol. 11, No. 4, (2003), 361-369. 27. Baserja, U., "Biogas production from cowdung: Influence of
time and fresh liquid manure", Swiss-Bio Tech, Vol. 2, No., (1984), 19-24.
28. Wahyuni, S., "Biogas", Penebar Swadaya, Jakarta, (2010). 29. Vicenta, M. P. G., "Alamis mla, anglo pg, tan bv and silverio
cm, a study of some factors affecting biogas production from pineapple peelings", in Proceeding of the Second ASEAN Workshop on Biogas Technology Applied in the Management and Utilization of Food Waste Materials., 189-202.
30. Yavuz, Y., "Ec and ef processes for the treatment of alcohol distillery wastewater", Separation and Purification
Technology, Vol. 53, No. 1, (2007), 135-140.
31. Mata-Alvarez, J., Mace, S. and Llabres, P., "Anaerobic digestion of organic solid wastes. An overview of research achievements and perspectives", Bioresource Technology, Vol. 74, No. 1, (2000), 3-16.
32. Soeprijanto Ismail, T., Lastuti, M. D. and Niken, B., "Treatment of vinasse from alcohol industry wastewater into biogas using upflow anaerobic sludge blanket (uasb) bioreactor", Jurnal Purifikasi,, Vol. 11, (2010), 11 - 20.
33. Martın, M., Raposo, F., Borja, R. and Martın, A., "Kinetic study of the anaerobic digestion of vinasse pretreated with ozone, ozone plus ultraviolet light, and ozone plus ultraviolet light in the presence of titanium dioxide", Process Biochemistry, Vol. 37, No. 7, (2002), 699-706.
34. Brannen, A. L. and Davidson, P. M., "Antimicrobial in foods", ed. edition, n., New York, Marcel Dekker, (1993).
Effect of Total Solid Content to Biogas Production Rate from Vinasse
Budiyono, I. Syaichurrozi, S. Sumardiono
Department of Chemical Engineering, University of Diponegoro, Semarang-50275, Indonesia
P A P E R I N F O
Paper history: Received 24 April 2013
Received in revised form 04 June 2013 Accepted 20 June 2013
Keywords: Keywords: Anaerobic Biogas COD Kinetic Model Total Solid Vinasse هﺪﯿﮑﭼ Vinasse ﺎﺑ COD ﻻﺎﺑ و ﺪﺻرد ﺪﻣﺎﺟ ﻞﮐ ، لﻮﺼﺤﻣ ﻄﻘﺗ ﯿﺮ ﯽﻨﯿﺳ ﺮﯾزيﺎﻫ ﯾ ﻦ ﺪﺣاو يﺎﻫ ﻟﻮﺗ ﯿﺪ لﻮﻧﺎﺗا زﯾ ﺘﺴ ﯽ ﺖﺳا . هدﺎﻔﺘﺳا زا ﻢﻀﻫ ﺑ ﯽ زاﻮﻫ ي Vinasse ﺑﯿ زﺎﮔﻮ ﻟﻮﺗ ﯿﺪ ﻣ ﯽ ﺪﻨﮐ . رد اﯾ ﻦ ﻘﺤﺗ ﯿ ﻖ ﻘﻣ ﯿ سﺎ ﺎﻣزآ ﯾ ﻫﺎﮕﺸ ﯽ ، ﻢﺿﺎﻫ ﺎﻫ ي ﺑ ﯽ زاﻮﻫ ي رد ﺎﻣد ي قﺎﺗا و ﺳ ﯿ ﻢﺘﺴ ﺎﻫ ي ﻪﺘﺳﻮﯿﭘﺎﻧ ﯽﻣﯽﺳرﺮﺑ دﻮﺷ . فﺪﻫ زا اﯾ ﻦ ﺶﻫوﮋﭘ ﻦﯿﯿﻌﺗ ﺮﺛا راﺪﻘﻣ هدﺎﻣ ﺪﻣﺎﺟ ﻞﮐ ﻪﺑ ﻣﯿ ناﺰ ﻟﻮﺗ ﯿﺪ ﺑﯿ زﺎﮔﻮ زا vinasse ، تﺎﺼﺨﺸﻣ pH و فﺬﺣ COD ﺖﺳا . pH ﻟوا ﯿﻪ اﺮﺑ ي ﻪﻤﻫ ﻪﻧﺎﺳر ﺎﻫ ﺎﺑ ﮏﻤﮐ لﻮﻠﺤﻣ دﻮﺳ N 10 رد 7 ﻈﻨﺗ ﯿﻢ ﺪﺷ . ﺘﻧﯿ ﻪﺠ نﺎﺸﻧ داد ﻪﮐ ﺖﺒﺴﻧ vinasse ﻪﺑ بآ 1:3 ) 0.007 ٪ رد TS 015 /7 ± ( راﺪﻘﻣﻦﯾﺮﺘﺸﯿﺑ ﺑﯿ زﺎﮔﻮ ) 409 / 37 ﻣﯿ ﻠ ﯽ ﻟﯿ ﺮﺘ / مﺮﮔ COD (
ﯽﻣﺪﯿﻟﻮﺗار ﺪﻨﮐ . ﺎﺑ اﯾ ﻦ لﺎﺣ ﺖﺒﺴﻧ vinasse ﻪﺑ بآ 1:2 ) 0.014 ٪ رد TS 310 /9 ± ( ﺮﺘﮔرﺰﺑ ﯾ ﻦ فﺬﺣ COD ) 532 /0 ± 580 / 23 ٪ (
ﺎﺑﻪﺴﯾﺎﻘﻣرد دﯾ ناﺮﮕ ﺖﺳا . ﻪﻨﯾﺰﮔ ﺎﻫ ﺎﺑ TS ﺑﯿ ﺶ زا 0.007 ٪ ± 7.015 ﺚﻋﺎﺑ يرﺎﺑاﺮﻓ ﻢﺿﺎﻫ ﯽﻣ ،دﻮﺷ رد ﻟﺎﺣ ﯽ ﻪﮐ رد زﯾ ﺮ راﺪﻘﻣﻦﯾا اﺮﻓ ﯾ ﺪﻨ ﺰﺠﺗ ﯾﻪ ﺎﭘﺎﻧ ﯾ راﺪ ﯽﻣ دﻮﺷ . عﻮﻤﺠﻣ ﺪﻣﺎﺟ ﻪﮐ رد ﺢﻄﺳ ﻻﺎﺑ دﻮﺑ نﺎﺸﻧ داد ﻪﮐ راﺪﻘﻣ COD ﺎﻫﺮﺘﺴﺑ رد ﺢﻄﺳ ﻻﺎﺑ ﺪﻧدﻮﺑ . ﺖﻈﻠﻏ ﺑﯿ ﺮﺘﺸ COD رد ﺎﻫﺮﺘﺴﺑ ي ﻢﺿﺎﻫ ﺚﻋﺎﺑ فﺬﺣ ﺑﯿ ﺮﺘﺸ COD ﺲﭘ زا آﺮﻓ ﯾ ﺪﻨ ﻤﺨﺗ ﯿﺮ رد اﺮﺷ ﯾ ﻂ ﺑ ﯽ زاﻮﻫ ي ﻣ ﯽ دﻮﺷ . ﺖﺒﺴﻧ Vinasse : بآ زا 1:03 ﻪﮐ ﺮﺘﻬﺑ ﯾ ﻦ ﻪﻨﯾﺰﮔ رد اﯾ ﻦ ﻘﺤﺗ ﯿ ﻖ لﺪﻣ ﯽﮑﯿﻣﺎﻨﯾد ﻟﻮﺗ ﯿﺪ ﺑﯿ زﺎﮔﻮ دﻮﺑ ، × ]
-P = 37.485EX-P [((6.665 × e/37.485) / 37.485) × (0.959-T) + 1
[[
ﺪﻣآﺖﺳدﻪﺑ
. ﺖﺑﺎﺛ ﺸﺒﻨﺟ ﯽ ) ﺴﻧﺎﺘﭘ ﯿ ﻞ ﻟﻮﺗ ﯿﺪ ﺑﯿ زﺎﮔﻮ ( ، U ) ﺮﺜﮐاﺪﺣ خﺮﻧ ﻟﻮﺗ ﯿﺪ ﺑﯿ زﺎﮔﻮ ( ، λ ) ﻞﻗاﺪﺣ نﺎﻣز اﺮﺑ ي ﻟﻮﺗ ﯿﺪ ﺑﯿ زﺎﮔﻮ ( ﺐﯿﺗﺮﺗﻪﺑ mL / g 485 / 37 COD ، mL / g
665 /6 –COD وزور 959 /0 زور دﻮﺑ
doi: 10.5829/idosi.ije.2014.27.02b.02