STRATEGIC GLOBAL LOGISTICS MANAGEMENT FOR SOURCING ROAD OIL
IN THE U.S.
Raj Bridgelall,
(PhD)North Dakota State University, North Dakota, USA
EunSu Lee,
(PhD, CPIM, CSCP, GISP)New Jersey City University, Jersey City, New Jersey, USA
Michael Bell,
(JD)New Jersey City University, Jersey City, New Jersey, USA Received: Oct. 28, 2017 Accepted: Dec. 06, 2017 Published: Dec. 07, 2017
Abstract
:The demand for asphalt and road oil heavily leverages local supply because the product is a hot binder of aggregates that form the final mix needed to pave roads. This paper discusses the supply chain characteristics of crude oil feedstock by considering the overall logistics of sourcing heavy crude oil domestically, or importing it from international trading partners. Heavy crude oil is a source of asphalt and road oil production. The study examines critical global and domestic logistics factors such as customs, regulations, security, environmental compliance, and natural events that will affect costs, schedules, and risks. The study provides a framework for decision-making in sourcing the feedstock. The study helps global logisticians and transportation managers improve strategic design and planning towards efficient sourcing.
Keywords:
Asphalt, Road Oil, Bitumen, Energy Supply Chain
1.
Introduction
With a renewed focus on infrastructure revitalization and expansion to spur domestic job creation and economic growth, crude oil refineries in the U.S. are expecting a growing demand for asphalt and road oil (U.S. Department of Transportation, 2017). This expectation prompts an investigation into feedstock import options. The anticipated increase in demand could result in decisions to boost production in the midst of a feedstock supply scarcity. As expected, the price of asphalt increases sharply when supply does not keep up with demand (Tyler Rhodes, 2005). For the past decade, U.S. refineries have been upgrading their capacity to process more of the residuum from conventional crude oil distillation to meet growing demands for lighter, higher-value transportation fuel such as gasoline, diesel, and jet fuel (Platts, 2012). The application of cokers has been a popular means of upgrading capacity. This technology produces more heat to further break down more than 80% of the residual asphalt and road oil, thereby producing greater yields of the lighter products. Consequently, refineries have been producing less asphalt from the residuals.
2. Supply Chain Characteristics
Supply chain design varies depending on the characteristics of a product (commodity), price, demand and supply, transportation network, including transportation modes and infrastructure capacity (Bridgelall, et al., 2016). This section discusses the components of the supply chain. On a global scale, a natural resource scarcity has the greatest impact on commercial activities (Bell, et al., 2012).
2.1. Commodity
Asphalt and road oil are hydrocarbons composed of approximately 80% carbon and 15% hydrogen. The remaining 5% of material consists of oxygen, sulfur, nitrogen, and traces of various metals. Asphalt is insoluble in water and is a natural byproduct of organic material from bacterial decomposition. It is found in large deposits as ‘tar lakes’ and ‘tar sands’ as well as in crude oil. The asphalt content in crude oil varies with its specific gravity. The American Petroleum Institute (API) developed a measure of the specific gravity of oil in units of API degrees (Schenk, et al., 2006). The product will float on water if the API is greater than 10°, otherwise it will sink. Higher API values represent less dense oils that yield greater volumes of lighter, higher-value products for the same amount of processing. The industry classifies oil with API gravity less than 10° as asphalt, 10° to 20° as heavy crude and above 33° as light crude. Conventional oil has low viscosity. Table 1 summarizes the API gravity and asphalt yield expected from each import source of the heaviest oils available in the Western Hemisphere. The analysis accounts for asphalt and road oil yield differences by adjusting the number of barrels needed to produce the same amount of asphalt.
Table 1. Crude Oil Classification
Deposit Name Port of Sale API Gravity Average (oAPI)
Yield of Asphalt and Road Oil (%)
North Dakota Sweet
(NDS)-Bakken U.S. 40-43* 8.27***
Western Texas Intermediate
(WTI) Cushing, Oklahoma 39.6 (37-42)* 3.0
Cold Lake blend (Canada) Edmonton, Canada 22.0 33.6
Maya-Mexico Cayo Arcas, Mexico 21.8 33.4
Boscan-Venezuela Bajo Grande,
Venezuela 10.1 70.0
Western Canada Select (WCS) Hardisty, Canada 21.3* 33.9
Note: MMBO: million barrels of oil; Source of *: (Turner, Mason & Company Consulting Engineering, 2014); Source of **: (Environmental Canada, 2017); *** average between 1993 and 2016 (U.S. Energy Information Administration, 2017).
North Dakota Sweet (NDS) can flow under high pressure and is somewhat lighter than the mainstream type such as Western Texas Intermediate (WTI). While both NDS and WTI produce relatively low asphalt and road oil yields, hydrocarbons extracted from the Canadian oil sands produce greater yields of asphalt and road oil. Sands mined from the first 250 feet below the surface will release hydrocarbon molecules when mixed with hot water.
2.2. Price
Figure 1 summarizes the average annual landed cost per barrel of crude oil from selected countries in America and outside of the continental U.S. U.S. refineries paid less for crude oil from sources in the Americas than from sources in the Middle East. The figure compares the average annual landed cost per barrel for crude oil from the three largest oil-producing nations in the Americas (Venezuela, Mexico, and Canada) with that of the largest oil producing regions outside of the Americas (Persian Gulf, Saudi Arabia).
U.S. refineries might import and purchase light crude oil instead of heavy crude oil (Rapier, 2013). Refinery managers expect that this price and discount trend will continue with increasing oil production levels in North America.
2.3. Supply
2.3.1. Domestic Supply
Cushing in Oklahoma has the largest oil storage facilities in the United States with tanks that can hold from 80,000 to 600,000 barrels of oil (Philips, 2012). The major oil companies such as British Petroleum (BP) and Enbridge Energy Partners own most of those storage tanks. Two varieties of heavy crude are generally available: Western Texas Sour (WTS) with API 30.2° and Heavy Louisiana Sweet (HLS) with API 36-40° (See Table 1). When demand for asphalt and road oil weakens or when the price of oil is relatively low due to oversupply in Cushing, asphalt and road oil producers will likely purchase Western Texas Intermediate (WTI), which has an API 39.6°. The reasoning behind such a decision is that the light crude oil is easier to refine and the shipping distance from Texas is shorter than from North Dakota, hence it is more cost effective. Numerous pipeline carriers are available in the area to deliver purchased crude oil to facilities located near Catoosa, Oklahoma, which is approximately 65 miles east of Cushing.
Figure 1: Annual average discount for crude from the Americas
2.3.2. International Supply
The United States is the third largest producer of crude oil, followed by Saudi Arabia and the Russian Federation (Figure 2). The United States, Canada, Mexico, and Venezuela, all in the Western Hemisphere, rank in the top ten of crude oil producers and account for 18% of the world production. The top 15 countries account for approximately 76% of the world’s production.
Oil producers in the United States, Canada, United Kingdom, India, Argentina, Australia, Columbia, and Australia are privately owned, whereas most other countries own their oil production entities. The U.S. oil production rate relative to its reserves is the highest in the Western Hemisphere as observed (U.S. Energy Information
Administration, 2011). Combined, Venezuela and Canada have the largest proven oil reserves in the world, and can abe a stable source of supply to the Western Hemisphere for decades. The analysis herein focuses on comparing the logistics of purchasing heavy crude oil from the largest Western Hemisphere producers: Canada, Mexico, and Venezuela. 0,00% 2,00% 4,00% 6,00% 8,00% 10,00% 12,00% 0 20 40 60 80 100 120
2000 2001 2002 2003 2004 2005 2006 2007 2008 2009 2010 2011
D isco u n t R ate (% ) US $ p e r B ar re l Year
Figure 2: The 16-year average world oil production, 2000 - 2015 (BP Global, 2016).
2.4. Production Capacity
When assessing the performance of a refinery, throughput is one of the key performance indicators. Throughput explains annual performance, which the markets predict, whereas the alternative measure of capacity varies depending on several factors such as labor, finance, electricity, physical flow, and transportation (Figure 3). In 2015, the United States refined more than 16 million barrels per day, whereas Canada, Mexico, and Venezuela combined refined 3.6 million barrels per day. The refinery throughput from Canada, Mexico, and Venezuela is relatively unchanged. In contrast, U.S. refinery throughput increased steadily since 1985.
The overall supply of asphalt has decreased continuously since 2006, immediately prior to the economic recession. While overall supply decreases, the total amount of asphalt oil remains. In 2013, U.S. refineries imported 7.3% of the total asphalt sourced (United Nations, 2016). Since 2013, the supply of asphalt and road oil production increased by an annual average of 2.87% (U.S. Energy Information Administration, 2017).
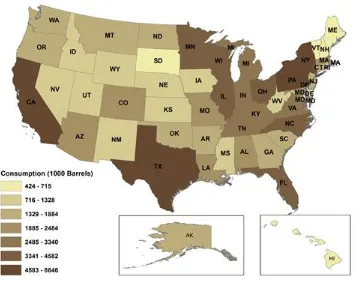
2.5. Demand
The U.S. transportation sector consumed 125.3 million and 128.8 million barrels of asphalt and road oil in the year 2015 and 2016, respectively. After a consumption decrease in 2013 and 2014, there was a consumption increase of approximately 5-8 million barrels per day (United Nations, 2016). As expected, consumption increases correlate with an increase in transportation funds for pavement and transportation infrastructure improvement.
Figure 3: U.S. oil refinery capacity (bars) and U.S., Canadian, Mexican and Venezuelan oil refinery throughput (lines), 1985-2015 (BP Global, 2016).
2.6. Transportation
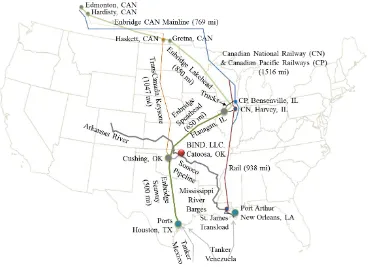
Given its midcontinent location, Oklahoma imports from Latin America will arrive at the U.S. Gulf Coast and move north. Importing crude oil from Canada will cross the border and then move south. Figure 5 illustrates a summary of the mode choices available, the approximate line-haul distances in miles, and costs in dollars per barrel ($/b) for pipelines or cents per ton-mile (¢/t-m) for truck, rail, and barge.
The four northbound route options from Venezuela and Mexico include oil-tanker-vessels-to-barge (i.e. Sea-Barge), oil-tanker-vessels-to-CP trucks-to-pipeline (i.e. Sea-CP-TR-PL), oil-tanker-vessels-to-CN Railway-to-trucks-to-pipeline (i.e. Sea-CN-TR-PL), and oil-tanker-vessels-to-pipeline (i.e. Sea-Pipeline). The five southbound route options from Canada include pipeline-direct (i.e. Pipe-Direct), pipeline connection from Edmonton, Canada (i.e. E-Pipe-Pipe), pipeline connection from Hardisty, Canada (i.e. H-Pipe-Pipe), CP Railway-to-trucks-to-pipeline (i.e. CP-TR-PL), and CN Railway-to-trucks-to-pipeline (i.e. CN-TR-PL). A dilute is necessary to move heavy crude oil through long haul transport pipelines. Diluents consist of naphtha, gas condensates, or light oils that reduce viscosity. The typical mix reduces the actual feedstock content to 70% of a barrel (WEC, 2010). It is not necessary to add dilutes for mode options such as rail, trucks, and barges. However, if any of the intermediate movements involves pipelines, then the carrier must add dilute to transport the commodity, thereby increasing the tariff based on the additional volume of material transported.
Figure 5: Transportation options (Bridgelall, et al., 2016)
3. Global Supply Chain Perspectives
Trade Agreement (NAFTA), pressures from environmental activists, concerns about the growing U.S. dependence on foreign oil, security aspects of transporting dangerous goods, weather conditions that can adversely affect some transportation options, and the availability of transport capacity. The next sections describe each of these areas that are factors in the importer decision-making process.
3.1. Customs and Regulations
The World Customs Organization established an international Harmonized Commodity Description and Coding System (the “Harmonized System”) that virtually all countries use to classify imported goods. Based on the Harmonized System, the USITC (Office of Tariff Affairs and Trade Agreements) publishes a Harmonized Tariff Schedule (HTS) of the United States that lists the tariffs for all items imported. The tariff listed for crude oil is 5.25 cents per barrel for API below 25° and 10.5 cents per barrel for API of at least 25° (U.S. International Trade Commission, 2017). To qualify for the NAFTA duty-free rate, the supplier must provide a certificate of origin showing where the product was “wholly obtained or produced.” According to the online HTS, there is no import duty on heavy crude or asphalt and road oil. This means that Canadian heavy crude oil transported undiluted via rail qualifies for duty-free import. However, if mixed with diluents obtained from a non-NAFTA country, then the diluted crude oil will not qualify for duty-free import (Cranker & Andersen, 2011). Alternatively, if heavy crude is not transported by rail, but by pipeline, then it must be diluted (Stockman, 2013). For this reason, Canadian oil producers tend to purchase diluents from Chicago area refineries to prepare the oil for pipeline transport to the U.S. Also, in analyzing customs and regulations related to transportation of heavy crude, we should allow for the possibility that higher demand for heavy crude by the U.S. may require supply from countries other than Canada. In 2016, Canada announced its intention to undergo an expansion of the Trans-Mountain pipeline, and the expectation that it would import 890,000 barrels per day of crude oil to Asia Pacific markets (Mawji, 2016). While this planned expansion has met with some opposition from Canadian provincial interests (Williams, 2017), if it were to ultimately succeed then there would necessarily be less heavy crude supply from Canada to the U.S. If the U.S. had to seek increased supply of heavy crude from a country such as Venezuela, for example, then reduced customs and regulations costs related to NAFTA becomes irrelevant.
Lastly, U.S. importers of oil, generally, whether heavy crude or light crude, remain subject to state imposed restrictions on cross-state shipments of energy goods. For example, in 2014 Minnesota legislators, working with a climate action group, “proposed a bill that would place a fee on every gallon of oil that moved through the state either by rail or pipeline.” (Minnesota Department of Public Safety, 2017). As various constituencies seek to promote healthier climate concerns and/or deter oil spill accidents, there is a possibility of increased state imposed regulation on oil transportation through the states.
3.2. Free Trade Agreements and Government Legislation
The 1993 North American Free Trade Agreement (NAFTA) led to the elimination of all tariffs for trade among the Unites States, Mexico, and Canada. The three nations of NAFTA form the largest free-trade area in the world, accounting for about one-third of the world’s gross domestic product (Villarreal, 2012). NAFTA played a more far-reaching role in Mexico by spurring economic policy changes in the early 1990s to privatize seaports, railroads, and airports. These changes attracted a large amount of private foreign investment. As previously mentioned, to the extent that the majority of U.S. heavy crude supply is from Canada and/or Mexico, and is transported without diluents and by rail, then NAFTA is a big benefit to U.S. importers. When diluents must be added in order to transport heavy crude, there are associated fees, even when imported by the U.S. from a NAFTA country (see Section 3.1, above).
reduce oil imports by encouraging greater conventional crude oil production, increased production of bio-fuels, efficiency improvements, and alternative fuel vehicles (Broder & Frosch, 2011). We are too soon into the current Trump administration to get a firm grip on whether or not such policies will be continued. However, given President Trump’s stated goal of greater infrastructure building, we might assume that at a minimum he will favor increased crude oil production. But, the incentives must be there for U.S. oil refineries to invest in such production towards greater asphalt supply given the higher-value obtained from products such as gasoline, diesel and jet fuel.
3.3. Import Licenses
The United States government does not require licenses for the import of crude oil (Office of Fossile Energy, 2014). Distilled petroleum products, on the other hand, requires import authorization from the U.S. Department of Energy.
3.4. Federal Energy Regulatory Commission
Pipelines are common carriers. The Energy Policy Act of 1992 gave the Federal Energy Regulatory Commission (FERC) authority to regulate interstate pipeline transport rates and practices (Congress, 1992). The regulations intend to establish equal service conditions and equal access for shippers. They cover product composition and tariff agreements between shippers and pipeline operators. The pipeline operators are responsible for delivering the agreed-upon batch quality to the consignee. Specifically, carriers must restrict sediment and water content in pipelines to no more than 0.5% by volume (Association of Oil Pipe Lines and American Petroleum Institute, 2012). Pipeline carriers can negotiate different rates with the shippers as long as they can demonstrate that they do not have monopolistic power (Federal Energy Regulatory Commission, 2009). Most pipeline carriers provide storage and terminal services for fixed fees based on long-term contracts. Fees may include other services such as crude oil heating, mixing, and blending.
3.5. Security Aspects
The U.S. Customs and Border Protection (CBP) leads a voluntary supply chain security program called Customs-Trade Partnership Against Terrorism (C-TPAT). The program focuses on terrorism related security initiatives involving the supply chains of private companies. According to the CBP, participating companies are six times less likely to undergo a security related cargo examination. CN Railway was the first railroad in North America to partner with CBP on this initiative (Koerner, 2011). When dealing with supply chain security, the entire chain should be involved (Melnyk, et al., 2013).
Each agency of the U.S. Department of Transportation (U.S. DOT) regulates the transportation of hazardous materials for the modes that fall within their official scope of duties. The Federal Motor Carriers Safety Administration (FMCSA), the Federal Railway Administration (FRA), the Pipeline and Hazardous Materials Safety Administration (PHMSA), and the U.S. Coast Guard (U.S. CG) regulate the transport of hazardous materials by road, rail, pipeline, and waterways, respectively. The Hazardous Materials Table of Title 49 CFR §172.101, the U.S. Code of Federal Regulations (CFR), lists crude oil as a flammable liquid or a Class 3 hazardous material (U.S. Government Publishing Office, 2011). The associated United Nations Model Regulations code is UN1267 (petroleum crude oil classification), and is identified as a flammable substance (United Nations Security Council, 2017). The FMCSA requires motor carriers to obtain a Hazardous Materials Safety Permit (HMSP) prior to transporting crude oil. The shipper is responsible for determining the hazardous material classification, placard requirements, employee training, and incident reporting. The carrier is responsible for obtaining and providing all of the required documentation, and for appropriately marking their vehicles.
3.6. Environmental Concerns
The Environmental Protection Agency (EPA) is responsible for implementing and enforcing federal environmental laws. The U.S. Coast Guard and the Minerals Management Service (MMS) of the Interior Department implements and enforces environmental and safety laws related to offshore oil and gas production (Caldwell, et al., 2009). The federal Comprehensive Environmental Response, Compensation, and Liability Act (CERCLA) imposes liability on anyone responsible for hazardous substance release into the environment.
The amount of greenhouse gas released in the crude oil extraction process varies and depends on the process used. Hazardous material released from the process could wipe out ecologically sensitive areas and food sources. For example, improperly disposed of well-waste can pollute rivers and streams, and sterilize farmlands for decades (Thamke & Preston, 2012). Producing steam to release hydrocarbons from the oil sands emits huge amounts of carbon dioxide (Natural Petroleum Council, 2012).
The potential for spills from a fractured pipeline was one of the major reasons for the postponed decision on the TransCanada XL pipeline construction. Environmentalists and oil companies engaged in disputes about the corrosiveness of diluted asphalt and road oil (dilbit) used for transporting Canadian oil. Dilutes are usually natural gas condensate, naphtha, or a mix of other light hydrocarbons (Association of Oil Pipe Lines and American Petroleum Institute, 2012). Weakened ship hulls pose risk and have been linked to disasters such as the millions of gallons released into the Gulf of Mexico and the Prince William Sound. When making decisions, the shipper should evaluate the level of these risks in selecting modes and carriers by examining their safety records, procedures, average age of vessels, and insurance coverage. Lastly, many have noted that “the rapidly expanding domestic transport of crude by rail and barge is raising concerns after several derailments and explosions and a barge accident that spilled crude into the Mississippi River” a few years ago (Rector, 2014).
3.7. Foreign-Trade Zone
The Smoot-Hawley Tariff Act of 1930 created the Free-Trade Zone (FTZ) Board and gave it the authority to approve applications for foreign-zone status. The act entitled each U.S. port of entry to at least one zone. Congress amended the FTZ Act in 1950 to permit manufacturing in the zone. Two years later, the FTZ Board issued new regulations that would allow companies to register for subzones wherever those may be located. The U.S. Homeland Security’s Customs and Border Protection (CBP) directly oversees the FTZs. Currently, all states have at least one zone and 45 states have at least one subzone (Vance & Heldebrand, 2012). Since the early 1990s, the FTZ Board has approved over 80 refinery or petrochemical subzone applications. In 2011, crude oil accounted for 75% of the foreign goods that entered into an FTZ (Bolle & Williams, 2012).
FTZ regulations allow refineries in a subzone to defer customs duties on crude oil until the refined product enters the U.S. for consumption. Final products re-exported are not subject to customs duties. For example, ExxonMobil is a registered FTZ participant and does not pay duties on jet fuel refined from imported crude and then sold to airplanes bound for international destinations (Vance & Heldebrand, 2012). This is possible because according to the FTZ rules, the aircraft has not formally entered the U.S.
The ability to register a potential asphalt and road oil manufacturer as an FTZ subzone may allow for future opportunities to transform the crude oil into duty free asphalt and other petroleum products for export to other countries or to other FTZs. This opportunity could include road and tarmac paving products sold to ports or airports that are located in FTZs. An “inverted tariff” structure of the U.S., FTZ regulations provide additional opportunities for cost savings by reducing the tariff only to that portion of crude oil used to produce the exported product (Bolle & Williams, 2012). The rule also allows a company to claim the tariff on the final product sold in the U.S. if that amount is lower than the crude oil tariff.
4. Conclusion
The study examined several factors such as customs, regulations, security, environmental compliance, and natural events that will affect the costs, schedules, and risks. The decision to source from a particular country included non-price factors such as cultural aspects, local practices, trade barriers, and business opportunities.
Even though this study is well positioned with soft factors such as environmental and legal issues considered in a broad approach, the study will be improved using quantitative methods. In the future, the study will expand using survey instruments or the Delphi method to receive expert opinions.
References
Association of Oil Pipe Lines and American Petroleum Institute, 2012. Diluted Bitumen, Washington, DC: Association of Oil Pipe Lines (AOPL) and American Petroleum Institute (API).
Bell, J. E., Autry, C. W., Mollenkopf, D. A. & Thornton, L. M., 2012. A natural resource scarcity typology: theoretical foundation and strategic implications for supply chain management. Journal of Business Logistics, 33(2), pp. 158-166.
Bolle, M. J. & Williams, B. R., 2012. U.S. Foreign-Trade Zones: Background and Issues for Congress, Washington, DC: Library of Congress, Congressional Research Service (CRS).
BP Global, 2016. Statistical Review of World Energy. [Online]
Available at: http://www.bp.com/en/global/corporate/energy-economics/statistical-review-of-world-energy.html [Accessed 29 12 2016].
Bridgelall, R., Lee, E. & Rahim-Taleqani, A., 2016. Sourcing Strategy for Asphalt Production Feedstock Considering Multimodal Transport Options. Management Review: International Journal, 11(1), pp. 4-31.
Broder, J. M. & Frosch, D., 2011. U.S. Delays Decision on Pipeline Until After Election, s.l.: s.n.
Caldwell, C., Lewis, C., Nettles, L. & Vigdor, W., 2009. Getting the Deal Through – Oil Regulation, Dallas: Vinson & Elkins LLP.
Congress, 1992. H.R.776 - Energy Policy Act of 1992, Washington D.C.: s.n.
Cranker, G. A. & Andersen, H. K., 2011. Exporting Canadian Oil and Gas: The Challenge of NAFTA Compliance, Washington, DC: Association of Corporate Counsel.
Environmental Canada, 2017. Oil Properties. [Online]
Available at: http://www.etc-cte.ec.gc.ca/databases/Oilproperties/pdf/WEB_West_Texas_Sour.pdf [Accessed 13 3 2017].
Federal Energy Regulatory Commission, 2009. Regulatory Basics for Oil Pipelines. Washington, DC, Federal Energy Regulatory Commission (FERC).
Koerner, T. J., 2011. Statement of Timothy J. Koerner, Vice President and Chief Security Officer, Canadian National Railway Company, Washington, DC: U.S. House of Representatives Hearing On Using Resources Effectively To Secure Our Border Ports Of Entry.
Mawji, O., 2016. Canada's oil exports owuld be dead without US shale. Business Insider, 5 12.
Melnyk, S. A., Ritchie, W. J. & Calantone, R. J., 2013. The case of the C-TPAT border security initiative: assessing the adoption/persistence decisions when dealing with a novel, institutionally driven administrative innovation. Journal of Business Logistics, 34(4), pp. 289-300.
Minnesota Department of Public Safety, 2017. Minnesota Rail and Pipeline Safety Regulations. [Online]
Available at: https://dps.mn.gov/divisions/hsem/planning-preparedness/Documents/minnesota-rail-safety-pipeline-safety-fact-sheet.pdf
[Accessed 1 8 2017].
Natural Petroleum Council, 2012. Hydrocarbon Liquids Analysis, Washington, DC: Natural Petroleum Council (NPC).
Office of Fossile Energy, 2014. How to obtain authorization to import and/or export natural gas and LNG. [Online] Available at:
Parfomak, P. W., 2016. Pipelines: securing the veins of the american economy, Washington D.C.: Congressional Research Service.
Philips, M., 2012. The Oil Hub Where Traders are Making Millions. Bloomberg Business Week, 27 September . Platts, 2012. New Crudes, New Markets, s.l.: McGraw-Hill.
Rapier, R., 2013. The Sweet and Sour Economices of Refining. [Online]
Available at: https://www.investingdaily.com/16229/the-sweet-and-sour-economics-of-refining/ [Accessed 7 4 2017].
Rector, K., 2014. Environmental groups stepping up opposition to crude oil shipments in Baltimore. The Baltimore Sun, 12 6.
Schenk, C. J., Pollastro, R. M. & Hill, R. J., 2006. Natural Bitumen Resources of the United States, s.l.: U.S. Geological Survey.
Stockman, l., 2013. Petroleum Coke:the Coal Hiding in the Tar Sands, Washington D.C.: OilChange Internationa. Thamke, J. & Preston, T., 2012. Brine Contamination to Aquatic Resources in the Prairie Pothole Region and
Williston Basin. Lewistown, United States Geological Survey (USGS).
Turner, Mason & Company Consulting Engineering, 2014. The North Dakota Petroleum, Council Study on Bakken Crude Properties, Bismarck, ND: North Dakota Petroleum Countil.
Tyler Rhodes, 2005. Alaska Journal of Commerce. [Online]
Available at: http://www.alaskajournal.com/community/2005-06-05/demand-and-scarcity-send-asphalt-prices-skyrocketing#.WOe8PhLyuis
[Accessed 7 4 2017].
U.S. Department of Transportation, 2017. MAP-21. [Online] Available at: https://www.fhwa.dot.gov/map21/
[Accessed 7 4 2017].
U.S. Energy Information Administration, 2011. Western Hemisphere Proven Oil Reserves and Production. Oil and Gas Journal.
U.S. Energy Information Administration, 2017. Refining District Minnesota-Wisconsin-North Dakota-South Dakota Refinery Yield of Asphalt and Road Oil, Annual. [Online]
Available at: https://www.eia.gov/opendata/qb.php?category=304671&sdid=PET.MAPRY2B3.A [Accessed 7 4 2017].
U.S. Government Publishing Office, 2011. 49 CFR 172.101 - PURPOSE AND USE OF HAZARDOUS MATERIALS TABLE. [Online]
Available at: https://www.gpo.gov/fdsys/granule/CFR-2011-title49-vol2/CFR-2011-title49-vol2-sec172-101/content-detail.html
U.S. International Trade Commission, 2017. Harmonized Tariff Schedule (2017 HTSA Basic Edition). [Online] Available at: https://hts.usitc.gov/view/Chapter%2027?release=basicCorrections2
[Accessed 16 6 2017].
United Nations Security Council, 2017. Sanctions List Materials. [Online]
Available at: https://www.un.org/sc/suborg/en/sanctions/1267/aq_sanctions_list United Nations, 2016. UN Data: World of Information. [Online]
Available at: http://data.un.org/Data.aspx?d=EDATA&f=cmID%3ABT [Accessed 30 12 2016].
Vance, P. & Heldebrand, M., 2012. Why Zones are Important to the Oil Refining Business in the U.S., Washington, DC: Ernst & Young, LLP.
Villarreal, A. M., 2012. U.S. – Mexico Economic Relations: Trends, Issues, and Implications, Washington, DC: Congressional Research Service.
WEC, 2010. 2010 Survey of Energy Resources. London: World Energy Council (WEC).