www.ann-geophys.net/26/3863/2008/ © European Geosciences Union 2008
Annales
Geophysicae
Equatorial Spread F structures and associated airglow intensity
variations observed over Gadanki
R. Sekar1, D. Chakrabarty1, R. Narayanan1, and A. K. Patra2
1Physical Research Laboratory, Ahmedabad, India
2National Atmospheric Research Laboratory, Gadanki, India
Received: 3 July 2008 – Revised: 25 August 2008 – Accepted: 21 October 2008 – Published: 2 December 2008
Abstract. Co-ordinated campaigns have been conducted from Gadanki (13.5◦N, 79.2◦E, dip lat 6.4◦N) by operating simultaneously the Indian MST radar in ionospheric coher-ent backscatter mode and by monitoring thermosphere air-glow line emissions (630.0 nm and 777.4 nm) using a narrow band multi-wavelength scanning photometer during January-March for the past five years (2003–2007) and also during April 2006, as a special campaign. Simultaneous radar and optical observations reveal optical signatures corresponding to a variety of equatorial spread F (ESF) structures. The op-tical signatures corresponding to ESF structures with wave-like bottomside modulations with plasma plumes, confined bottomside flat and wavelike structures, vertically extended plume structure in the absence of bottomside structure apart from the classical plasma depletions and enhancements are obtained during these campaigns. The plasma depletions and enhancements were identified using optical measurements. In addition, estimations of zonal wavelength of the bottom-side structures and the inference of shears in the zonal plasma drift in the presence of confined structures, were carried out using bi-directional airglow measurements. Furthermore, it is found that the vertical columnar intensity of OI 630.0 nm airglow exceeded the slanted columnar intensity in the pres-ence of large bottomside structure. The need for the appro-priate physical mechanisms for some of the ESF structures and their characterizations with optical observations are dis-cussed.
Keywords. Atmospheric composition and structure (Air-glow and aurora) – Ionosphere (Equatorial ionosphere; Iono-spheric irregularities)
Correspondence to: R. Sekar
1 Introduction
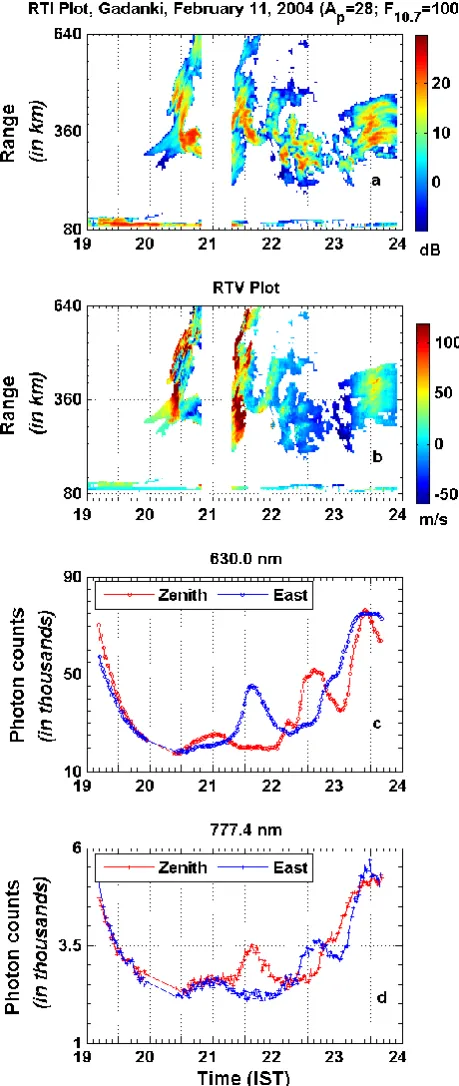
Fig. 1. (a) Range-Time-Intensity (RTI) map of equatorial spread F structures observed over Gadanki on 11 February 2004 revealing wave-like bottomside structure with large altitude extents, (b) the corresponding Range-Time-Velocity (RTV) map, (c) temporal vari-ations of OI 630.0 nm airglow intensity over zenith (red) and 45◦ eastern (blue) directions, (d) temporal variations of OI 777.4 nm airglow intensity over zenith (red) and 45◦eastern (blue) directions.
simultaneous triggering of ESF at two zonally separated lo-cations during storm time was identified (Chakrabarty et al., 2006; Sekar and Chakrabarty , 2008) using bi-directional air-glow and VHF radar observations. Results obtained with par-ticular ESF structures were discussed in those studies. In the present paper, optical signatures at 630.0 nm and 777.4 nm corresponding to a variety of ESF structures revealed by the VHF radar maps are presented and discussed.
2 Experimental details
The mesosphere-stratosphere-troposphere (MST) radar at Gadanki is a high power coherent pulsed radar which op-erates at 53 MHz with a maximum peak-power-aperture-product of 3×10¹⁰W m2. The detailed descriptions of the radar subsystems are discussed by Rao et al. (1995). The ob-servations reported in this communication are obtained us-ing the 3◦wide beam oriented at 14.8◦N from zenith, which makes the beam normal to Earth’s magnetic field at F-region altitudes.
The details of the multi-wavelength scanning photometer for airglow studies during nighttime have been discussed in a previous communication (Sekar et al., 2004). Temperature-tuned, narrow band (band width∼0.3 nm) interference filters are used in this photometer. Further, the field of view (∼3◦) of the photometer is chosen to be similar to the VHF radar beamwidth. The photometer was operated in a bidirectional mode using a computer-controlled mirror scanning arrange-ment fitted on top of the photometer. Coordinated airglow and radar measurements have been conducted in campaign modes during January–March 2003–2007 and in April 2006 as a special campaign mode. Note that the integration time is 10 s for most of the airglow observations except during March 2003 campaign when it is 1 s.
3 Observations
Although ESF structures are known to have enormous vari-abilities from one event to another, the basic structural char-acteristics observed by VHF radar, however, are found to fall in a few broad categories. Accordingly, observations made during last 5 years have been thoroughly scrutinized and clas-sified. The following examples elicit fairly well that simul-taneous VHF radar and airglow observations can be used ef-fectively to characterize different features of ESF. In order to appraise the solar flux and geomagnetic activity conditions, theF10.7andAP indices are provided in the text as well as
in figures.
3.1 Wave-like bottomside ESF structure with large altitude extents
[image:2.595.51.281.72.616.2]to be a magnetically disturbed day (AP=28,F10.7=100). The
time in IST (Indian Standard Time, IST = Universal Time, UT+5.5 h) is plotted along abscissa which is common for all the subplots. The Time-Intensity (RTI) and Range-Time-Velocity (RTV) maps of the radar echoes are shown in subplots 1a and 1b, respectively. The colour codes in them correspond to SNR (in dB) of return echoes in panel (a) and line-of-sight Doppler velocities in panel (b). The vertical and slant (along east 45◦) columnar intensities of 630.0 nm and 777.4 nm airglow emissions are depicted in panels (c) and (d), respectively, in Fig. 1. Similar panels are used in all the remaining figures. Note that there are gaps in radar data (in Fig. 1) during 20:50–21:20 IST and in photometer data during 19:50–20:30 IST due to technical reasons. The RTI map in Fig. 1a reveals a wave like bottomside undula-tion along with vertically erect and slant plume structures. The bottomside undulation encompassed from∼225 km to as high as∼350 km altitude region. The temporal variations of 630.0 nm airglow intensities observed from zenith (con-tinuous curve) and east (dotted) reveal monotonic decrease during post-sunset hours followed by large (period>1.0 h) and small scale (period∼30 min–1.0 h) variations. The small scale variations are not prominent in slant columnar intensity while large scale variations are prominent in both directions. It is interesting to note that the integrated slant columnar in-tensity is less than vertical columnar inin-tensity on occasions. The temporal variations of 630.0 nm along zenith direction depicted in Fig. 1c, reveal a large scale enhancement between 21:15 to 22:00 IST. Corresponding to this time interval, the integrated intensity over slant columnar intensity is found to be less. An enhancement is observed at a displaced time in-terval for the slant columnar intensity variation depicted as dotted profile in Fig. 1c. Comparing Fig. 1c and d, it is clear that 777.4 nm intensity variations over zenith during 21:15– 23:00 IST are anti-correlated with the intensity variations of 630.0 nm over zenith. During the same time interval, the in-tensity variation of 777.4 nm over east is found to be cor-related with the intensity variation of 630.0 nm over zenith. A similar correlation is also observed between the intensity variations of 777.4 nm over zenith with 630.0 nm over east.
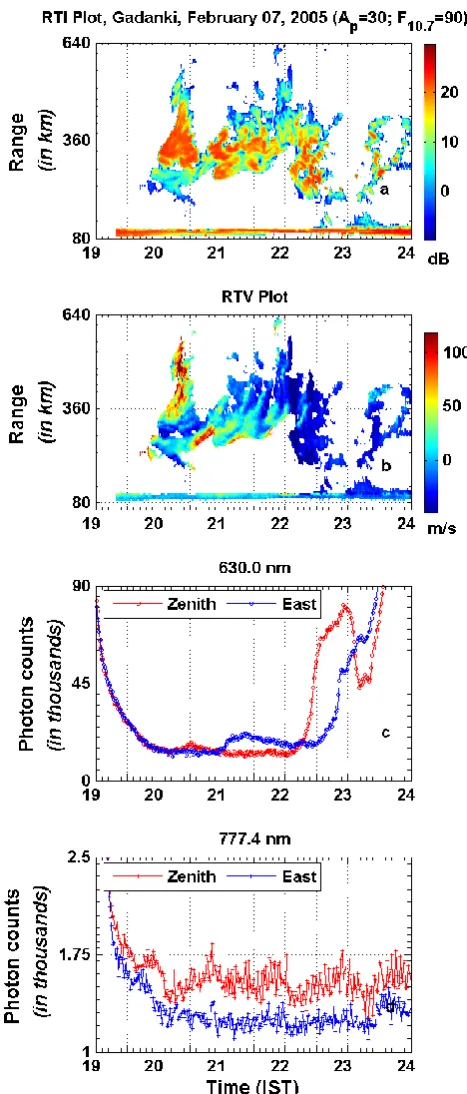
Figure 2 depicts another example of large altitude ex-tent of bottomside structure associated with ESF observed on another magnetically disturbed day (7 February 2005;
AP=30, F10.7=90). During 20:00 to 20:30 IST, both
bot-tomside structures and a plume event are seen in the radar map. Correspondingly, over zenith, the airglow intensities in 630.0 nm reveal a slight increase around 20:30 and and a decrease in 777.4 emission centered around 20:15 IST. Af-ter 20:30 IST, the bottomside structures moved well beyond the 630.0 nm emission layer encompassing the altitude re-gion around 400 km. Correspondingly, the zenith emission intensities in 630.0 nm and 777.4 nm reveal flat and oscilla-tory features, respectively. However, the slant columnar in-tensity in 630.0 nm emission revealed a slight enhancement corresponding to this bottomside structure as the lower
alti-Fig. 2. Similar to alti-Fig. 1 but for 7 February 2005 revealing wave-like bottomside structure with large altitude extents.
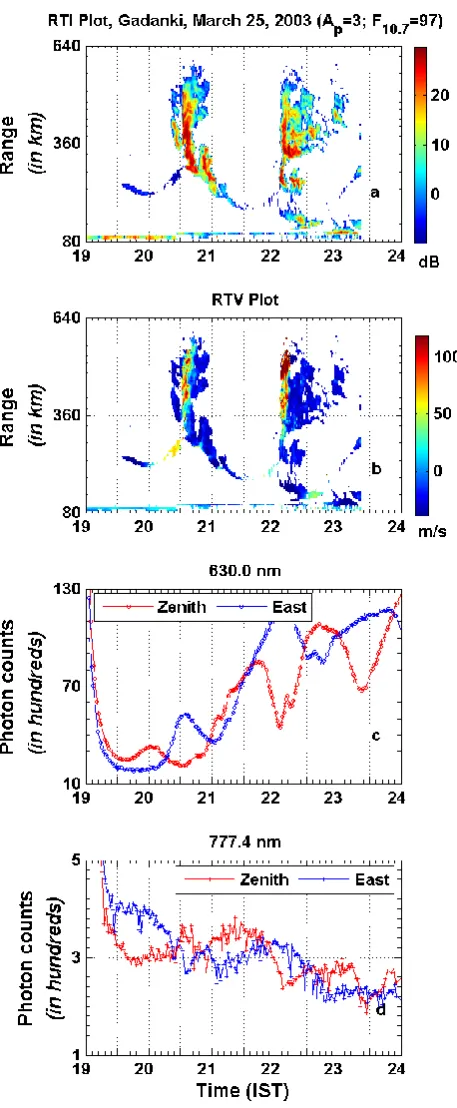
[image:3.595.309.543.59.607.2]Fig. 3. Similar to Fig. 2 but for 25 March 2003 revealing wave-like bottomside structure with large altitude extents. Note that the integration time for airglow observations is 1 s.
Figure 3 depicts yet another example of ESF structure on 25 March 2003 having a spectacularly sinusoidal bottomside structure with large altitude extent. It is noted that, unlike the
previous two cases, this day was magnetically quiet (AP=3,
F10.7=97). The detailed description of this structure in
com-parison with the observation on non ESF night along with the corresponding airglow signatures in the vertical direc-tion have been discussed in a previous communicadirec-tion (Sekar et al., 2004). Some of the plume structures were shown to be plasma enhancements (Sekar et al., 2004). However, the air-glow observations in the eastward (45◦elevation) direction were not considered earlier and are included in Fig. 3c and d, respectively. The bi-directional airglow observations are also used in determining the zonal plasma drift and in decipher-ing the zonal wavelength (discussed later) of the bottomside structure.
3.2 Bottomside confinement of ESF structures and associ-ated airglow intensity variations
Figure 4 depicts an ESF event where only bottomside ESF structure is observed without any plasma plume. This obser-vation is on 19 March 2004 (AP=7,F10.7=100) which
hap-pens to be magnetically quiet day preceded by quiet condi-tions for a few days. In Fig. 4a, the RTI map reveals that ESF structures are confined around 250–300 km. The RTV map in Fig. 4b brings out the upward moving region flanked by downward moving regions in that confined structure. Corre-sponding to this structure, a weak response is seen only in 630.0 nm airglow intensity variations as depicted in Fig. 4c. It is interesting to note that the vertical columnar intensity during 19:45 to 20:15 IST is more than the slant columnar in-tensity. A steep rise in 630.0 nm intensity is observed in both vertical and slant columnar intensities at around 20:45 IST and at 20:15 IST respectively. The turning points in the tem-poral variations of 630.0 nm intensities over eastern direc-tion are preceding the zenith observadirec-tions indicating that the structures are moving westward. In the absence of high al-titude structures (like plumes), no significant intensity varia-tion is observed in 777.4 nm (Fig. 4d) except a few spikes for which the reasons are not understood.
Figure 5 depicts a similar set of subplots for another case of ESF that occurred on 21 March 2004 (AP=11, F10.7=99). Figure 5a reveals a wavelike bottomside structure
[image:4.595.52.281.59.614.2]Fig. 4. Similar to Fig. 3 but for 19 March 2004 revealing bottom-side confinement of ESF structures and associated airglow intensity variations.
intensity over zenith and eastward directions around 20:45 and 21:00 IST suggest that the zonal drift is eastward around 250–300 km altitude region. Unlike the previous case, the shears in the zonal drift could not be directly inferred for
Fig. 5. Similar to Fig. 4 but for 21 March 2004 revealing bottom-side confinement of ESF structures and associated airglow intensity variations.
[image:5.595.53.279.65.596.2]Fig. 6. Similar to Fig. 5 but for 28 March 2003 revealing bottomside ESF structure descending to E-region. Note that the integration time for airglow observations is 1 s.
[image:6.595.53.284.60.626.2]3.3 Bottomside ESF structure descending to E-region Figure 6 depicts another case of ESF event on 28 March 2003 (AP=27, F10.7=131). A large scale bottomside
struc-ture with a flat crest region just before 20:00 IST is observed in Fig. 6a. The bottomside structure is found to descend to lower altitudes similar to the previous observation reported by Patra et al. (1997). A couple of plume structures are also seen to override the bottomside structure during 20:00– 20:20 IST. Figure 6b reveals predominantly downward ve-locity in the bottomside as well as in the plume structures. A steep increase in intensity is observed in the temporal variation of 630.0 nm intensity (Fig. 6c) particularly in the eastward direction. However, signatures of plume structures are recorded only in 777.4 nm zenith intensity variations ∼20:00 IST. Corresponding to small patches between 22:00 to 23:00 IST, irregular variations are observed in 630.0 nm zenith intensities.
3.4 Isolated plasma plume structure
Figure 7 depicts an ESF event on 12 February 2005 (AP=4, F10.7=102) wherein a vertically erect structure extending
from∼200 km to∼425 km is observed in RTI map which is somewhat separated from the adjoining structure. Radar data are not available after 22:00 IST on this night. It is in-teresting to note that the velocities inside the first structure are predominantly downward barring a small region wherein the velocities are upward. The vertical airglow emission cor-responding to this structure clearly reveals an enhancement in 630.0 nm and possibly so in 777.4 nm observation over zenith. This serves as a clear example for a plasma enhance-ment structure extending upto 450 km. The second struc-ture was broader and the velocities were predominantly up-ward with corresponding decrease in 630.0 nm intensity over zenith. The signature for the second structure in 777.4 nm is not clear. The fluctuations observed in 630.0 nm intensity after∼22:15 IST could not be characterized as the radar ob-servation was not available.
Figure 8 depicts isolated, tower-like ESF structures and a small patch which are observed around 22:00 IST on 20 March 2004 (AP=12, F10.7=101) along with
Fig. 7. Similar to Fig. 6 but for 12 February 2005 revealing isolated plasma plume structure. Please note that radar data are available during 21:00–22:00 IST only.
3.5 Closely-spaced multiple plume structures
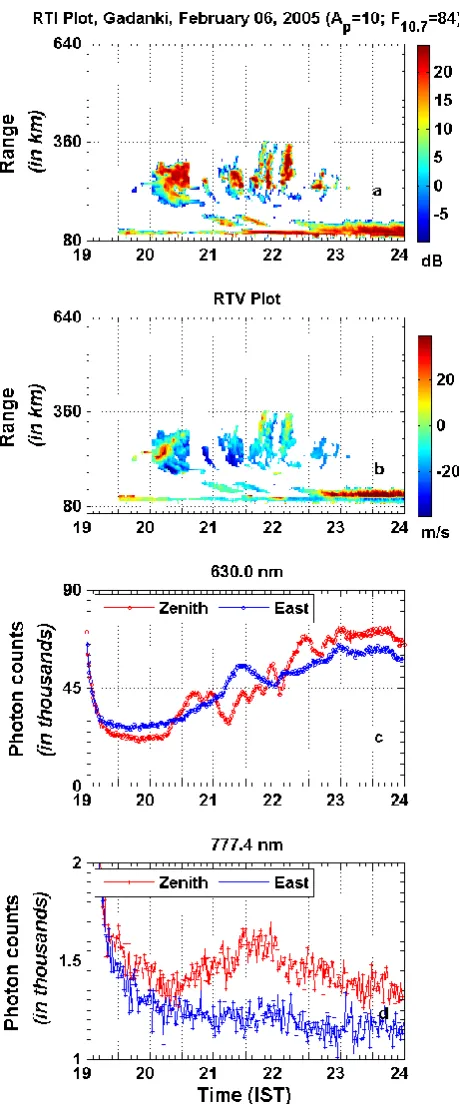
Figure 9 depicts another special event of ESF observed on 6 February 2005 (AP=10, F10.7=84). The plasma
struc-Fig. 8. Similar to struc-Fig. 7 but for 20 March 2004 revealing isolated plasma plume structure.
[image:7.595.281.537.60.615.2]Fig. 9. Similar to Fig. 8 but for 6 February 2005 revealing closely-spaced multiple plume structures.
those structures are plasma enhancements except a structure just after 22:00 IST. Most of the decreases in 630.0 nm intsity are found to be associated with the absence of plasma en-hancement structures associated with ESF. The 777.4 nm
in-tensity does not register any variations corresponding to these ESF structures. However, a broad enhancement observed in 777.4 nm intensity variation around 21:30 IST over zenith di-rection. Similar closely-spaced plasma structures (not shown in diagram) during ESF event along with oscillatory features in 630.0 nm airglow intensities were also recorded on 29 Jan-uary 2006 (AP=2,F10.7=69).
3.6 Plasma bubble structure
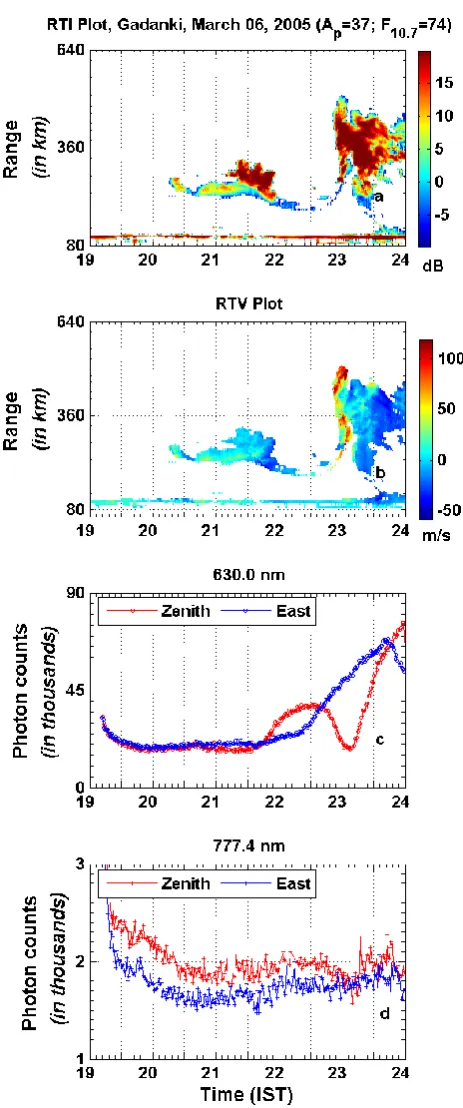
Another ESF event obtained on 6 March 2005 (AP=37, F10.7=74) is depicted in Fig. 10. A bottomside
undula-tion during 20:40–22:30 and a plume structure at around 23:00 IST were observed on this night. The velocities inside this plume structure are predominantly upward. The airglow intensity variations in 630.0 nm and 777.4 nm emissions over zenith record unambiguous signatures of plasma depletion around 23:00 IST. The slant columnar intensity variations do not record signatures corresponding to vertically erect deple-tions. Interestingly, the slant columnar intensity of 777.4 nm depicted in Fig. 10d is found to be less in comparison with the zenith intensity throughout the period till 23:00 IST.
4 Discussion
one wavelength mode as seed perturbations for the genera-tion of plasma enhancement beyond 350 km. The structures depicted in Figs. 1 and 3 indicate in support of this simula-tion as the plume structures ride over a large scale bottomside structures. Moreover, the phase relation between the inten-sities of 630.0 nm observed over east and the inteninten-sities of 777.4 nm over zenith (see Fig. 1) supports the possible phase correlation between the two seeding wavelength modes em-ployed in those simulations (Sekar et al., 2001). On the other hand, the isolated structures without the connection to the bottomside reported in Figs. 7 and 8 require further investi-gation.
In the absence of steering facility of the existing MST radar at Gadanki, the bi-directional airglow measurements over zenith and eastward directions are used to infer zonal plasma drifts. Identifiable crests and/or troughs in the tem-poral variations of airglow intensities having mutual corre-spondences are chosen to infer the trace velocities. By as-suming the peak of the emission altitude of 630.0 nm to be ∼250 km during nighttime, the zonal separation between the mutually corresponding points is 250 km for the present set of measurements where the elevation angle is 45◦. The trace drift velocities in the zonal direction are estimated using the zonal separation and the temporal delay between the corre-sponding points. It is noticed that the trace velocities on most of the occasions are in eastward direction. The eastward drift velocities were ∼116 m s−1 and 139 m s−1 at∼20:20 and 21:30 IST on 25 March 2003 while the velocities de-crease from 87 m s−1to 69 m s−1from∼21:30 to 22:20 IST on 21 March 2004. The eastward drift velocities on 11 February 2004, 7 and 12 February 2005, were 126, 86 and 116 m s−1 respectively at ∼20:30 IST. These values are in
the range of the measured zonal drift over Jicamarca (Fe-jer, 1981). However, these observations are not adequate to provide systematic temporal variations over Gadanki. It is in-teresting to note that the trace velocity inferred on 19 March 2004 at 22:00 IST was westward (∼−116 m s−1) around the emission altitude (i.e. ∼250 km) region as the correspond-ing points in the temporal variations of 630.0 nm intensities over eastern direction are preceding the zenith observations (see Fig. 4). However, the reason for the high value of the westward drift is not clear and needs further investigation. Similar such westward velocity on 7 January 2005 was also inferred by Chakrabarty et al. (2006) using similar set of ob-servations, when the plasma structures were confined to a limited altitude region around 250–300 km. However, above ∼250 km, the zonal plasma drift is essentially governed by F-region dynamo during nighttime which drives the plasma in the eastward direction. This is mainly due to the east-ward wind determined by the thermal gradient in the ther-mosphere. Thus the inference of westward drift around the altitude emission of 630.0 nm clearly indicates a strong ver-tical shear in the zonal plasma drift. These observations are consistent with the earlier numerical simulation of Sekar and Kelley (1998) wherein it was shown that the strong shears
Fig. 10. Similar to Fig. 9 but for 6 March 2005 including the 777.4 nm observations in the bottom panel. The observations reveal the plasma bubble structure.
[image:9.595.311.543.57.612.2]accompany with the polarity change in zonal plasma drift. Note this does not preclude that there are altitude variations in the eastward plasma drift. Based on the simulation of Za-lesak et al. (1982), it can be inferred that the slanted plume structure around 21:00 IST is a clear indication of altitude variation in the eastward plasma drift.
In the absence of steerable radar, it is difficult to decipher whether the ESF structures observed in RTI maps are due to temporal variations or spatially varying structures mov-ing into the radar field of view by the background zonal drift (Woodman and La Hoz, 1976). Using the scanning ca-pability of the Equatorial Atmosphere Radar, Fukao et al. (2004) have shown that while the ESF structures are advect-ing horizontally into the radar beam, the structures are also evolving with time. While the uncertainty remain with the finer scale structures, the large scale structures localized in the zonal direction could be taken to represent zonal scale sizes of the ESF structurs. The coordinated airglow and radar measurements provide a way in some cases to determine the spatial scale structures in zonal direction. For example, the zonal wavelength of the bottomside structure observed on 25 March 2003 and depicted in Fig. 3, is∼626 km consider-ing a trace velocity of∼116 m s−1. Similarity in the patterns of zonal and zenith airglow intensity variations confirms the presence of zonal structures. Such a large wave-like bottom-side ESF structures with large altitude extents, similar to the observations over Jicamarca (Kelley et al., 1981), have been observed even over Gadanki where dip angle is 15◦N at F-region altitudes. Simultaneous measurements from the dip equator and off-equatorial region are required to conclude that such large scale structures are indeed mapped along the magnetic field lines. Some of these wave-like structures en-compass both airglow emitting altitude regions where shears alone in the zonal plasma flow with respect to neutrals can-not be a seed. Thus, these structures are in support of that the gravity waves are the seed (Kelley et al., 1981) for such bottomside structures. Further, the presence of such large scale seed perturbations observed on both magnetically quiet and disturbed conditions (refer Figs. 1 to 3) indicates that the auroral activities need not be the source. However, the bottomside large wave-like structures (Figs. 1 and 2) are conspicuously more irregular (presence of fine structures) during the disturbed period compared to quiet time struc-ture (Fig. 3). The role of disturbance electric field to form fine structures within the large bottomside structure needs to be investigated further. In contrast to the large scale wave-like structures, comb-like structures shown in Fig. 9 re-quire much smaller seed wavelengths. Nearly three plumes are observed within an hour in RTI map (see Fig. 9) at a lower altitude region of∼220 km. The trace velocity in the zonal direction is only∼60 m s−1on this night (6 February 2005). Assuming each plume evolved from the trough re-gion of each wave, the zonal wavelength is estimated to be ∼72 km. Spatial structures in the electric field generated by E-region gravity waves and mapped from the off-equatorial
region are suggested (Huang and Kelley, 1996) to be the pos-sible seed for such plumes. This possibility of off-equatorial E-region electric field structures seeding the ESF structures with smaller wavelength needs to be explored in future. Fur-ther, the connection between the upper E-region and the F-region plasma structure particularly the large scale bottom-side structure needs further investigations. Earlier investiga-tion (Sekar et al., 2001) revealed that the electric field gener-ated by the interaction between the large and small scale size perturbations with suitable amplitude can lead to descending structure (Fig. 6) to upper E-region.
The interesting point emerges using bi-directional airglow measurements that the slant columnar airglow intensities, in spite of geometrical advantages, on occasions, are found to be less than the corresponding zenith observations. Many such examples are provided in the results section. This is in contrast to the Van-Rhijn advantage principle based on which the slant columnar intensities are generally expected to be more than the zenith intensities. This can happen in the presence of depleted ESF structures in off-zenith direc-tions and/or enhancement structures over zenith when these structures nearly fill the field of view at the emission altitude region. This is clearly evident in the narrow-beam photom-etry employed in the present investigation. Photomphotom-etry with a large field of view (broad-beam) may average out the air-glow intensity fluctuations associated with ESF (occupying less spatial region) compared to the background airglow in-tensity (occupying more spatial region). This makes the slant columnar intensity to exceed the zenith intensity in case of broad-beam photometry. On the otherhand, the narrow beam photometer operated in 45◦ eastern direction, on occasion, can underestimate the degree of depletion (see Fig. 10) of a vertically erect plasma depleted structure in the presence of neighbouring plasma enhancement structures owing to the relatively larger contributions of the large background in comparison with the plume structure in the airglow intensity along the slant path. Finally, since the signal to noise ratio for 777.4 nm airglow intensity is not as high as in 630.0 nm, the signatures in 777.4 nm are clearly evident only when the 777.4 nm signal intensities are significant.
Therefore, it is apparent that coordinated optical and radar observation of ESF is a powerful tool to probe the finer fea-tures of ESF and to infer many dynamical conditions that govern the evolution of ESF. More such observations are planned to investigate ESF in a comprehensive manner.
5 Summary
bottomside structures are estimated using bi-directional air-glow observations. Further, the possible shear in the zonal plasma drift is inferred when the ESF structure is confined to limited altitude region. It is found that on occasions, the vertical columnar intensity of OI 630.0 nm airglow obtained using narrow band photometry exceeded the slant columnar intensity in the presence of large bottomside structures. The need for the physical mechanisms for the development of plasma enhancement structures without the bottomside tures and the seeding of ESF by E-region electric field struc-tures are discussed. The importance of simultaneous mea-surements from the dip and off-equatorial region for mapping of wavelike bottomside ESF structure with large altitude ex-tents is emphasized.
Acknowledgements. The authors thank the Director and the staff
members of the National Atmospheric Research Laboratory for their cooperation in making the observational campaign successful. This work is supported by the Department of Space, Government of India.
Topical Editor M. Pinnock thanks M. Kelley and J. H. Sastri for their help in evaluating this paper.
References
Chakrabarty, D., Sekar, R., Narayanan, R., Patra, A. K., and Deva-sia, C. V.: Effects of interplanetary electric field on the devel-opment of an equatorial spread-F event, J. Geophys. Res., 111, A12316, doi:10.1029/2006JA011884, 2006.
Fejer, B. G.: The equatorial ionospheric electric fields: A review, J. Atmos. Terr. Phys., 43, 377–386, 1981.
Fukao, S., Ozawa, Y., Yokoyama, T. Yamamoto, Y., and Tsun-oda, R. T.: First observations of spatial structure of F region 3m scale field-aligned irregularities with the Equatorial Atmo-sphere Radar in Indonesia, J. Geophys., Res., 109, A02304, doi:10.1029/2003JA010096.
Huang, C.-S. and Kelley, M. C.: Nonlinear evolution of equato-rial spread F 3. Plasma bubbles generated by structured electric fields, J. Geophys. Res., 101, 303–313, 1996.
Kelley, M. C., Larsen, M. F., LaHoz, C., and McClure, J. P.: Gravity wave initiation of equatorial Spread F: A case study, J. Geophys. Res., 86, 9087–9100, 1981.
Kelley, M. C.: The Earths Ionosphere, Int. Geophys. Ser., Academic Press, San Diego, California, 43, 114–119, 1989.
Mendillo, M., Baumgardner, J., Pi. X, Sultan, P. J., and Tsunoda, R.: Onset conditions for equatorial spread F, J. Geophys. Res., 97, 13 865–13 876, 1992.
Ossakow, S. L. and Chaturvedi, P. K.: Morphological studies of rising equatorial spread F bubbles, J. Geophys. Res., 83, 2085– 2090, 1978.
Patra, A. K., Ananadan, V. K., Rao, P. B., and Jain, A. R.: First ob-servations of equatorial spread F from Indian MST radar, Radio Sci., 30, 1159–1165, 1995.
Patra, A. K., Rao, P. B., Anandan, V. K., and Jain, A. R.: Radar observations of 2.8 m equatorial spread F irregularities, J. Atmos. Sol-Terr. Phys., 59, 1633–1641, 1997.
Rao, P. B., Jain, A. R., Kishore, P., Balmuralidhar, P., Damle, S. H., and Vishwanathan, G.: Indian MST radar, system description and sample vector wind measurements in ST mode, Radio Sci., 30, 1125–1138, 1995.
Rino, C. L., Tsunoda, R. T., Petriceks, J., Livingston, R. C., Kelley, M. C., and Baker, K. D.: Simultaneous rocket-borne beacon and in-situ measurements of equatorial spread F-intermediate wave-length results, J. Geophys. Res., 86, 2411–2420, 1981.
Sekar, R. and Kelley, M. C.: On the combined effects of vertical shear and zonal electric field patterns on nonlinear equatorial spread F evolution, J. Geophys. Res., 103, 20 735–20 747, 1998. Sekar, R., Kherani, E. A., Rao, P. B., and Patra, A. K.: Interaction of two long wavelength modes in the non-linear numerical simu-lation model of equatorial Spread-F, J. Geophys. Res., 106(A11), 24 765–24 775, 2001.
Sekar, R., Chakrabarty, D., Narayanan, R., Sripathy, S., Patra, A. K., and Subbarao, K. S. V.: Characterization of VHF radar ob-servations associated with equatorial Spread F by narrow-band optical measurements, Ann. Geophys., 22, 3129–3136, 2004, http://www.ann-geophys.net/22/3129/2004/.
Sekar, R., Chakrabarty, D., Sarkhel, S., Patra, A. K., Devasia, C. V., and Kelley, M. C.: Identification of active fossil bubbles based on coordinated VHF radar and airglow measurements, Ann. Geo-phys., 25, 2099–2102, 2007,
http://www.ann-geophys.net/25/2099/2007/.
Sekar, R. and Chakrabarty, D.: Role of overshielding electric field on the development of premidnight plume event: simulation re-sults, J. Atmos. Sol-Terr. Phys., 70, 2212–2221, 2008.
Tsunoda, R. T. and Towle, D. M.: On the spatial relationship of 1-meter equatorial spread F irregularities and depletions in total electron content, Geophys. Res. Lett., 6, 873–876, 1979. Tsunoda, R. T.: Magnetic field-aligned characteristic of plasma
bubbles in the night time equatorial ionosphere, J. Atmos. Terr. Phys., 42, 743–752, 1980.
Tsunoda, R. T., Livingston, R. C., McClure, J. P., and Hanson, W. B.: Equatorial plasma bubbles vertically elongated wedges from the bottomside F layer, J. Geophys. Res., 87, 9171–9180, 1982. Weber, E. J., Basu, S., Bullett, T. W., et al.: Equatorial plasma
depletion precursor signatures and onset observed at 11◦south of the magnetic equator, J. Geophys. Res., 101(A12), 26 829– 26 838, 1996.