TECHNICAL REPORTS
Carbon-rich biochar derived from the pyrolysis of biomass can sequester atmospheric CO2, mitigate climate change, and potentially increase crop productivity. However, research is needed to confi rm the suitability and sustainability of biochar application to diff erent soils. To an irrigated calcareous soil, we applied stockpiled dairy manure (42 Mg ha−1 dry wt) and hardwood-derived biochar (22.4 Mg ha−1), singly and in combination with manure, along with a control, yielding four treatments. Nitrogen fertilizer was applied when needed (based on preseason soil test N and crop requirements) in all plots and years, with N mineralized from added manure included in this determination. Available soil nutrients (NH4–N; NO3–N; Olsen P; and diethylenetriaminepentaacetic acid–extractable K, Mg, Na, Cu, Mn, Zn, and Fe), total C (TC), total N (TN), total organic C (TOC), and pH were evaluated annually, and silage corn nutrient concentration, yield, and uptake were measured over two growing seasons. Biochar treatment resulted in a 1.5-fold increase in available soil Mn and a 1.4-1.5-fold increase in TC and TOC, whereas manure produced a 1.2- to 1.7-fold increase in available nutrients (except Fe), compared with controls. In 2009 biochar increased corn silage B concentration but produced no yield increase; in 2010 biochar decreased corn silage TN (33%), S (7%) concentrations, and yield (36%) relative to controls. Manure produced a 1.3-fold increase in corn silage Cu, Mn, S, Mg, K, and TN concentrations and yield compared with the control in 2010. Th e combined biochar-manure eff ects were not synergistic except in the case of available soil Mn. In these calcareous soils, biochar did not alter pH or availability of P and cations, as is typically observed for acidic soils. If the second year results are representative, they suggest that biochar applications to calcareous soils may lead to reduced N availability, requiring additional soil N inputs to maintain yield targets.
Biochar and Manure Aff ect Calcareous Soil and Corn Silage
Nutrient Concentrations and Uptake
R. D. Lentz* and J. A. Ippolito
T
he manufacture of biochar (biomass-derivedblack carbon) via pyrolysis of photosynthetically fi xed C biomass, along with the subsequent storage of bio-char in soil, provides a real means of reducing atmospheric CO2 and mitigating climate change (Laird, 2008; Woolf et al., 2010; Matovic, 2011). However, research is needed to evaluate the expediency and sustainability of storing recalcitrant bio-chars in diff erent types of soils (Matovic, 2011).
Research has evaluated biochar eff ects on highly weathered soils of the humid tropics and acidic forest soils. Th e addi-tion of charcoal to these soils increased the pH and decreased aluminum saturation of highly weathered soils via the addi-tion of K, Ca, magnesium (Mg), and sodium (Na) caaddi-tions, which are present in the biochar or associated ash (Tryon, 1948; Chidumayo, 1994; Glaser et al., 2002). Charcoal also increased the cation exchange capacity, total N (TN), and the availability of P in these soils, and the charcoal itself is an effi -cient adsorber of polar and hydrophobic molecules (Glaser et al., 2002). Another study found that a forest soil amended with 1% charcoal increased net nitrifi cation rates (DeLuca et al., 2006). Researchers hypothesized that charcoal may adsorb organic compounds that inhibit nitrifi cation or compounds that might otherwise stimulate immobilization (Wardle et al., 1998; Fierer et al., 2001; DeLuca et al., 2006; Gundale and DeLuca, 2007). Charcoal may bind NH4+ in the soil or
stimulate N immobilization by microbes (Steiner et al., 2008; Deenik et al., 2010), with the latter accomplished by binding organic compounds that inhibit microbial activity (Iswaran et al., 1980; Wardle et al., 1998; DeLuca et al., 2006).
As a result of these eff ects, charcoal amendments can sub-stantially increase seed germination, crop yields, and crop quality (Glaser et al., 2002; Kadota and Niimi, 2004; Rondon et al., 2007: Steiner et al., 2007; Mu et al., 2004). In some cases, however, negative eff ects have been described. Deenik et al. (2010) observed reductions in vegetable growth with increasing macadamia nut (Macadamia integrifolia Maiden &
Betche) charcoal applications when fertilizer was not applied. Growth reduction was attributed to phenolic and other C com-pounds in the charcoal, which may have stimulated microbial growth and immobilization. Th is negative C mineralization
Abbreviations: DTPA, diethylenetriaminepentaacetic acid; EC, electrical conductivity; ICP–AES, inductively coupled plasma atomic emission spectrometry; OC, organic carbon; TC, total carbon; TN, total nitrogen; TOC, total organic carbon. USDA–ARS, Northwest Irrigation and Soils Research Lab., 3793 N 3600 E, Kimberly, ID 83341. Assigned to Associate Editor Denis Angers.
Copyright © 2012 by the American Society of Agronomy, Crop Science Society of America, and Soil Science Society of America. All rights reserved. No part of this periodical may be reproduced or transmitted in any form or by any means, electronic or mechanical, including photocopying, recording, or any information storage and retrieval system, without permission in writing from the publisher.
J. Environ. Qual. 41 doi:10.2134/jeq2011.0126 Received 4 Apr. 2011.
*Corresponding author (rick.lentz@ars.usda.gov). © ASA, CSSA, SSSA
5585 Guilford Rd., Madison, WI 53711 USA
Journal of Environmental Quality
ENVIRONMENTAL BENEFITS OF BIOCHAR
priming eff ect of biochar was also reported by Zimmerman et al. (2011), who found that its magnitude was a function of soil organic C (OC) concentration and type of biochar.
Because biochar properties vary with the source of bio-mass and conditions of pyrolysis (Novak et al., 2009b; Spokas et al., 2010; Zimmerman et al., 2011), comparisons among experiments that use diff erent biochars can be problematic. A number of studies have used the same type of biochar derived from hardwood waste biomass (CQuest; Dynamotive Energy Systems, West Lorne, Ontario, Canada). Experiments using CQuest biochar are underway at various locations across North America, including several that are part of a national eff ort by the USDA Agricultural Research Service to assess the biochar’s eff ect on soil properties and crop production.
In 2008, a commercial-scale demonstration study applied 3.9 Mg ha−1 CQuest to acidic soils in Quebec, Canada. In the
following 3 yr, the biochar treatment produced 1.04- to 1.2-fold greater yields than the control (Husk and Major, 2011). When added to a peat-based, acidic nursery container sub-strate (pH 3.9), the CQuest biochar increased water-extract-able Fe, K, Na, P, and B and decreased Al, Ca, Mg, Mn, and S (Dumroese et al., 2011). Other researchers grew asparagus in a New Haven, Connecticut soil (pH 6.9) amended with CQuest, which increased K, S, Mn, and B nutrient concentra-tions in crop tissue while decreasing N, Mg, and Fe concen-trations relative to the control (Elmer and Pignatello, 2011). Minnesota researchers reported that relatively large CQuest biochar additions to an acidic silt loam soil (pH 6.5) gener-ally suppressed CO2, CH4, and N2O production rates during a 100-d incubation (Spokas et al., 2009). Th is result suggested that the biochar stabilized soil OC, which has implications for N and S availability because they are substantially derived from organic sources.
Before the current study, little published research has evalu-ated the infl uence of CQuest or other types of biochar on fi eld soils over several years or determined its eff ects on soil chemi-cal properties of semiarid, chemi-calcareous soils. A few recent stud-ies have evaluated biochar eff ects on soils with pH values >7, but the soils were developed in wetter climates and contained little if any free lime (Iswaran et al., 1980; Smith et al., 2010; Zimmerman et al., 2011). Blackwell et al. (2010) studied the eff ect of banded biochar on fi rst-year wheat yields after bio-char application to a calcareous soil with relatively high OC (17.2–21.5 g kg−1) in southwestern Australia. When fertilizer
was applied, the biochar had little infl uence on wheat grain yield (Blackwell et al., 2010).
Arid soils tend to have low organic matter concentrations and alkaline pH values, but many are irrigated and intensively cropped under light and temperature regimes that produce near optimal yields (Lobell et al., 2009). Fertility demands on these irrigated soils are high, and adding biochar might ben-efi t soils by increasing their OC content. However, biochar’s observed positive impacts on fertility may partially be related to its ability to raise the pH of acidic soils, which is unlikely to occur in biochar-amended calcareous soils. In general, the infl uence of biochar additions on the fertility of agricultural soils in temperate regions is not well understood (Atkinson et al., 2010). Th e objective of this study was to determine the eff ect of CQuest biochar and dairy manure amendments and
their interaction on soil chemical properties and crop nutrient uptake of an irrigated, calcareous fi eld soil in southern Idaho.
Materials and Methods
Site, Soils, and Amendments
Experimental plots were established in fall 2008 on sprinkler-irrigated Portneuf silt loam (coarse-silty, mixed superactive, mesic Durinodic Xeric Haplocalcids) with 1.4% slopes near Kimberly, Idaho (42°31′ N, 114°22′ W, elevation of 1190 m). Th e surface soil contained 200 g kg−1 clay, 560 g kg−1 silt,
12 g kg−1 OC, and 8.8% calcium carbonate equivalent. Th e
soil has a saturated paste extract electrical conductivity (EC) of 0.05 S m−1, exchangeable sodium percentage of 1.5, pH
of 7.6 (saturated paste), and a cation exchange capacity of 19 cmolc kg−1. Soils on the site have been cropped to an
alfalfa–corn–bean–grain rotation for the previous 33 yr. No manure had been applied to the soils since 1986.
Solid manure from dairy cattle (Bos species) was retrieved
from an open pen at a local dairy, where it had been stock-piled through summer 2008 in 1.7-m-high, unconfi ned piles. Th e material contained little or no straw bedding and com-prised 55.3% solids at time of application. Total C and TN of the organic amendments were determined on a freeze-dried sample with a CN analyzer (Th ermo-Finnigan FlashEA1112; CE Elantech Inc., Lakewood, NJ). Total elements were deter-mined by HClO4–HNO3–HF-HCl digestion (Soltanpour et al., 1996) followed by analysis using inductively coupled plasma atomic emission spectrometry (ICP–AES). Manure NO3–N and NH4–N were determined using a 2 mol L−1 KCl
extract (Mulvaney, 1996). Manure volatile solids were deter-mined gravimetrically by ashing at 550°C for 12 h.
Dry biochar (CQuest) with a <0.5-mm particle size was shipped to the laboratory and stored in sealed steel barrels. Th e charcoal was manufactured from oak and hickory hardwood sawdust using fast pyrolysis at 500°C. It had a 14% ash con-tent, an O:C ratio of 0.22, and a surface area of 0.75 m2 g−1.
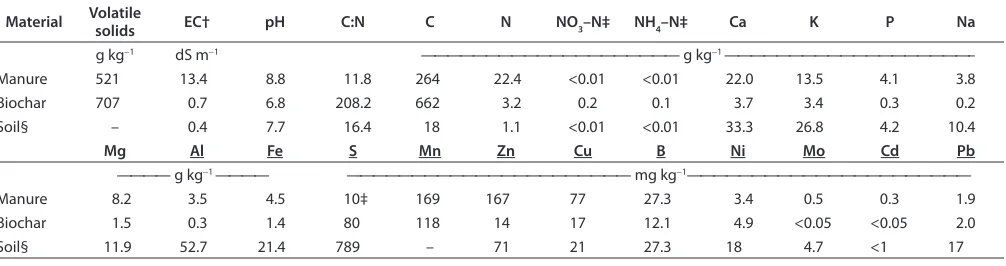
Th e pH of CQuest was near neutral, at the low end of the pH range observed for biochars, and was preferable to more alka-line amendments for these higher pH soils. Ash content of the biochar was determined using ASTM methods for wood char-coal (600°C). Other chemical characteristics were determined as previously described. Soil, manure, and biochar chemical characteristics are presented in Table 1.
Experimental Design
Th e experimental design was a randomized complete block with three replicates. Four amendment treatments included (i) a control (no manure or biochar application); (ii) manure application (42 Mg ha−1 dry wt. application of stockpiled dairy
manure); (iii) biochar application (22.4 Mg ha−1 dry wt); and
(iv) manure+biochar combined application using rates identical to manure-only and biochar-only treatments. Th e soil amend-ments were applied only once, in fall 2008. Spring 2009 soil sampling indicated that plot soils needed to be supplemented only with N to meet the corn silage yield target of 67 Mg ha−1
(22.2 Mg ha−1 dry wt) for 2009 and 2010. Inorganic N
avail-able in the fi rst growing season and 12% in the second grow-ing saeson (local unpublished data) and that biochar supplied little N to soils in either year. Plots were 4.6 m wide and 5.2 m long and included six planted rows. Limited biochar avail-ability precluded larger plot sizes and additional experimental blocks. Plots were separated by a 1.5-m-wide planted buff er, and a 4-m-wide planted border strip comprised the perimeter.
Field Operations
Spring barley (Hordeum vulgare L.) was grown on the site in
2008. After harvest, the fi eld was moldboard plowed to 0.20-m depth. On 21 Nov. 2008, solid manure from a local dairy was collected and hand-applied to designated plots. Th e manure was subsampled during application, and the composite volume was stored at 4°C for later analysis. Biochar was hand-applied to des-ignated plots on 24 Nov. 2008, and immediately thereafter all plots were rototilled to 0.15-m depth. Th e fi eld was roller har-rowed on 21 Apr. 2009, and Round-Up ready silage corn (Zea mays L.) (Monsanto, St. Louis, MO) was planted on 12 May
2009 in 0.76-m spaced rows. On 8 June 2009, 200 kg N ha−1,
as ammonium sulfate, was applied by hand to all nonmanured plots, followed by sprinkler-applied 21-mm irrigation. Th e ini-tial soil N levels and N from mineralization in manured soils was determined to be adequate for the 2009 corn crop. Two poste-mergence applications of 2,4D-amine and glyphosate were used in June 2009 to control weeds. Irrigation through the growing season was supplied via sprinkler every 7 to 14 d to meet crop evapotranspiration requirements. Irrigation water had an aver-age electrical conductivity of 0.05 S m−1 and sodium adsorption
ratio of 0.5. Th e crop was harvested for silage on 18 Sept. 2009, with the remaining corn stover (15- to 30-cm-tall stems with leaves) fl ail chopped in preparation for a no-till planting in the spring 2010.
Round-Up ready silage corn was planted into the row spaces of the previous corn crop on 19 May 2010. Planting into the low-lying interrow spaces proved inconsistent across all plots; thus, any skips in emerged seedlings observed within plots were replanted by hand 5 d after the original seeding had emerged. On 25 June 2010, urea was applied to plots by hand at 224 kg N ha−1 for nonmanured treatments and 67 kg N ha−1
for manured treatments, immediately followed by a 57-mm irrigation. An application of 2,4-dichlorophenoxyacetic acid
and dicamba and difl ufenzopyr (Distinct; BASF, Florham Park, NJ) was applied on 14 July 2010 to control weeds. Irrigation was applied using the same method as in 2009. Silage corn was harvested in 15 Oct. 2010.
Soil and Plant Sampling and Analyses
Soil samples were collected on 20 Nov. 2008 before amend-ment applications and again on 21 Apr. 2009, 19 Oct. 2009, and 14 Apr. 2010. Four 0- to 30-cm soil samples were taken from each plot, composited, air dried at 35°C, and crushed to pass a 2-mm screen. Although it is likely that biochar eff ects were more intense within the layer of incorporation, we antici-pated that particulates and dissolved OC from biochar would move downward in the soil profi le (Major et al., 2010) and infl uence mineralization/immobilization in a like manner as manure (Lentz et al., 2011). Th us, we considered that the 0- to 30-cm depth may better incorporate biochar’s real aff ects on soil and crops. Th e soil-available P was estimated using the Olsen-P method S-4.10 (Gavlak et al., 2003). Soil NO3–N and NH4–N were extracted using 2 mol L−1 KCl and measured
within 6 h of extraction with an automated fl ow injection ana-lyzer (Lachat Instruments, Loveland, CO). Th e availability of soil K, Na, Mg, Zn, Mn, Cu, and Fe was estimated by extract-ing with diethylenetriaminepentaacetic acid (DTPA) (method S-6.10) (Gavlak et al., 2003) and analysis using ICP–AES. We determined soil total C (TC) and TN by combustion using a FlashEA1112 CN analyzer (Th ermo-Finnigan, Waltham, MA), total inorganic C using a pressure-calcimeter (Sherrod et al., 2002), and TOC by diff erence.
Standing above-ground corn biomass and silage yields were measured by hand clipping plants (30 mm above soil surface) from 3 m of two rows. Th e sample was weighed and chopped, and a subsample was collected, dried at 65°C, and ground in a Th omas Wiley mill (Th omas Wiley, Swedesboro, NJ) to pass an 865-μm screen. Th e TC and TN concentrations of the subsample were determined as previously described. A 0.50-g subsample was placed in a 100-mL beaker and dry ashed at 500°C for 5 h. Th e samples were allowed to cool and weighed, and 10 mL of 1 mol L−1 HNO
3 were added.
Th e samples were then heated on a hot plate until condensa-tion no longer occurred on the inside of the beaker. Th en, all samples were brought to a 50-mL fi nal volume by weight
Table 1. Chemical properties and total mineral and extractable inorganic nitrogen concentrations (all on a dry wt. basis) in amendments and soil.
Material Volatile
solids EC† pH C:N C N NO3–N‡ NH4–N‡ Ca K P Na
g kg−1 dS m−1 ———————————————————— g kg−1 ———————————————————–
Manure 521 13.4 8.8 11.8 264 22.4 <0.01 <0.01 22.0 13.5 4.1 3.8
Biochar 707 0.7 6.8 208.2 662 3.2 0.2 0.1 3.7 3.4 0.3 0.2
Soil§ – 0.4 7.7 16.4 18 1.1 <0.01 <0.01 33.3 26.8 4.2 10.4
Mg Al Fe S Mn Zn Cu B Ni Mo Cd Pb
———— g kg−1 ———— —————————————————————— mg kg−1——————————————————————
Manure 8.2 3.5 4.5 10‡ 169 167 77 27.3 3.4 0.5 0.3 1.9
Biochar 1.5 0.3 1.4 80 118 14 17 12.1 4.9 <0.05 <0.05 2.0
Soil§ 11.9 52.7 21.4 789 – 71 21 27.3 18 4.7 <1 17
† Electrical conductivity.
‡ Estimated.
with deionized H2O, stirred, fi ltered through Whatman #50 fi lter paper, and analyzed for P, K, Ca, Mg, and trace elements by ICP–AES
Calculations and Statistical Analysis
A repeated measures ANOVA, PROC Mixed (SAS Institute, 2008) was used to test the signifi cance of amendment, sam-pling time, and their interactions on soil chemical properties. Where needed to stabilize variances and improve normality, soil nutrient concentrations were transformed using common Log or square root. For all signifi cant fi xed eff ects, means were separated using 95% confi dence intervals. Th e means and confi dence interval values were back transformed to original units for reporting. An ANOVA, PROC Mixed (SAS Institute, 2008) was used to test the signifi cance of amendment eff ects on above-ground biomass nutrient and trace element concen-trations, total above-ground nutrient uptake, and silage yields. Biomass and yield data for 2009 and 2010 were analyzed sepa-rately. Again, transformations of concentration and uptake data were used where appropriate. We also included several more powerful, single-degree-of-freedom contrast tests in the ANOVA analyses. Th ese tested the eff ect of amendments across all sampling times and compared manure and manure+biochar together as a class vs. no-manure treatments (control, biochar) and compared biochar treatments (biochar, biochar+manure) as a class vs. no biochar treatments (control, manure). All anal-yses were conducted using at the P = 0.05 signifi cance level.
Results
Late spring (May and June) was unusually cool during both years of the study. In 2009 this period was the fourth coldest, and in 2010 late spring was the coldest of all May–June periods in the previous 14 yr. Th us, in 2009 and 2010 corn emergence and seedling establishment was delayed by 1 to 2 wk relative to more typical growing seasons.
Soil Chemical Properties
Th e ANOVA (Table 2) indicated that amendment, sample date, and their interaction signifi cantly infl uenced soil chemi-cal properties. Of the main factors, amendment aff ected all soil
properties except pH, DTPA-extractable Fe, and TN, whereas sample date aff ected all measured soil properties. Biochar itself infl uenced only soil TC, TOC, and Mn, whereas mean separa-tions and contrast tests indicated that manure had a broader infl uence on measured soil properties as compared with bio-char alone, aff ecting all soil properties except pH and Fe.
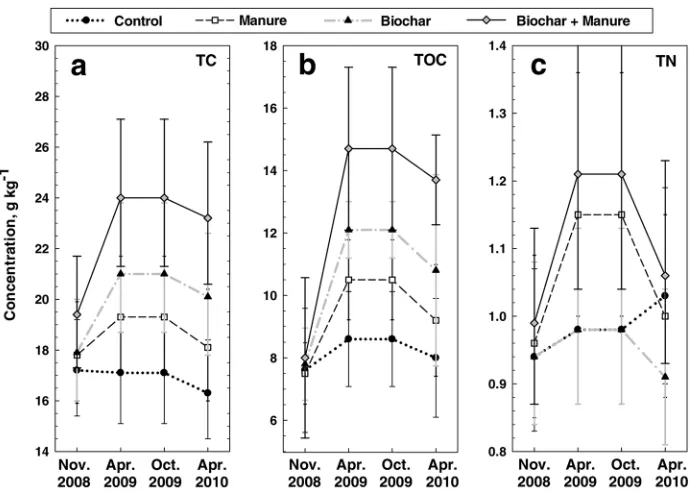
Biochar and manure eff ects on soil TC and TOC were simi-lar, and the amendments increased TC and TOC in an addi-tive manner (Fig. 1a,b). In 2009, biochar increased soil TOC 1.4-fold, compared with a 1.2-fold increase from manure and a 1.7-fold increase from the biochar+manure treatment relative to the control (Fig. 1b). Th ese proportions remained similar for the April 2010 sampling, even though soil TOC trended lower overall. Th e April 2009 increase in soil TOC for biochar plots represented 134 ± 57% of the C added, whereas the values for manure and for biochar+manure were 117 ± 71% and 127 ± 62%, respectively (assuming TC = TOC for added biochar and manure and 4.48 × 10³ Mg ha−1 soil mass for the 0- to 30-cm
layer). Total N trended upward in manure applications with or without biochar (Fig. 1c), although the diff erences were not signifi cant.
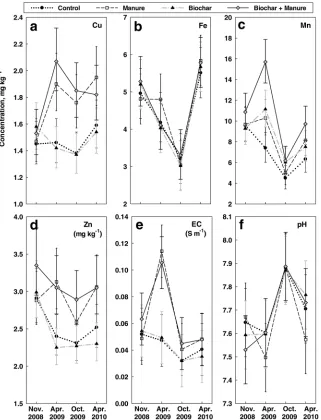
Relative to the control in 2009, biochar increased available soil Mn 1.5-fold, while manure produced a 1.4-fold increase (Fig. 2c). Adding biochar with manure produced a synergistic 2.1-fold increase in soil Mn compared with the control (i.e., this increase exceeded the sum of the two amendments individ-ual eff ects). Th e infl uence of biochar and manure on soil Mn was temporary, however, being signifi cant for the two 2009 sampling times but not for April 2010.
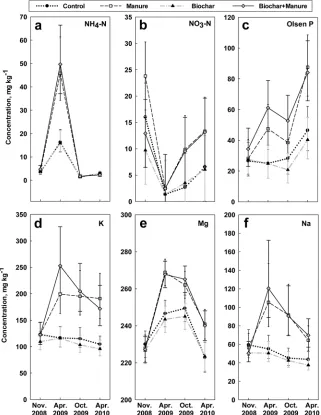
Manure treatments generally increased soil nutrient con-centrations and EC in 2009. During the 2-yr period, the manure eff ect varied depending on the nutrient; it was consis-tent across 2009–10 for Cu and Zn (Fig. 2a,d); decreased with time for Mn, EC, NH4–N, Mg, K, and Na (Fig. 2c,e and Fig. 3a,d,e,f ); or increased with time for NO3–N and Olsen P (Fig. 3b,c). Across all sampling times, manure treatments as a class increased availability of trace nutrients 1.1- to 1.2-fold and increased macronutrients and EC 1.4- to 1.7-fold as compared with no-manure treatments as a class (Table 3).
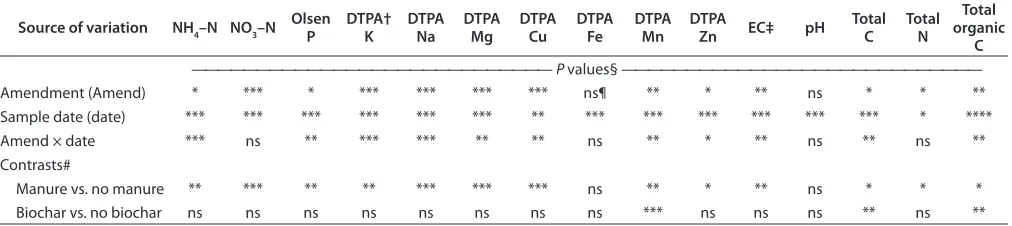
Table 2. The infl uence of amendment and sampling date on soil nutrients, electrical conductivity, and pH at the 0- to 30-cm depth.
Source of variation NH4–N NO3–N Olsen P
DTPA† K
DTPA Na
DTPA Mg
DTPA Cu
DTPA Fe
DTPA Mn
DTPA
Zn EC‡ pH
Total C
Total N
Total organic
C
———————————————————————————— P values§ ————————————————————————————
Amendment (Amend) * *** * *** *** *** *** ns¶ ** * ** ns * * **
Sample date (date) *** *** *** *** *** *** ** *** *** *** *** *** *** * ****
Amend × date *** ns ** *** *** ** ** ns ** * ** ns ** ns **
Contrasts#
Manure vs. no manure ** *** ** ** *** *** *** ns ** * ** ns * * *
Biochar vs. no biochar ns ns ns ns ns ns ns ns *** ns ns ns ** ns **
† Diethylenetriaminepentaacetic acid.
‡ Electrical conductivity.
§ P values for treatment eff ects and interaction terms and single-degree-of-freedom orthogonal comparisons derived from an ANOVA (* P < 0.05; ** P < 0.01; *** P < 0.001).
¶ Nonsignifi cant (P > 0.05).
Biochar had a synergistic eff ect on soil Mn and K availability when combined with manure, although the benefi t faded with time (Fig. 2c and 3d). Similar synergistic trends were observed for Cu and Olsen P, but the diff erences were not signifi cant (Fig. 2a and 3c).
Corn Silage Yield and Nutrient
Concentrations
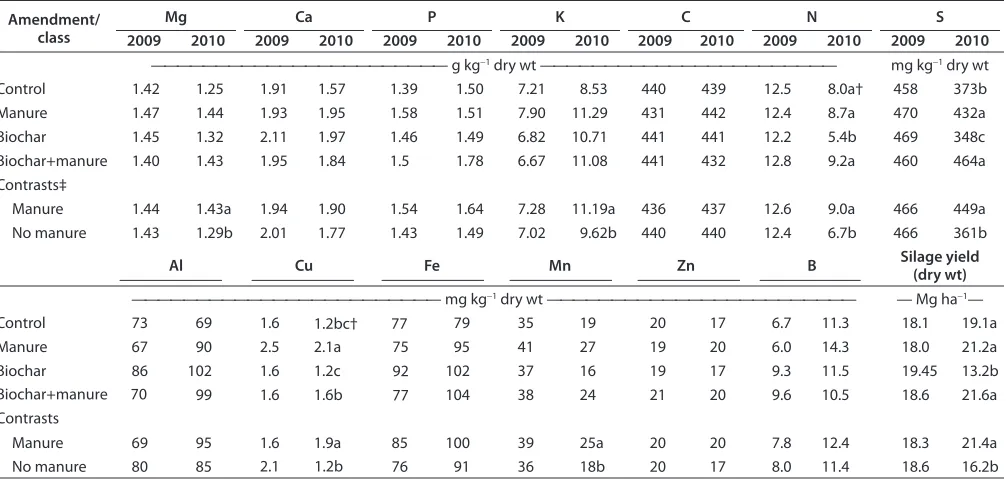
Th e statistical analysis (Table 4) indi-cated that the amendment factor had no signifi cant eff ect on silage yield and nutrient concentrations in 2009, except that biochar treatments as a class aff ected silage B concentrations (contrast test). However, in 2010 amendments did infl uence silage yield and silage Cu, S, and TN concentra-tions. Manure treatments as a class infl uenced various silage nutrient concentrations, but only in 2010.
In 2009 corn silage yields were similar among all treatments and
averaged 18.4 Mg ha−1 (Table 5), which exceeded our yield
target. However, in 2010 the biochar treatment reduced silage yield 36% (to 13.2 Mg ha−1) relative to the average yield of
the other three treatments (20.6 Mg ha−1). The 2010 biochar
yield was 19% below our target value, whereas other treatments exceeded our target. By contrast, manure as a class increased 2010 silage yields 1.3-fold relative to the mean value for no-manure treatments (Table 5).
In 2009 contrast tests showed that biochar treatments increased silage B concentration 1.5-fold compared with its average concentration in the two no-biochar treatments, 9.45 mg kg−1 vs. 6.35 (Table 4). In 2010 biochar decreased
silage concentrations 33% for TN and 7% for S (Table 5) compared with the control. Corn leaves in the biochar plots exhibited chlorotic symptoms in 2010, particularly late in the growing season. Like biochar, manure had little eff ect on silage nutrient concentrations in 2009, but as a class manure produced a mean 1.3-fold increase in 2010 concentrations of Mg, K, TN, Cu, Mn, and S (Table 5) relative to the no-manure treatment class.
Nutrient Uptake in Corn Silage
Th e ANOVA showed no signifi cant amendment eff ects on nutrient uptake in 2009, although the contrast tests indicated that biochar treatments as a class increased 2009 B uptake 1.5-fold (0.18 kg ha−1 vs. 0.12) compared with that of no-biochar
treatments (Table 6). Amendment eff ects were signifi cant in 2010, indicating that the uptake of the various nutrients was infl uenced by biochar or manure.
In 2010 treatment mean separations revealed that biochar decreased uptake of Cu, S, Mg, and TC by an average 32% and decreased TN by 52% relative to the control (Table 7). Th e contrast tests also showed that biochar treatments as a class
decreased 2010 B uptake 27% (0.19 kg ha−1 vs. 0.26) relative
to the mean value for the no-biochar treatments (Tables 6 and 7). This effect on 2010 B uptake was the reverse of that observed in 2009.
In 2010 the contrast tests indicated that manure treatments as a class increased uptake of all measured nutrients relative to the average of no-manure treatments. Manure produced an average 1.5-fold increase in B, Al, Fe, Zn, Mg, Ca, P, and TC uptake; a 1.7-fold increase in Cu, S, K, and TN uptake; and a 2.1-fold in Mn uptake (Table 7).
Discussion
Th e addition of biochar (0.5% g g−1 averaged over the 0- to
30-cm soil depth) increased TC and TOC, as did the manure and biochar+manure treatments. During the April 2009 to April 2010 period, the biochar soil lost 10.7% OC, compared with 12.4% for manure, 7% for biochar+manure, and 7% for the control (Fig. 1). Th is result suggests not only that biochar is more recalcitrant than manure but also that when the amend-ments were combined the biochar may have inhibited manure OC losses during the period. Th e biochar-only soil OC losses were similar to those reported by Steiner et al. (2007) for a tropical soil, and manure-only soil OC losses were on par with values reported for manure applied to local soils (Robbins et al., 2000).
Manure and biochar treatments had little infl uence on soil pH and had no eff ect on extractable soil nutrients other than increasing Mn availability in 2009. Th ese results diff er from those of many earlier biochar studies, which were commonly conducted with potted, acidic soils and greater biochar addi-tions over <6-mo periods (e.g., Lehmann et al., 2003; Chan et al., 2007). Th ese previous studies indicated that biochar increased soil pH and available K and Na and decreased Al. Other studies reported that biochar additions of as little as
0.36 to 0.5% increased available P, K, Mg, Mn, Ca, and As and decreased available S, Zn, and Pb (Novak et al., 2009a; Laird et al., 2010; Namgay et al., 2010). Th e exception to this was a van Zwieten et al. (2010) study for a sandy pH 4.5 soil for which only N was infl uenced by biochar. Longer-term fi eld research on acid soils (pH <5.6) using ≤1% biochar additions showed increases in soil Ca, K, and Mg in some cases but not in others (Steiner et al., 2007; Major et al., 2010; Gaskin et al., 2010) and that feedstock source infl uenced the outcome (Gaskin et al., 2010).
Th e total nutrient concentrations in the calcareous soil we evaluated exceeded those in the added biochar (except C and N), which explains in part why biochar failed to increase soil K and Mg. To increase extractable soil nutrient levels, the CQuest biochar likely would need to provide a more available form of the nutrient or, by decreasing soil pH, make intrinsic nutrient forms more available. Available soil P, Cu, Mn, Zn, and to some extent Fe concentrations
did respond to temporal changes in soil pH (Fig. 2a,b,c,d,f and 3c), indicating their sensitivity to this soil property. Th is suggests the importance of biochar’s pH-altering capability for increasing nutrient availability in acid soils. However, in our calcareous soil, the biochar eff ect on soil pH (i.e., lowering the soil pH using the near-neutral CQuest biochar) was mini-mal due to buff ering by CaCO3 present in the system.
Biochar’s temporary boosting of soil Mn availability in 2009 suggests that another factor besides a direct pH eff ect is respon-sible. Because biochar and manure included Mn and had a similar positive eff ect on soil Mn, we assumed both amendments acted as a source of the micronutrient. However, biochar’s Mn eff ects were synergistic when combined with manure, indicating that an additional process aff ected Mn availability (Fig. 2c). It is not clear if this additional process operates only in the short-term. Biochar may promote or inhibit micro-bial activity that infl uences Mn availability (Meek et al., 1968; Abou-Shanab et al., 2003) via changes in microbial populations and activity (Khodadad et al., 2011) or mycorrhizal root colonization (Solaiman et al., 2010). Th ese shifts may result from bio-char eff ects on physical soil properties (e.g., soil water retention) (Glaser et al., 2002; Laird et al., 2010) or release or sorption of microorganism-inhibiting or -promoting chemicals (Uusitalo et al., 2008; Clough and Condron, 2010; Deenik et al., 2010; Spokas et al., 2010) or because biochar pro-vides additional habitat or refugia for organ-isms (Pietikainen et al., 2000; Warnock et al., 2007). Th e increased soil Mn avail-ability due to biochar had little impact on silage Mn concentrations. Th e uptake of Mn concentration by the corn was low (Table 5) relative to the range of values considered to be suffi cient (Adriano, 1986). Th us, biochar’s enhancing eff ect on soil Mn availability is not likely to have a negative impact on corn silage yields. Increased Mn availability may be an important benefi t in these calcareous soils because of glyphosates’s negative infl uence on Mn and Fe uptake in genetically modifi ed (Round-Up ready) crops (Eker et al., 2006). Th e increased availability of soil nutrients from manure was expected because manure acts as a mineral source (Table 1) (Eghball et al., 2002) and supports a more active microbial biomass (Burger and Jackson, 2003).
Silage Nutrient Concentrations and Yields
That manure had a greater influence on silage nutri-ent concnutri-entrations than biochar (Table 4) follows from its markedly greater influence on soil nutrient availabil-ity. Compared with the control, manure produced the
greatest increase in soil NH4–N, K, Mg, Cu, and Mn in spring 2009 (Fig. 2 and 3), yet these increases did not result in increased corn silage nutrient concentra-tions or yields until 2010 (Table 5). The reason for this is unclear.
Biochar had little infl uence on corn silage nutrient concentrations in 2009 but decreased silage TN and S concentra-tions and yields in 2010 (Table 5). When CQuest biochar was added to slightly acidic soils, Elmer and Pignatello (2011) also reported a decrease in TN in a subse-quent asparagus crop relative to the con-trol, but, unlike the current study, they saw an increase in asparagus S concentrations. Other fi eld studies using diff erent biochars and conducted on acidic soils reported that biochar yields were the same as or greater than controls in the second year after bio-char application (Steiner et al., 2007, 2008; Gaskin et al., 2010).
Based on nutrient concentration in the silage corn, the yield reduction in 2010 may have resulted from reduced availabil-ity or uptake of one or more nutrients. Th e silage N concentrations for all treatments in 2010 were below typical levels of 10 to 15 mg kg−1 (Patni and Culley, 1989;
Eghball et al., 2004), and the biochar silage contained the least N of all treatments. Silage S concentrations were also low, and S defi ciency produces chlorotic symptoms in corn similar to that of N defi ciency; how-ever, the N in biochar corn did not increase with decreased S intake, suggesting that S availability was not limiting (Stewart and Porter, 1969). Finally, Mn and Cu concen-trations in biochar silage were below the typical range for Idaho (Mahler, 2004); although concentrations were not always
signifi cantly diff erent from other treatments, reduced Mn and Cu uptake may have contributed to reduced yields.
In the current study, the belated eff ect of biochar on corn silage N, micronutrient uptake, and yield suggests (i) that the mechanism involved was delayed until the amendment had
Fig. 3. The eff ect of organic amendments on 0- to 30-cm soil concentrations. (a–f)
Diethylenetriaminepentaacetic acid–extractable Cu (a), Fe (b), Mg (c), and Zn (d); soil electrical conductivity (e); and soil pH (f). Amendments were added immediately after the November 2008 soil sampling. Error bars represent 95% confi dence limits on the treatment means.
Table 3. Soil chemical properties for 0- to 30-cm depth as aff ected by amendment classes across all sampling times for two contrast tests.
Class
comparison† NH4–N NO3–N
Olsen P
DTPA‡ K
DTPA Na
DTPA Mg
DTPA Cu
DTPA Fe
DTPA Mn
DTPA
Zn EC§ pH
Total C
Total organic
C
Total N
——————————————————— mg kg−1 ——————————————————— S m−1 ——— g kg−1———
Manure 5.4a¶ 8.3a 49.6a 182a 81a 250a 1.8a 5.0 9.0a 3.0a 0.06a 7.67 20.6a 11.1a 1.09a
No manure 3.9b 4.2b 28.4b 110b 48b 236b 1.5b 4.9 7.8b 2.5b 0.04b 7.70 18.5b 9.5b 0.97b
Biochar 10.3 7.3 43.2 147 64 242 1.6 5.3 9.6a 2.8 0.05 7.70 21.3a 11.7a 1.04
No biochar 9.8 9.5 41.0 146 65 244 1.6 5.2 7.8b 2.7 0.05 7.68 17.8b 8.8b 1.02
† Classes compared comprise the following treatments: manure = manure, combined manure+biochar; no manure = control, biochar; biochar = biochar, manure+biochar; no biochar = control, manure.
‡ Diethylenetriaminepentaacetic acid.
§ Electrical conductivity.
Table 4. The infl uence of amendments on silage corn mineral concentrations for years 2009 and 2010.
Source of variation Year B Al Cu Fe Mn Zn S Mg Ca P K C N Silage
yield
——————————————————————————— P values† ———————————————————————————
Amendment‡ 2009 ns§ ns ns ns ns ns ns ns ns ns ns ns ns ns
2010 ns ns * ns ns ns *** ns ns ns ns ns * **
Contrasts¶
Manure vs. no-manure
2009 ns ns ns ns ns ns ns ns ns ns ns ns ns ns
2010 ns ns ** ns * ns *** * ns ns * * * **
Biochar vs. no biochar
2009 * ns ns ns ns ns ns ns ns ns ns ns ns ns
2010 ns ns ns ns ns ns ns ns ns ns ns ns ns ns
† The signifi cance of P-values for treatment eff ect and single-degree-of-freedom contrasts were derived from an ANOVA (* P < 0.05; ** P < 0.01; *** P < 0.001).
‡ This factor includes control, manure, biochar, and combined biochar+manure amendment treatments.
§ Nonsignifi cant (P > 0.05).
¶ Classes compared comprise the following treatments: manure = manure, combined manure+biochar; no manure = control, biochar; biochar = bio-char, manure+biochar; no biochar = control, manure.
Table 5. Macronutrient, micronutrient, and total nitrogen and carbon concentrations in above-ground crop tissue and silage corn yield for 2009 and 2010. Values are given for treatments and classes associated with the contrast test that was most signifi cant across the uptake components.
Amendment/ class
Mg Ca P K C N S
2009 2010 2009 2010 2009 2010 2009 2010 2009 2010 2009 2010 2009 2010
——————————————————————— g kg−1 dry wt ——————————————————————— mg kg−1 dry wt
Control 1.42 1.25 1.91 1.57 1.39 1.50 7.21 8.53 440 439 12.5 8.0a† 458 373b
Manure 1.47 1.44 1.93 1.95 1.58 1.51 7.90 11.29 431 442 12.4 8.7a 470 432a
Biochar 1.45 1.32 2.11 1.97 1.46 1.49 6.82 10.71 441 441 12.2 5.4b 469 348c
Biochar+manure 1.40 1.43 1.95 1.84 1.5 1.78 6.67 11.08 441 432 12.8 9.2a 460 464a
Contrasts‡
Manure 1.44 1.43a 1.94 1.90 1.54 1.64 7.28 11.19a 436 437 12.6 9.0a 466 449a
No manure 1.43 1.29b 2.01 1.77 1.43 1.49 7.02 9.62b 440 440 12.4 6.7b 466 361b
Al Cu Fe Mn Zn B Silage yield
(dry wt)
———————————————————————— mg kg−1 dry wt ———————————————————————— — Mg ha−1—
Control 73 69 1.6 1.2bc† 77 79 35 19 20 17 6.7 11.3 18.1 19.1a
Manure 67 90 2.5 2.1a 75 95 41 27 19 20 6.0 14.3 18.0 21.2a
Biochar 86 102 1.6 1.2c 92 102 37 16 19 17 9.3 11.5 19.45 13.2b
99 1.6 1.6b 77 104 38 24 21 20 9.6 10.5 18.6 21.6a
Biochar+manure 70 Contrasts
Manure 69 95 1.6 1.9a 85 100 39 25a 20 20 7.8 12.4 18.3 21.4a
No manure 80 85 2.1 1.2b 76 91 36 18b 20 17 8.0 11.4 18.6 16.2b
† For a given soil parameter, treatment class means followed by the same letter are not signifi cantly diff erent (P < 0.05). Letters are not displayed if the eff ect was not signifi cant in the ANOVA (Table 7).
‡ Classes compared comprise the following treatments: manure = manure, combined manure+biochar treatments; no manure = control, biochar.
Table 6. The infl uence of amendments on mineral uptake in silage corn for 2009 and 2010.
Treatment Year B Al Cu Fe Mn Zn S Mg Ca P K C N
—————————————————————————— P values† ———————————————————————————
Amendment‡ 2009 ns§ ns ns ns ns ns ns ns ns ns ns ns ns
2010 ns ns ** * * ns *** ** ns ns *** ** **
Contrasts¶
Manure vs. no-manure
2009 ns ns ns ns ns ns ns ns ns ns ns ns ns
2010 * * *** ** ** * *** ** * * *** ** **
Biochar vs. no biochar
2009 * ns ns ns ns ns ns ns ns ns ns ns ns
2010 * ns ns ns ns ns * ns ns ns ns ns ns
† The signifi cance of P values for treatment eff ect and single-degree-of-freedom contrasts were derived from an ANOVA (* P < 0.05; ** P < 0.01; *** P < 0.001).
‡ This factor includes control, manure, biochar, and biochar+manure treatments.
§ Nonsignifi cant (P > 0.05).
aged or (ii) that biochar interacted with an unknown factor in 2010 (as compared with 2009) that altered its infl uence on the soil or crop. Some properties or eff ects of soil-applied bio-char are time dependent. Cheng et al. (2008) reported that the nature of biochar surface chemistry changes after a year of resi-dence in soil. Time may also be required for bacteria to popu-late biochar pores. Because of the biochar’s small pore size, the inhabiting bacteria may be protected from grazers and preda-tors, preventing the bacterial biomass from becoming available for plant uptake (Clarholm, 1985; Lehmann et al., 2011).
Biochar’s eff ect on soil respiration and in some cases soil priming (i.e., accelerated mineralization of less recalcitrant soil OC in response to the addition of new C) appears to be time dependent, particularly in soils with low OC. An initial fl ush of soil microbial growth, respiration, and N immobilization occurs in the fi rst 1 to 2 wk after biochar addition, and bio-char with high volatile matter contents produces a greater and longer fl ush than low-volatile-matter biochar (Deenik et al., 2010). Smith et al. (2010) concluded that pyrolysis-derived condensates adhering to the biochar during cooling are the source of labile C that support this immediate increase in soil respiration. Four to fi ve days after application, little if any of the added biochar C continued to be mineralized (Smith et al., 2010). In the longer term, biochars produced from hardwoods at high temperatures (like CQuest) and added to low OC soils were found to have little eff ect on soil priming in the fi rst year after application. However, in the second year the biochar had a negative priming eff ect (i.e., the soil C was stabilized and its rate of mineralization was reduced) (Zimmerman et al., 2011). If CQuest amendment caused a second-year reduction in min-eralization in the current study, it could have contributed to the observed decrease in N and S availability, uptake, and yield.
In 2009 biochar treatments as a class increased corn silage B concentrations relative to treatments without biochar (Table
5). For all treatments, the silage B concentrations were on the low end of the typical range (15–90 mg kg−1) but above the 9
mg kg−1 value thought to indicate defi ciency (Adriano, 1986).
Th us, the enhanced B uptake from biochar did not present a toxicity problem and may have contributed to the trending mean silage yield increase for biochar relative to the control in 2009 (Table 5).
Corn Silage Nutrient Uptake
In 2010, the biochar-induced reduction in uptake of Mg, TN, TC, Cu, and S (Table 7) by corn silage relative to the control was largely caused by a corresponding yield reduction. Th e exception was for S and TN, where accompanying reduced bio-mass nutrient concentrations contributed to the uptake reduc-tion. Th e increased nutrient uptake in manure-treated 2010 corn silage (Table 7) was primarily caused by a correspond-ing increase in biomass nutrient concentrations, although the mean 2010 manure silage yield was slightly greater than that for the control and contributed some to the increased uptake.
Conclusions
Th e addition of hardwood-derived biochar to irrigated calcare-ous soils increased soil TC and TOC concentrations over the 2-yr period and may have inhibited mineralization of manure C when both were added to soil simultaneously. Biochar and manure produced a synergistic increase in available soil Mn in the fi rst year (relative to the control), suggesting that at least two processes control Mn availability in the combined treat-ment. Biochar eff ects on calcareous soils were unlike those reported for acidic profi les in that pH changes and increases in available P and cations were not observed. Biochar did not aff ect corn silage nutrient concentrations or yields in year 1, but in year 2 biochar decreased silage TN and S concentrations and yield as well as cumulative uptake of TN, Mg, Cu, Mn,
Table 7. The uptake of macro- and micronutrient in corn silage for 2009 and 2010. Values are given for treatments and classes associated with the contrast test that was most signifi cant across the uptake components.
Mg Ca P K S N C
2009 2010 2009 2010 2009 2010 2009 2010 2009 2010 2009 2010 2009 2010
——————————————————————— kg ha−1 (dry wt) ———————————————————————— — Mg ha−1—
Control 25.5 24.1b† 34.4 29.9 25.2 29.2 130.1 163b 8.3 7.9 8.4a
Manure 26.5 34.8 42.0 28.4 32.6 142.6 240a 8.5 7.8 9.4a
Biochar 28.3 41.2 25.6 28.4 19.8 133.0 139b 9.1 8.5 5.8b
Biochar+manure 26.1
30.9a 17.4c
31.0a 36.4 39.9 27.9 38.7 124.2 241a 8.6
7.2b 227.8 153.3b
9.3a 220.5 184.3a
4.6c 235.2 74.9c
10.1a 242.5 200.4a 8.2 9.4a Contrasts ‡
Manure 26.3 31.0a 35.6 41.0a 28.1 8.5 8.0 9.5a
No manure 26.9 20.7b 37.8 27.8b 26.7
35.6a 124.2 240a 24.5b 135.2 151b 8.7
9.7a 231.5 192a
5.9b 232.2 114b 8.3 7.1b
Al Cu Fe Mn Zn B
2009 2010 2009 2010 2009 2010 2009 2010 2009 2010 2009 2010
Control 1.32 1.39 0.03 0.02c 1.39 1.53b 0.64 0.36bc 0.36 0.34 0.12 0.22b
Manure 1.25 1.93 0.04 0.05a 1.36 2.03a 0.74 0.58a 0.35 0.43 0.11 0.30a
Biochar 1.72 1.44 0.03 0.01c 1.78 1.41b 0.73 0.21c 0.38 0.23 0.18 0.15b
2.38 0.03 0.03b 1.43 2.42a 0.70 0.51ab 0.39 0.44 0.18 0.23a Biochar+manure 1.35
Contrasts
Manure 1.52 2.15a 0.03 0.04a 1.40 2.23a 0.72 0.54a 0.37 0.43a 0.15 0.26a
No manure 1.30 1.41b 0.03 0.02b 1.59 1.47b 0.68 0.29b 0.37 0.28b 0.15 0.19b
† For a given soil parameter, treatment class means followed by the same letter are not signifi cantly diff erent (P < 0.05). Letters are not displayed if the eff ect was not signifi cant in the ANOVA.
and S and was accompanied by general foliar chlorosis. Th is was consistent with a biochar-induced, second-year reduction in soil C mineralization rate like that observed in low-OC soils by Zimmerman et al. (2011), which may have reduced soil N and S availability in year 2. Our results suggest that biochar application to calcareous soils should be monitored closely in case fertility management adjustments are needed to achieve yield targets. Further research is needed to determine longer-term impacts of biochar on these soils.
Acknowledgments
We thank Drs. David Granatstein and Hal Collins and several anonymous reviewers for helpful comments on an initial draft of the manuscript; Mr. Larry Freeborn and Ms. Mary Ann Kay for technical support; and Evan Albright, Alexis Folkinga, and Lisa Romer for able assistance in the laboratory and fi eld.
References
Abou-Shanab, R.A., J.S. Angle, T.A. Delorme, R.L. Chaney, P. van Berkum, H. Moawad, K. Ghanem, and H.A. Ghozlan. 2003. Rhizobacterial
ef-fects on nickel extraction from soil and uptake by Alyssum murale. New
Phytol. 158:219–224. doi:10.1046/j.1469-8137.2003.00721.x Adriano, D.C. 1986. Trace elements in the terrestrial environment. Springer,
New York.
Atkinson, C.J., J.D. Fitzgerald, and N.A. Hipps. 2010. Potential mechanisms for achieving agreicultural benefi ts from biochar application to temperate soils: A review. Plant Soil 337:1–18. doi:10.1007/s11104-010-0464-5 Blackwell, P., E. Krull, G. Butler, A. Herbert, and Z. Solaiman. 2010. Eff ect of
banded biochar on dryland wheat production and fertilizer use in south-western Australia: An agronomic and economic perspective. Aust. J. Soil Res. 48:531–545. doi:10.1071/SR10014
Burger, M., and L.E. Jackson. 2003. Mibrobial immobilization of ammonium and nitrate in relation to ammonifi cation and nitrifi cation rates in or-ganic and conventional cropping systems. Soil Biol. Biochem. 35:29–36. doi:10.1016/S0038-0717(02)00233-X
Chan, K.Y., L. van Zwieten, I. Meszaros, A. Downie, and S. Joseph. 2007. Agronomic values of greenwaste biochar as a soil amendment. Aust. J. Soil Res. 45:629–634. doi:10.1071/SR07109
Cheng, C., J. Lehmann, and M.H. Engelhard. 2008. Natural oxidation of black carbon in soils: Changes in molecular form and surface charge along a climosequence. Geochim. Cosmochim. Acta 72:1598–1610. doi:10.1016/j.gca.2008.01.010
Chidumayo, E.N. 1994. Eff ects of wood carbonization on soil and initial de-velopment of seelings in miombo woodland, Zambia. For. Ecol. Man-age. 70:353–357. doi:10.1016/0378-1127(94)90101-5
Clarholm, M. 1985. Interactions of bacteria, protozoa and plants leading to mineralization of soil nitrogen. Soil Biol. Biochem. 17:181–187. doi:10.1016/0038-0717(85)90113-0
Clough, T.J., and L.M. Condron. 2010. Biochar and the nitrogen cycle: Intro-duction. J. Environ. Qual. 39:1218–1223.
DeLuca, T.H., M.D. MacKenzie, M.J. Gundale, and W.E. Holben. 2006. Wildfi re-produced charcoal directly infl uences nitrogen cycling in pon-derosa pine forests. Soil Sci. Soc. Am. J. 70:448–453. doi:10.2136/ sssaj2005.0096
Deenik, J.L., T. McClellan, G. Uehara, M.J. Antal, and S. Campbell. 2010. Charcoal volatile matter content infl uences plant growth and soil nitro-gen transformations. Soil Sci. Soc. Am. J. 74:1259–1270. doi:10.2136/ sssaj2009.0115
Dumroese, R.K., J. Heiskanen, K. Englund, and A. Tervahauta. 2011. Pel-leted biochar: Chemical and physical properties show potential use as a substrate in container nurseries. Biomass Bioenergy 35:2018–2027. doi:10.1016/j.biombioe.2011.01.053
Eghball, B., D. Ginting, and J.E. Gilley. 2004. Residual eff ects of manure and compost applications on corn production and soil properties. Agron. J. 96:442–447. doi:10.2134/agronj2004.0442
Eghball, B., B.J. Wienhold, J.E. Gilley, and R.A. Eigenberg. 2002. Mineraliza-tion of manure nutrients. J. Soil Water Conserv. 57:470–473.
Eker, S., L. Ozturk, A. Yazici, B. Erenoglu, V. Romheld, and I. Cakmak. 2006. Foliar-applied glyphosate substantially reduced uptake and transport of iron and manganese in sunfl ower (Helianthus annuus L.) plants. J. Agric. Food Chem. 54:10019–10025. doi:10.1021/jf0625196
Elmer, W.H., and J.J. Pignatello. 2011. Eff ect of biochar amendment on my-corrhizal associations and Fusarium crown and root rot of asparagus in replant soils. Plant Dis. 10.1094/PDIS-10–10–0741.
Fierer, N., J.P. Schimel, R.G. Cates, and J. Zou. 2001. Infl uence of balsam poplar tannin fractions on carbon and nitrogen dynamics in Alaskan taiga fl oodplain soils. Soil Biol. Biochem. 33:1827–1839. doi:10.1016/ S0038-0717(01)00111-0
Gaskin, J.W., R.A. Speir, K.C. Das, R.D. Lee, L.A. Morris, and D.S. Fisher. 2010. Eff ect of peanut hull and pine chip biochar on soil nutrients, corn nutrient starus, and yield. Agron. J. 102:623–633. doi:10.2134/ agronj2009.0083
Gavlak, R., D. Hornect, R. Miller, and J. Kotuby-Amacher. 2003. Soil, plant, and water reference methods for the western region. 2nd ed. WCC-103 Publication, Fort Collins, CO.
Gundale, M.J., and T.H. De Luca. 2007. Charcoal eff ects on soil solution chemistry and growth of Koeleria macrantha in the ponderosa pine/ Douglas-fi r ecosystem. Biol. Fertil. Soils 43:303–311. doi:10.1007/ s00374-006-0106-5
Glaser, B., J. Lehmann, and W. Zech. 2002. Ameliorating physical and chemi-cal properties of highly weathered sols in the tropics with charcoal: A review. Biol. Fertil. Soils 35:219–230. doi:10.1007/s00374-002-0466-4 Husk, B., and J. Major. 2011. Biochar commercial agriculture fi eld trial in
Québec, Canada-year three: Eff ects of biochar on forage plant biomass quantity, quality and milk production. Available at http://www.blue-leaf.ca/main-en/fi les/BlueLeafBiocharForageFieldTrial-Year3Report.pdf (verifi ed 30 Sept. 2011).
Iswaran, V., K.S. Jauhri, and A. Sen. 1980. Eff ect of charcoal, coal, and peat on the yield of moong, soybean and pea. Soil Biol. Biochem. 12:191–192. doi:10.1016/0038-0717(80)90057-7
Kadota, M., and Y. Niimi. 2004. Eff ects of charcoal with pyroligneous acid and barnyard manure on bedding plants. Sci. Hortic. (Amsterdam) 101:327–332. doi:10.1016/j.scienta.2004.01.002
Khodadad, C.L.M., A.R. Zimmerman, S.J. Green, S. Uthandi, and J.S. Foster. 2011. Taxa-specifi c changes in soil microbial community composition induced by pyrogenic carbon amendments. Soil Biol. Biochem. 43:385– 392. doi:10.1016/j.soilbio.2010.11.005
Laird, D.A. 2008. Th e charcoal vision: A win-win-win scenario for
simulta-neously producing bioenergy, permanently sequestering carbon, while improving soil and water quality. Agron. J. 100:178–181. doi:10.2134/ agrojnl2007.0161
Laird, D.A., P. Flemming, D.D. Davis, R. Horton, B. Wang, and D.L. Kar-len. 2010. Impact of biochar amendments on the quality of a typical Midwestern agricultural soil. Geoderma 158:443–449. doi:10.1016/j. geoderma.2010.05.013
Lehmann, J., J.P. daSilva, Jr., C. Steiner, T. Nehls, W. Zech, and B. Glaser. 2003. Nutrient availability and leaching in an archaeological Anthrosol and Ferralsol of the Central Amazon basin: Fertilizer, manure and charcoal amendments. Plant Soil 249:343–357. doi:10.1023/A:1022833116184
Lehmann, J., M.C. Rillig, J. Th ies, C.A. Masiello, W.C. Hockaday, and D.
Crowley. 2011. Biochar eff ects on soil biota: A review. Soil Biol. Bio-chem. 10.1016/j.soilbio.2011.04.022.
Lentz, R.D., G.A. Lehrsch, B. Brown, J. Johnson-Maynard, and A.B. Leytem. 2011. Dairy manure nitrogen availability in eroded and noneroded soil for sugarbeet followed by small grains. Agron. J. 103:628–643. Lobell, D.B., K.G. Cassman, and C.B. Field. 2009. Crop yield gaps: Th eir
im-portance, magnitudes, and causes. Annu. Rev. Environ. Resour. 34:179– 204. doi:10.1146/annurev.environ.041008.093740
Mahler, R.L. 2004. General overview of nutrition for fi eld and container
crops. p. 26–29. In L.E. Riley, R.K. Dumroese, and T.D. Landis (eds.)
Nat. Proc. Forest and Conservation Nursery Associations—2003, Coeur d’Alene, ID, 9–12 June 2003 and Springfi eld, IL, 14–17 July 2003 (Proc. RMRS-P-33). USDA Forest Service, Fort Collins, CO.
Major, J., J. Lehmann, M. Rondon, and C. Goodale. 2010. Fate of soil-applied black carbon: Downward migration, leaching and soil respiration. Glob. Change Biol. 16:1366–1379. doi:10.1111/j.1365-2486.2009.02044.x Matovic, D. 2011. Biochar as a viable carbon sequestration option: Global and
Canadian perspective. Energy 10.1016/j.energy.2010.09.031.
Meek, B.D., A.J. MacKenzie, and L.B. Grass. 1968. Eff ects of organic matter, fl ooding time, and temperature on the dissolution of iron and manga-nese from soil in situ. Soil Sci. Soc. Am. Proc. 32:634–638. doi:10.2136/
sssaj1968.03615995003200050018x
Mulvaney, R.L. 1996. Nitrogen: Inorganic forms. p. 1123–1184. In D.L.
Sparks (ed.) Methods of soil analysis. Part 3. Chemical methods. SSSA Book Ser. 5. SSSA, Madison, WI.
Namgay, T., B. Singh, and B.P. Singh. 2010. Infl uence of biochar application to soil on the availability of As, Cd, Cu, Pb, and Zn to maize (Zea mays
L.). Aust. J. Soil Res. 48:638–647. doi:10.1071/SR10049
Novak, J.M., W.J. Busscher, D.L. Laird, M. Ahmedna, D.W. Watts, and M.S.S. Niandou. 2009a. Impact of biochar amendment on fertility of a southeastern coastal plain soil. Soil Sci. 174:105–112. doi:10.1097/ SS.0b013e3181981d9a
Novak, J.M., I. Lima, B. Xing, J.W. Gaskin, C. Steiner, K.C. Das, M. Ahmed-na, D. Rehrah, D.W. Watts, W.J. Busscher, and H. Schomberg. 2009b. Characterization of designer biochar produced at diff erent temperatures and their eff ects on a loamy sand. Ann. Environ. Sci. 3:195–206. Patni, N.K., and J.L.B. Culley. 1989. Corn silage yield, shallow groundwater
quality and soil properties under diff erent methods and times of manure application. Trans. ASABE 32:2123–2129.
Pietikainen, J., O. Kiikkila, and H. Fritze. 2000. Charcoal as a habitat for microbes and its eff ect on the microbial community of the underlying humus. Oikos 89:231–242. doi:10.1034/j.1600-0706.2000.890203.x Robbins, C.W., L.L. Freeborn, and D.T. Westermann. 2000.
Organ-ic phosphorus source eff ects on calcareous soil phosphorus and organic carbon. J. Environ. Qual. 29:973–978. doi:10.2134/ jeq2000.00472425002900030036x
Rondon, M.A., J. Lehmann, J. Ramirez, and M. Hurtado. 2007. Biological nitrogen fi xation by common beans (Phasiolus vulgaris L.) increases with biochar additions. Biol. Fertil. Soils 43:699–708. doi:10.1007/ s00374-006-0152-z
SAS Institute. 2008. SAS for Windows, version 9.2 [CD-ROM]. SAS Inst., Cary, NC.
Sherrod, L.A., G. Dunn, G.A. Peterson, and R.L. Kolberg. 2002. Inorganic carbon analysis by modifi ed pressure-calcimeter method. Soil Sci. Soc. Am. J. 66:299–305. doi:10.2136/sssaj2002.0299
Smith, J.L., H.P. Collins, and V.L. Bailey. 2010. Th e eff ect of young biochar on soil respiration. Soil Biol. Biochem. 42:2345–2347. doi:10.1016/j. soilbio.2010.09.013
Solaiman, Z.M., P. Blackwell, L.K. Abbott, and P. Storer. 2010. Direct and residual eff ect of biochar application on mycorrhizal root coloniza-tion, growth, and nutrition of wheat. Aust. J. Soil Res. 48:546–554. doi:10.1071/SR10002
Soltanpour, P.N., G.W. Johnson, S.M. Workman, J.B. Jones, Jr., and R.O. Miller. 1996. Inductively coupled plasma emission spectrometry and
inductively coupled plasma-mass spectrometry. p. 91–139. In D.L.
Sparks (ed.) Methods of soil analysis. Part 3. Chemical methods. SSSA, Madison, WI.
Spokas, K.A., W.C. Koskinen, J.M. Baker, and D.C. Reicosky. 2009. Impacts of woodchip biochar additions on greenhouse gas production and sorp-tion/degradation of two herbicides in a Minnesta soil. Chemosphere 77:574–581. doi:10.1016/j.chemosphere.2009.06.053
Spokas, K.A., J.M. Baker, and D.C. Reicosky. 2010. Ethylene: Potential key for biochar amendment impacts. Plant Soil 333:443–452. doi:10.1007/ s11104-010-0359-5
Steiner, C., B. Glaxer, W.G. Telxeira, J. Lehmann, W.E.H. Blum, and W. Zech. 2008. Nitrogen retention and plant uptake on a highly weathered central Amazonian Ferralsol amended with compost and charcoal. J. Plant Nutr. Soil Sci. 171:893–899. doi:10.1002/jpln.200625199
Steiner, C., W.G. Teixeira, J. Lehmann, T. Nehls, J.L.V. Macedo, W.E.H. Blum, and W. Zech. 2007. Long term eff ects of manure, charcoal and mineral fertilization on crop production and fertility on a highly weathered Central Amazonian upland soil. Plant Soil 291:275–290. doi:10.1007/s11104-007-9193-9
Stewart, B.A., and L.K. Porter. 1969. Nitrogen–sulfur relationships in wheat ( Triti-cum aestivum L.), corn (Zea mays), and beans (Phaseolus vulgaris). Agron. J.
61:267–271. doi:10.2134/agronj1969.00021962006100020027x Tryon, E.H. 1948. Eff ect of charcoal on certain physical, chemical, and
biological properties of forest soils. Ecol. Monogr. 18:81–115. doi:10.2307/1948629
U.S. Geological Survey. 1975. Geochemistry of soils in the U.S. Available at http://tin.er.usgs.gov/pluto/soil/ (verifi ed 1 Oct. 2011).
Uusitalo, M., V. Kitunen, and A. Smolander. 2008. Response of C and N transformations in birch soil to coniferous resin volatiles. Soil Biol. Bio-chem. 40:2643–2649. doi:10.1016/j.soilbio.2008.07.009
van Zwieten, L., S. Kimber, A. Downie, S. Morris, S. Petty, J. Rust, and K.Y. Chan. 2010. A glass house study on the interaction of low mineral ash biochar with nitrogen in sandy soil. Aust. J. Soil Res. 48:569–576. doi:10.1071/SR10003
Wardle, D.A., O. Zackrisson, and M.-C. Nilsson. 1998. Th e charcoal eff ect
in Boreal forests: Mechanisms and ecological consequences. Oecologia 115:419–426. doi:10.1007/s004420050536
Warnock, D.D., J. Lehmann, T.W. Kuyper, and M.C. Rillig. 2007. Mycor-rhizal responses to biochar in soil-concepts and mechanisms. Plant Soil 300:9–20. doi:10.1007/s11104-007-9391-5
Woolf, D., J.E. Amonette, F.A. Street-Perrott, J. Lehmann, and S. Joseph. 2010. Sustainable biochar to mitigate global climate change. Nature Commun. 1:56. doi:10.1038/ncomms1053