R E S E A R C H A R T I C L E
Open Access
Large-scale external validation and
comparison of prognostic models: an
application to chronic obstructive
pulmonary disease
Beniamino Guerra
1, Sarah R. Haile
1, Bernd Lamprecht
2,3, Ana S. Ramírez
4, Pablo Martinez-Camblor
5,
Bernhard Kaiser
6, Inmaculada Alfageme
7, Pere Almagro
8, Ciro Casanova
9, Cristóbal Esteban-González
10,
Juan J. Soler-Cataluña
11, Juan P. de-Torres
12, Marc Miravitlles
13, Bartolome R. Celli
14, Jose M. Marin
15,
Gerben ter Riet
16, Patricia Sobradillo
17, Peter Lange
18, Judith Garcia-Aymerich
19, Josep M. Antó
20, Alice M. Turner
21,
Meilan K. Han
22, Arnulf Langhammer
23, Linda Leivseth
24, Per Bakke
25, Ane Johannessen
26, Toru Oga
27,
Borja Cosio
28, Julio Ancochea-Bermúdez
29, Andres Echazarreta
30, Nicolas Roche
31, Pierre-Régis Burgel
32,
Don D. Sin
33, Joan B. Soriano
34,35, Milo A. Puhan
36,37*and for the 3CIA collaboration
Abstract
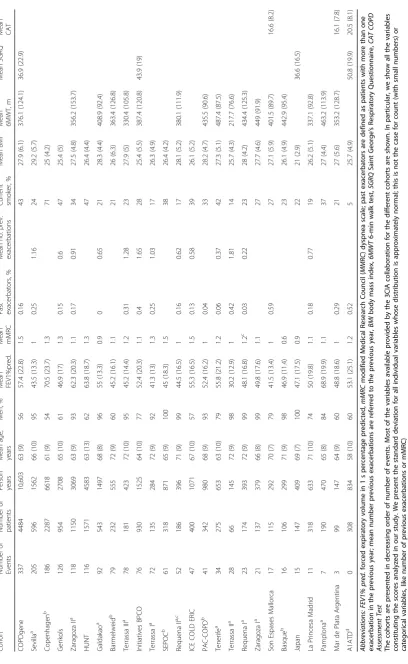
Background:External validations and comparisons of prognostic models or scores are a prerequisite for their use in routine clinical care but are lacking in most medical fields including chronic obstructive pulmonary disease (COPD). Our aim was to externally validate and concurrently compare prognostic scores for 3-year all-cause mortality in mostly multimorbid patients with COPD.
Methods: We relied on 24 cohort studies of the COPD Cohorts Collaborative International Assessment consortium, corresponding to primary, secondary, and tertiary care in Europe, the Americas, and Japan. These studies include globally 15,762 patients with COPD (1871 deaths and 42,203 person years of follow-up). We used network meta-analysis adapted to multiple score comparison (MSC), following a frequentist two-stage approach; thus, we were able to compare all scores in a single analytical framework accounting for correlations among scores within cohorts. We assessed transitivity, heterogeneity, and inconsistency and provided a performance ranking of the prognostic scores.
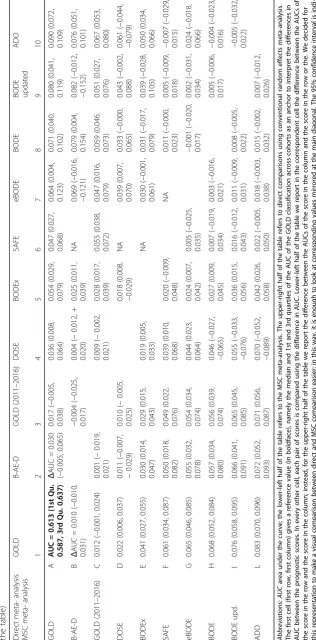
Results:Depending on data availability, between two and nine prognostic scores could be calculated for each cohort. The BODE score (body mass index, airflow obstruction, dyspnea, and exercise capacity) had a median area under the
curve (AUC) of 0.679 [1st quartile–3rd quartile = 0.655–0.733] across cohorts. The ADO score (age, dyspnea, and airflow
obstruction) showed the best performance for predicting mortality (difference AUCADO –AUCBODE = 0.015
[95% confidence interval (CI) =−0.002 to 0.032];p= 0.08) followed by the updated BODE (AUCBODE updated–AUCBODE
= 0.008 [95% CI =−0.005 to +0.022];p= 0.23). The assumption of transitivity was not violated. Heterogeneity across
direct comparisons was small, and we did not identify any local or global inconsistency. (Continued on next page)
* Correspondence:[email protected] 36
Epidemiology, Biostatistics and Prevention Institute, University of Zurich, Hirschengraben 84, Room HRS G29, CH -8001 Zurich, Switzerland 37Epidemiology & Department of Epidemiology, Johns Hopkins Bloomberg School of Public Health, Baltimore, MD, USA
Full list of author information is available at the end of the article
© The Author(s). 2018Open AccessThis article is distributed under the terms of the Creative Commons Attribution 4.0
International License (http://creativecommons.org/licenses/by/4.0/), which permits unrestricted use, distribution, and
(Continued from previous page)
Conclusions:Our analyses showed best discriminatory performance for the ADO and updated BODE scores in patients with COPD. A limitation to be addressed in future studies is the extension of MSC network meta-analysis to measures of calibration. MSC network meta-analysis can be applied to prognostic scores in any medical field to identify the best scores, possibly paving the way for stratified medicine, public health, and research.
Keywords:COPD, Prognostic scores, Large-scale external validation, Performance comparison, Network meta-analysis
Background
Prognostic scores, commonly based on coefficients from regression models, provide a probability of a certain ad-verse outcome for an individual over a specified time horizon. Prognostic scores have become increasingly popular over the last two decades [1–5]. They serve multiple purposes such as informing individuals and health care providers about disease and outcome risks, supporting risk-stratified and personalized prevention or treatment decisions, identifying participants for research, or adjusting for confounding [6–9].
Numerous prognostic models have been developed in various fields of medicine [10–13]. Just for predict-ing the risk of cardiovascular disease in the general population, a recent review identified 363 prognostic models or scores [14]. For patients with chronic obstructive pulmonary disease (COPD), prognostic scores have been developed mostly to predict the risk of death [15–30], but scores also exist to predict exacerbations [31] or deteriorating of health-related quality of life [27, 32].
Major obstacles for using prognostic scores in practice and research are, however, the frequent lack of external val-idations, comparisons of their predictive performance, and assessments of their applicability in practice [2, 33–38]. Practitioners and researchers are left with uncertainty about which prognostic score to use and may be reluctant to use them at all [39]. Ideally, prognostic scores would be externally validated in several different populations and their performance summarized [40,41]. However, such ex-ternal validations and concurrent comparisons are rarely performed [42]. In addition, for even more comprehensive comparison, the performance of prognostic scores may be compared indirectly using common comparator scores similar to network meta-analysis (NMA) [43–48] of randomized trials.
Our aim was to use multiple score comparison (MSC) in order to externally validate and concurrently compare prognostic scores for 3-year mortality in patients with COPD.
Methods
We followed a prespecified study protocol and described the detailed statistical methods elsewhere [43].
Study design and participants
This study was based on 26 cohort studies of the COPD Cohorts Collaborative International Assessment (3CIA) consortium. Details have been reported elsewhere (and summarized in Table 2) [49]. All cohorts were approved by ethics committees, and participants gave written informed consent [49]. We also included the Phenotype and Course (PAC)-COPD and Copenhagen cohorts in the final database, even if they were used in the large-scale update of the ADO (age, dyspnea, and airflow obstruction) index [15]. We considered this approach reasonable, since they form only a small part of the final database, but we verified in a sensitivity analysis if they affected the results.
Prognostic scores
Table
1
Scoring
rules
of
prognostic
scores
to
predict
mortality
in
patients
with
COPD
(Continued)
Sco
re
Predi
ctor
GOLD
[
50
,
51
]
GOLD
(2011
–
2016)
[
51
]
BODE
[
17
]
BODE
upd
.
[
16
]
ADO
[
15
]
e-BODE
[
18
]
BODEx
[
18
]
DOSE
[
27
]
SAFE
[
28
]
B-A
E-D
[
23
]
Q
uality
of
life
(SGRQ)
0
(<=
30)
1
(31
–
49)
2
(50
–
64)
3
(>
=
65)
Tot
al
sco
re
0
–
30
–
30
–
10
0
–
15
0
–
14
0
–
12
0
–
90
–
80
–
90
–
26
Abbreviations:
BMI
body
mass
index,
FEV1%
pred.
forced
expiratory
volume
in
1
s
percentage
predicted,
mMRC
modified
Medical
Research
Council
dyspnea
scale,
6MWT
6-min
walk
test,
CAT
COPD
Assessment
Test
,
SGRQ
Saint
George
’
s
Respiratory
Questionnaire;
previous
exacerbations
are
referred
to
the
previous
year,
GOLD
Global
Initiative
for
Chronic
Obstructive
Lung
Disease,
BODE
body
mass
index,
airflow
obstruction,
dyspnea
and
severe
exacerbations,
BODE
upd.
BODE
updated,
ADO
age,
dyspnea,
airflow
obstruction
(we
use
in
our
analysis
the
updated
version
of
the
ADO
score),
e-BODE
severe
acute
exacerbation
of
COPD
plus
BODE,
BODEx
body
mass
index,
airflow
obstruction,
dyspnea,
severe
acute
exacerbation
of
COPD,
DOSE
dyspnea,
obstruction,
smoking,
and
exacerbation
frequency,
SAFE
Saint
George
’
s
Respiratory
Questionnaire
(SGRQ)
score,
air--flow
limitation
and
exercise
capacity,
B-AE-D
body
mass
index,
acute
exacerbations,
dyspnea
(we
use
the
optimized
version
of
the
score,
introduced
in
the
same
paper).
Missing
cells
correspond
to
v
ariables
that
do
not
constitute
the
score
of
the
correspondent
Outcome and performance measure for external validation and comparison of prognostic scores
We evaluated a number of performance measures commonly used to assess the prognostic properties of prediction models and scores [43]. We deemed the area under the curve (AUC) to be the most appropriate per-formance measure for our purposes, mainly because its range is independent of the data, it is easy to interpret, and an analytic formula for its variance is available [52].
Statistical analysis
We followed a prespecified study protocol. We first per-formed direct head-to-head comparisons using random effects meta-analysis and then examined the network evidence merging all available direct and indirect evi-dence [53]. We used a novel methodology, i.e., MSC meta-analysis, adapted from multiple treatment com-parison network meta-analysis [54, 55]. Methodological details are reported in the section“Detailed Methods”in Additional file 1and in a recent paper [43]. R codes are available (provided in the section “R Code for MSC meta-analysis”in Additional file1).
Direct comparisons (random effects pairwise meta-analysis)
We directly compared prognostic scores by pairwise ran-dom effects meta-analysis [56,57]. We used forest plots to visually investigate statistical heterogeneity as well as the I2 statistic. Such standard meta-analysis has limita-tions, since it does not take into account the correlations among multiple scores evaluated on the same set of pa-tients [58], and it does not give a clear indication of which prognostic score performs best. Thus, we adopted network meta-analysis, an approach that allowed us to weight and then pool the results coming from different cohorts.
MSC meta-analysis
Methodological details are reported in detail in [43]. In brief, we used an example of implementation of network meta-analysis for treatment effectiveness comparison [54], adapting it to our purposes, namely to concurrently externally validate and compare prognostic scores from individual patient data across different cohorts [43]. We have explicitly included correlations [58] between the scores on a cohort level. We use a frequentist two-stage meta-regression model, as proposed in [54]:
1. Ordinary meta-analysis (stage I) to obtain the direct estimates for pooled differences in AUC (using the inverse-variance weighted means of the corresponding cohorts). The meta-analyses were done within each group of cohorts where data for the same prognostic scores were available.
2. In stage II, we merged the estimates for the differences in AUC from the groups of cohorts, looking for the weighted least squares solution to the regression problem equation. Based on the direct estimates and their variances from the first stage, we estimated the pooled differences in AUC that obeyed fundamental consistency equations. Thus in stage II, the stage I estimates for the differences in AUC were combined across groups of cohorts to give overall performance estimates for the entire network.
In order to provide a ranking of the scores, we used a fre-quentist version of the surface under the cumulative ranking curve (SUCRA) [59,60] score showing the likelihood of the score to be better than any other score and summarizing relative performances and confidence intervals.
The last steps were to ensure that the heterogeneity, transitivity, and consistency assumptions were met [46]. Heterogeneity in the MSC analysis was evaluated by the pooled heterogeneity variance among groups (τ2pooled). We
assessed “transitivity” through analysis of variance (ANOVA) tests. Thus, we assessed the comparability of the cohorts across whom the predictive performance of a score may vary because of a “spectrum effect” [61] or
“case mix”[37,62,63]. We also assessed consistency [46] between direct evidence and MSC meta-analysis estimates using the Q likelihood-ratio test statistic to evaluate the global consistency and analysis of residuals and leverages to evaluate the local consistency [54]. For more details, see“Detailed Methods”in Additional file1and [43].
Handling of missing data
If a variable was missing for > 30% of the patients, we discarded the specific variable for that particular specific cohort, since the effects of such predictors could be gen-erally distrusted [1]. Otherwise we performed multiple imputation with chained equations (the analysis of the patterns of missingness allowed us to consider the miss-ing data missmiss-ing completely at random apart from the dependence on the cohort) [4]. We combined the esti-mates of the 30 different analyses (one for each imputed dataset, for each of which we followed all the previously highlighted frequentist two-stage meta-regression model approaches) using Rubin’s rules.
Results
Cohort and participant characteristics
1.0 to 2.8 (the scale goes from 0 to 4, with 4 being the worst), mean number of exacerbations in the previous year (where available) from 0.2 to 1.7, and mean 6-min walk distance (where available) from 218 to 487 m.
Direct comparisons of prognostic scores for mortality in patients with COPD
The direct comparisons are shown in the upper-right triangle of Table 3, i.e., a league table (that also includes the MSC meta-analysis in the lower-left triangle). Forty-one direct comparisons of the AUC of prognostic scores were possible; indeed, no direct evidence was available for the comparison between SAFE and the eBODE, BODEx, DOSE, and B-AE-D scores (cells D6, E6, F2, G6, I10 in the league Table3).
The updated BODE score performed statistically signifi-cantly better than GOLD, new GOLD, and the B-AE-D scores, whereas the AUC of the updated BODE score was higher than for the other scores but not statistically signifi-cantly so. We deemed overall statistical heterogeneity of direct comparisons moderate. However, in our MSC meta-analysis the direct comparisons should be interpreted with caution, since they do not take into account that multiple scores were evaluated on the same set of patients and are thus likely to bias the interpretation of which prognostic score performs best [58].
Groups of cohorts evaluating the same prognostic scores
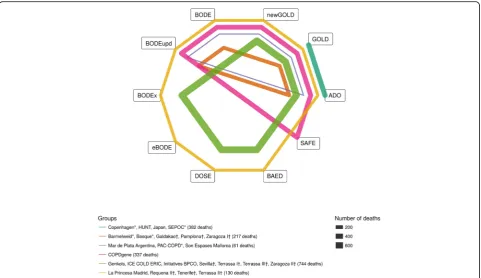
Grouping of cohorts where the same prognostic scores could be calculated was the first step to consider corre-lations introduced by predictions performed on the same sample of patients. Figure1shows the grouping of cohorts. In group 1 (constituting four cohorts: Copenhagen, HUNT, Japan, SEPOC, as shown in Fig.1) information on FEV1, age, and dyspnea was available to calculate the GOLD and ADO scores for each partici-pant. In contrast, group 6 consisted of four cohorts (La Princesa Madrid, Requena II, Tenerife, Terrassa II) where nine prognostic scores (all except for the SAFE score) could be calculated for each participant. Figure1
provides a visual representation of these groups together with the number of events (i.e., deaths). For example, the dark green line represents group 1 where the GOLD and ADO scores could be compared against each other. The closed polygons show the comparisons that are pos-sible for each group of cohorts. Group 6 is represented by the dark yellow polygon that includes nine scores. Thus, unlike multiple treatment network meta-analyses, where usually two or at most three treatments are compared in each trial, Fig.1shows that in each of the cohorts of our database we can compare between two and nine prognos-tic scores.
MSC meta-analysis of prognostic scores to predict 3-year mortality in patients with COPD
The lower-left part of Table3 shows all comparisons be-tween the AUCs of the 10 prognostic scores taking into account the correlation among multiple comparisons for the same patients as well as direct and indirect evidence of the entire network (Fig. 1). The median AUC of the GOLD classification of airflow obstruction severity was 0.613 (interquartile range 0.587 to 0.637) and is shown in boldface in the upper-left cell as an anchor to interpret the differences in AUC between the prognostic scores. Compared to GOLD, all prognostic scores showed statisti-cally significantly higher AUCs except for the B-AE-D and GOLD 2011–2016 (cells B1-L1 in Table3). Compared to the BODE score (the most commonly used prognostic score in COPD, median AUC 0.679 [interquartile range 0.655 to 0.733]), the ADO, updated BODE, and eBODE showed higher AUCs, whereas all other scores performed worse.
Figure2shows the comparisons of all scores against the BODE score and that the ADO score and the updated BODE performed better than the other scores (i.e., AUCADO–AUCBODE= +0.015 [95% CI–0.002 to 0.032],
p= 0.08; AUCBODE updated–AUCBODE= 0.008 [95% CI = −0.005 to +0.022];p= 0.23). The sensitivity analysis under-taken excluding from the database the two cohorts used in the large-scale update of the ADO index [15] shows no significant differences.
Heterogeneity, transitivity, and inconsistency
Global heterogeneity was relatively small (τ2pooled =
0.00011) (we did not use aτ2for each group (τ2g) since this
is not recommended when there are groups with a single cohort [54]). The groups of the MSC meta-analysis were balanced with regard to characteristics of the different co-horts that may modify the predictive performance of the scores (all a priori defined characteristics that were gener-ating case mix were not statistically significantly different across groups), and we could thus assume transitivity.
The consistency analyses did not suggest local or global inconsistency. Visual analysis of the Q-Q plot and studen-tized residuals indicated robust local consistency. The likelihood-ratio test statistic showed overall consistency (Q likelihood-ratio test = 25.29 ≅χ2(0.95, 16) = 26.30,p
value = 0.06).
Discussion
treatment decisions whose effectiveness may depend on life expectancy. Secondly, we presented a com-prehensive approach for external validation and con-current comparison of prognostic scores and its first application. MSC meta-analysis is a method adapted from network meta-analysis that meets the call for new approaches for external validation and
concurrent comparison of risk prediction models and scores that should take advantage of data sharing, individual patient data (IPD), and advanced analytical techniques [36, 37, 45, 64, 65].
In practice, the GOLD score using just lung function is still used most commonly to grade disease severity, which is traditionally related to prognosis as in other fields (e.g.,
Fig. 1Network plot. Network representing which prognostic scores belong to the different groups. Each node represents a score and each
closed polygon represents a group of cohorts where the same prognostic scores are available. The thickness of the lines represents the total number of deaths in the specific group
Fig. 2Comparison of AUC of prognostic scores. Difference in AUC (shown with confidence interval with 95% confidence level) among the
cancer). FEV1% pred. (thus, GOLD classification) is an important parameter at the population level in the predic-tion of important clinical outcomes such as mortality and hospitalization. The revised combined COPD assessment and their further developments integrate the severity of airflow limitation assessment, also providing information regarding symptom burden and risk of exacerbation [51]. However, the results of our analysis show that, when the aim is to predict mortality in individuals, other scores such as ADO, updated BODE, and eBODE are substan-tially better than the GOLD classifications (in our analysis, GOLD and GOLD 2011–2016). We note that the AUC for the best score (ADO) is 0.69, a moderately good dis-criminative performance; however, we can often not ex-pect a much higher discriminative performance in clinical settings (for instance, see [31]).
The predictive performance of a prognostic score is im-portant, but it is not the only criterion for choosing a prognostic score for practice. Indeed, with an eye towards applicability, the time, cost, and burden for patients and practitioners to measure the predictors of a prognostic score should be taken into consideration [66]. We deem a prognostic score such as ADO to be easily available if it only includes simple questions, easily available informa-tion from medical charts, and spirometry (performed for the diagnosis of COPD) [50,51].
Scores to predict mortality are also useful beyond esti-mating prognosis. Nowadays, no treatments to lower the risk of mortality are currently available for patients with COPD; thus, for this outcome, prediction scores cannot provide risk-stratified treatment guidance. However, prog-nostic scores may help to make randomized trials with all-cause mortality as primary outcome more efficient than previous trials by only including patients at higher risk [67]. Also, prognostic scores for all-cause mortality are par-ticularly attractive for multimorbid patients such as COPD patients, where cardiovascular disease, diabetes, renal dis-ease, and lung cancer, among other conditions,also contrib-ute to mortality [68,69]. Patients with COPD often receive less than optimal prevention and treatment of cardiovascu-lar disease, which may partly reflect a therapeutic nihilism. Of course, there are patients who are unlikely to benefit from long-term cardiovascular prevention because of short life expectancy. However, a prognostic score provides a better basis for decisions on cardiovascular prevention, lung cancer screening, or other treatments and may limit under- and over-treatment in COPD [1,70,71].
Many prognostic models and scores (as in the models’ simplified forms) are never validated in practice, and many investigators develop a second model instead of relying on existing scores at least as a starting point. Such practice has led to numerous prognostic scores for the same conditions that are left without external valid-ation. Thus, we introduced MSC meta-analysis, which
addresses the lack of external validation and compari-sons of prognostic scores by comparing their predictive performance in external validation cohorts and simul-taneously considering the entire network of direct and indirect comparisons. Thereby, it allows for a compari-son of predictive performance that is not limited by non-comparable spectrum of populations, as is com-monly the case when evaluating the results of independ-ent validation studies. MSC meta-analysis can be applied to any medical field, with the availability of individual patient data being the only major limiting factor.
Strengths of our study include the careful analytical approach to MSC meta-analysis and the availability of the R code, which allows for widespread use and poten-tial further development of the method. For the particu-lar application of MSC meta-analysis here, a major strength is the large high-quality database of the 3CIA collaboration with the broadest possible COPD patient spectrum. The diverse case mix and broad patient spectrum greatly increase the probability that our results are generalizable to all COPD patients. A limitation of the study is that, ideally, a network meta-analysis is con-ducted prospectively and jointly planned for all of the cohorts involved to ensure equality of the clinical set-tings and homogeneity of study design, conduct, and variable definitions, though this will rarely be the case in reality. Another limitation of our analysis is that we only used AUC as a performance measure, which we did for theoretical and practical reasons [43]. In general, im-provements in AUC have to be interpreted with caution [72]. Furthermore, we cannot exclude the possibility of case-mix effects due to variables that were not available in the database or unknown.
Further research needs include the extension of MSC to include measures of calibration, which is arguably as im-portant as discrimination. For the area of COPD, it would be attractive to apply MSC to risk scores for exacerbations [51,73]. However, there are likely too few thoroughly de-veloped and externally validated scores to predict exacer-bations in patients with COPD [31]. Finally, given the large number of risk scores in the medical field and the lack of external validations and comparisons of risk scores, there is a great need for comparative studies that may use MSC in order to inform clinical practice and research about the most predictive scores [31].
Conclusions
to prognostic scores in any medical field to identify the best scores, possibly paving the way for stratified medicine, public health, and research.
Additional files
Additional file 1:The Appendix. (DOCX 90 kb)
Abbreviations
ADO:Age, dyspnea, airflow obstruction; AUC: Area under the curve; B-AE-D: Body mass index, acute exacerbations, dyspnea; BODE: Body mass index, airflow obstruction, dyspnea and severe exacerbations; BODEx: Body mass index, airflow obstruction, dyspnea, severe acute exacerbation of COPD; COPD: Chronic obstructive pulmonary disease; DOSE: Dyspnea, obstruction, smoking and exacerbation frequency; e-BODE: Severe acute exacerbation of COPD plus BODE; GOLD: Global Initiative for Chronic Obstructive Lung Disease; MSC: Multiple score comparison; NMA: Network meta-analysis; SAFE: Saint George’s Respiratory Questionnaire (SGRQ) score, air-flow limitation and exercise capacity; SUCRA: Surface under the cumulative ranking curve
Acknowledgements
We would like to thank Sarah Crook, Violeta Gaveikaite, Laura Werlen, and Alex Marzel (all from the University of Zurich, Zurich, Switzerland) for their comments. We also thank the reviewers for their valuable comments.
Funding
MAP obtained funding for the current study. All authors organized funding for their respective cohorts, which has been described in detail elsewhere [49].
Availability of data and materials
The datasets supporting the conclusions of this article are reported within a previous article [49]. The programming language used for the main analysis was R version 3.0.2.
Authors’contributions
All the authors had full access to all of the data in the study and take responsibility for the integrity of the data. BG, SRH, and MAP designed the study. All the authors contributed to the acquisition, analysis, or
interpretation of data. BG, SRH, and MAP drafted the manuscript. All authors provided a critical revision of the manuscript for important intellectual content. BG, SRH, and MAP undertook the statistical analysis. All authors provided necessary support to contribute their data to the 3CIA collaboration. JBS and MAP supervised the study. All authors read and approved the final manuscript.
Ethics approval and consent to participate
All cohorts were approved by ethics committees, and the participants gave written informed consent [49].
Consent for publication
Not applicable.
Competing interests
The authors declare that they have no competing interests.
Publisher’s Note
Springer Nature remains neutral with regard to jurisdictional claims in published maps and institutional affiliations.
Author details
1Epidemiology, Biostatistics and Prevention Institute, University of Zurich, Zurich, Switzerland.2Department of Pulmonary Medicine, Kepler Universitatsklinikum GmbH, Linz, Austria.3Faculty of Medicine, Johannes Kepler Universitat Linz, Linz, Austria.4Facultad de Medicina UASLP, Universidad Autonoma de San Luis Potosi, San Luis Potosi, Mexico. 5Dartmouth College Geisel School of Medicine, Dartmouth, NH, USA. 6Department of Pulmonary Medicine, Paracelsus Medizinische
Privatuniversitat, Salzburg, Austria.7Hospital Universitario de Valme, Sevilla, Spain.8Internal Medicine, Hospital Universitario Mutua de Terrassa, Terrassa, Spain.9Pulmonary Department and Research Unit, Hospital Universitario NS La Candelaria, Tenerife, Spain.10Network and Health Services Research Chronic Diseases (REDISSEC), Hospital Galdakao, Bizkaia, Spain.11Servicio de Neumología, Hospital Universitari Arnau de Vilanova, Lleida, Spain. 12Pulmonary Department, Clinica Universidad de Navarra, Pamplona, Spain. 13
European Respiratory Society (ERS) Guidelines Director, Barcelona, Spain. 14Pulmonary and Critical Care Medicine, Brigham and Women’s Hospital, Boston, MA, USA.15IISAragón and CIBERES, Hospital Universitario Miguel Servet, Zaragoza, Spain.16Department of General Practice, Academic Medical Center, University of Amsterdam, Amsterdam, The Netherlands.17Hospital Univarsitario de Cruces, Barakaldo, Vizcaya, Spain.18Department of Public Health, Section of Social Medicine, University of Copenhagen, Copenhagen, Denmark.19ISGlobal, CIBER Epidemiología y Salud Pública (CIBERESP), Universitat Pompeu Fabra (UPF), Barcelona, Spain.20ISGlobal, Centre for Research in Environmental Epidemiology (CREAL), IMIM (Hospital del Mar Medical Research Institute, Universitat Pompeu Fabra (UPF), CIBER Epidemiología y Salud Pública (CIBERESP), Barcelona, Spain.21Institute of Applied Health Research, University of Birmingham, Birmingham, UK. 22Division of Pulmonary and Critical Care, University of Michigan, Ann Arbor, MI, USA.23Department of Public Health and Nursing, Norvegian University of Science and Technology, Trondheim, Norway.24Centre for Clinical Documentation and Evaluation, Northern Norway Regional Health Authority, Bodø, Norway.25University of Bergen, Haukeland University Hospital, Bergen, Norway.26Department of Global Public Health and Primary Care, University of Bergen, Bergen, Norway.27Department of Respiratory Care and Sleep Control Medicine, Graduate School of Medicine, Kyoto University, Kyoto, Japan.28Department of Respiratory Medicine, Hospital Son
Espases-IdISBa-CIBERES, Palma de Mallorca, Spain.29Instituto de Investigación Sanitaria Princesa (IISP)-Servicio de Neumología- Hospital Universitario de la Princesa, Universidad Autónoma de Madrid, Madrid, Spain.30Universidad Nacional de la Plata, Hospital San Juan de Dios de La Plata, Buenos Aires, Argentina.31Hopitaux Universitaires Paris Centre, Service de Pneumologie AP-HP, Paris, France.32Hopital Cochin; Universite Paris Descartes, Paris, France.33University of British Columbia, James Hogg Research Centre, Vancouver, Canada.34Instituto de Investigación del Hospital Universitario de la Princesa (IISP), Universidad Autónoma de Madrid, Servicio de Neumología, Madrid, Spain.35Scientific and Methodological Consultant of SEPAR www.separ.es, Barcelona, Spain.36Epidemiology, Biostatistics and Prevention Institute, University of Zurich, Hirschengraben 84, Room HRS G29, CH -8001 Zurich, Switzerland.37Epidemiology & Department of Epidemiology, Johns Hopkins Bloomberg School of Public Health, Baltimore, MD, USA.
Received: 14 August 2017 Accepted: 26 January 2018
References
1. Steyerberg EW. Clinical prediction models. In: Gail M, Krickeberg K, Sarnet J, Tsiatis A, Wong W, editors. Statistics for Biology and Health. Berlin: Springer; 2010. ISBN: 978–1–4419-2648-7.
2. Moons KGM, Royston P, Vergouwe Y, Grobbee DE, Altman DG. Prognosis and prognostic research 1: what, why, and how ? BMJ. 2009;338:1317–20. 3. Steyerberg EW, Moons KGM, Van Der Windt DA, Hayden JA, Perel P,
Schroter S, et al. Prognosis Research Strategy (PROGRESS) 3: prognostic model research. PLoS Med. 2013;10:9.
4. Harrell FE. Regression modelling strategies. In: Bickel P, Diggle P, Feinberg SE, Gather U, Olkin I, Zeger S, editors. Statistics for Biology and Health. Berlin: Springer; 2015. ISBN: 978–3–319-19424-0.
5. Laupacis A, Wells G, Richardson WS, Tugwell P. Users’guides to the medical literature: V. How to use an article about prognosis. JAMA. 1994;272:234–7.
6. Puhan MA, Yu T, Stegeman I, Varadhan R, Singh S, Boyd CM. Benefit-harm analysis and charts for individualized and preference-sensitive prevention: example of low dose aspirin for primary prevention of cardiovascular disease and cancer. BMC Med. 2015;13:11.
7. Hayes DF, Markus HS, Leslie RD, Topol EJ. Personalized medicine: risk prediction, targeted therapies and mobile health technology. BMC Med. 2014;12:8.
recommendations—an environmental scan of clinical practice guidelines. BMC Med. 2013;11:7.
9. Nickel CH, Bingisser R, Morgenthaler NG. The role of copeptin as a diagnostic and prognostic biomarker for risk stratification in the emergency department. BMC Med. 2012;10:7.
10. Vuong K, McGeechan K, Armstrong BK, Cust AE. Risk prediction models for incident primary cutaneous melanoma: a systematic review. JAMA Dermatology. 2014;150:434.
11. Kagen D, Theobald C, Freeman M. Risk prediction models for hospital readmission: a systematic review. JAMA. 2011;306:1688–98. 12. Yourman LC, Lee SJ, Schonberg MA, Widera EW, Smith AK. Prognostic
indices for older adults: a systematic review. JAMA. 2012;307:182–92. 13. Collins GS, Mallett S, Omar O, Yu L-M. Developing risk prediction models for
type 2 diabetes: a systematic review of methodology and reporting. BMC Med. 2011;9:14.
14. Damen JAAG, Hooft L, Schuit E, Debray TPA, Collins GS, Tzoulaki I, et al. Prediction models for cardiovascular disease risk in the general population: systematic review. BMJ. 2016;353:11.
15. Puhan MA, Hansel NN, Sobradillo P, Enright P, Lange P, Hickson D, et al. Large-scale international validation of the ADO index in subjects with COPD: an individual subject data analysis of 10 cohorts. BMJ Open. 2012;2:1–10.
16. Puhan MA, Garcia-Aymerich J, Frey M, ter Riet G, Antó JM, Agusti A, et al. Expansion of the prognostic assessment of patients with chronic obstructive pulmonary disease: the updated BODE index and the ADO index. Lancet. 2009;374:704–11.
17. Celli BR, Cote CG, Marin JM, Casanova C, Montes de Oca M, Mendez RA, et al. The body-mass index, airflow obstruction, dyspnea, and exercise capacity index in chronic obstructive pulmonary disease. N Engl J Med. 2004;350: 1005–12.
18. Soler-Cataluña JJ, Martinez-Garcia MA, Sanchez LS, Tordera MP, Sanchez PR. Severe exacerbations and BODE index: two independent risk factors for death in male COPD patients. Respir Med. 2009;103:692–9.
19. Esteban C, Quintana JM, Aburto M, Moraza J, Arostegui I, Espana PP, et al. The health, activity, dyspnea, obstruction, age, and hospitalization: prognostic score for stable COPD patients. Respir Med. 2011;105:1662–70. 20. Briggs A, Spencer M, Wang H, Mannino D, Sin DD. Development and
validation of a prognostic index for health outcomes in chronic obstructive pulmonary disease. Arch Intern Med. 2008;168:71–9.
21. Schembri S, Anderson W, Morant S, Winter J, Thompson P, Pettitt D, et al. A predictive model of hospitalisation and death from chronic obstructive pulmonary disease. Respir Med. 2009;103:1461–7.
22. Esteban C, Quintana JM, Aburto M, Moraza J, Capelastegui A. A simple score for assessing stable chronic obstructive pulmonary disease. QJM. 2006;99:751–9. 23. Boeck L, Soriano JB, Brusse-Keizer M, Blasi F, Kostikas K, Boersma W, et al.
Prognostic assessment in COPD without lung function: the B-AE-D indices. Eur Respir J. 2016;47:1635–44.
24. Eisner MD, Trupin L, Katz PP, Yelin EH, Earnest G, Balmes J, et al. Development and validation of a survey-based COPD severity score. Chest. 2005;127:1890–7.
25. Cardoso F, Tufanin AT, Colucci M, Nascimento O, Jardim JR.
Replacement of the 6-min walk test with maximal oxygen consumption in the BODE index applied to patients with COPD: an equivalency study. Chest. 2007;132:477–82.
26. Williams JEA, Green RH, Warrington V, Steiner MC, Morgan MDL, Singh SJ. Development of the i-BODE: validation of the incremental shuttle walking test within the BODE index. Respir Med. 2012;106:390–6.
27. Jones RC, Donaldson GC, Chavannes NH, Kida K, Dickson-Spillmann M, Harding S, et al. Derivation and validation of a composite index of severity in chronic obstructive pulmonary disease: the DOSE Index. Am J Respir Crit Care Med. 2009;180:1189–95.
28. Azarisman MS, Fauzi MA, Faizal MP, Azami Z, Roslina AM, Roslan H. The SAFE (SGRQ score, air-flow limitation and exercise tolerance) Index: a new composite score for the stratification of severity in chronic obstructive pulmonary disease. Postgrad Med J. 2007;83:492–7.
29. Esteban C, Quintana JM, Moraza J, Aburto M, Aguirre U, Aguirregomoscorta JI, et al. BODE-Index vs HADO-score in chronic obstructive pulmonary disease: which one to use in general practice? BMC Med. 2010;8:28. 30. Quintana JM, Esteban C, Unzurrunzaga A, Garcia-Gutierrez S, Gonzalez N, Barrio
I, et al. Predictive score for mortality in patients with COPD exacerbations attending hospital emergency departments. BMC Med. 2014;12:66.
31. Guerra B, Gaveikaite V, Bianchi C, Puhan MA. Prediction models for exacerbations in patients with COPD. Eur Respir Rev. 2017;26:1–13. 32. Siebeling L, Musoro JZ, Geskus RB, Zoller M, Muggensturm P, Frei A, et al.
Prediction of COPD-specific health-related quality of life in primary care COPD patients: a prospective cohort study. NPJ Prim Care Respir Med. 2014;24:7. 33. Royston P, Moons KGM, Altman DG, Vergouwe Y. Prognosis and prognostic
research 2: developing a prognostic model. BMJ. 2009;338:1373–7. 34. Altman DG, Vergouwe Y, Royston P, Moons KGM. Prognosis and prognostic
research 3: validating a prognostic model. BMJ. 2009;338:1432–5. 35. Moons KGM, Altman DG, Vergouwe Y, Royston P. Prognosis and prognostic
research 4: application and impact of prognostic models in clinical practice. BMJ. 2009;338:1487–90.
36. Collins GS, Moons KGM. Comparing risk prediction models: should be routine when deriving a new model for the same purpose. BMJ. 2012;3186:1–2. 37. Riley RD, Ensor J, Snell KIE, Debray TPA, Altman DG, Moons KGM, et al. External
validation of clinical prediction models using big datasets from e-health records or IPD meta-analysis: opportunities and challenges. BMJ. 2016;353:11. 38. Mallett S, Royston P, Waters R, Dutton S, Altman DG. Reporting performance
of prognostic models in cancer: a review. BMC Med. 2010;8:11.
39. Hemingway H. Ten steps towards improving prognosis research: problems with prognosis research. BMJ. 2014;4184:1–10.
40. Fraccaro P, van der Veer S, Brown B, Prosperi M, O’Donoghue D, Collins GS, et al. An external validation of models to predict the onset of chronic kidney disease using population-based electronic health records from Salford. UK BMC Med. 2016;14:15.
41. Thangaratinam S, Allotey J, Marlin N, Dodds J, Cheong-See F, von Dadelszen P, et al. Prediction of complications in early-onset pre-eclampsia (PREP): development and external multinational validation of prognostic models. BMC Med. 2017;15:11.
42. Marin JM, Alfageme I, Almagro P, Casanova C, Esteban C, Soler-Cataluña JJ, et al. Multicomponent indices to predict survival in COPD: the COCOMICS study. Eur Respir J. 2013;42:323–32.
43. Haile SR, Guerra B, Soriano JB, Puhan MA. Multiple Score Comparison: a network meta-analysis approach to comparison and external validation of prognostic scores. BMC Med Res Methodol. 2017;17:1–12.
44. Kessels AG, Riet G, Puhan MA, Kleijnen J, Bachmann LM, Minder C. A simple regression model for network meta-analysis. OA Epidemiol. 2013;1:1–8. 45. Li T, Puhan MA, Vedula SS, Singh S, Dickersin K. Network meta-analysis-highly
attractive but more methodological research is needed. BMC Med. 2011;9:5. 46. Salanti G. Indirect and mixed-treatment comparison, network, or
multiple-treatments meta-analysis: many names, many benefits, many concerns for the next generation evidence synthesis tool. Res. Synth. Methods. 2012;3:80–97. 47. Salanti G, Marinho V, Higgins J. A case study of multiple-treatments
meta-analysis demonstrates that covariates should be considered. J Clin Epidemiol. 2009;62:857–64.
48. Sauter R, Held L. Network meta-analysis with integrated nested Laplace approximations. Biom J. 2015;57:1038–50.
49. Soriano JB, Lamprecht B, Ramírez AS, Martinez-Camblor P, Kaiser B, Alfageme I, et al. Mortality prediction in chronic obstructive pulmonary disease comparing the GOLD 2007 and 2011 staging systems: a pooled analysis of individual patient data. Lancet Respir Med. 2015;3:443–50. 50. Vestbo J, Hurd SS, Agustí AG, Jones PW, Vogelmeier C, Anzueto A, et al.
Global strategy for the diagnosis, management, and prevention of chronic obstructive pulmonary disease GOLD executive summary. Am J Respir Crit Care Med. 2013;187:347–65.
51. Decramer M, Vogelmeier C, Agustí AG, Bourbeau J, Celli BR, Chen R, et al. Global strategy for the diagnosis, management, and prevention of chronic obstructive pulmonary disease. 2015.www.goldcopd.org.
52. Hanley JA, McNeil BJ. The meaning and use of the area under a receiver operating characteristic (ROC) curve. Radiology. 1982;143:29–36. 53. Caldwell DM, Ades AE, Higgins J. Simultaneous comparison of
multiple treatments: combining direct and indirect evidence. BMJ. 2005;331:897–900.
54. Lu G, Welton NJ, Higgins J, White IR, Ades AE. Linear inference for mixed treatment comparison meta-analysis: A two-stage approach. Res Synth Methods. 2011;2:43–60.
55. Mills EJ, Ioannidis JPA, Thorlund K, Schünemann HJ, Puhan MA, Guyatt GH. How to use an article reporting a multiple treatment comparison meta-analysis. JAMA. 2012;308:1246–53.
57. Debray TPA, Damen JAAG, Snell KIE, Ensor J, Hooft L, Reitsma JB, et al. A guide to systematic review and meta-analysis of prediction model performance. BMJ. 2017;356:11.
58. Franchini AJ, Dias S, Ades AE, Jansen JP, Welton NJ. Accounting for correlation in network meta-analysis with multi-arm trials. Res Synth Methods. 2012;3:142–60.
59. Salanti G, Ades AE, Ioannidis JPA. Graphical methods and numerical summaries for presenting results from multiple-treatment meta-analysis: an overview and tutorial. J Clin Epidemiol. 2011;64:163–71.
60. Rücker G, Schwarzer G. Ranking treatments in frequentist network meta-analysis works without resampling methods. BMC Med Res Methodol. 2015;15:9.
61. Ransohoff DF, Feinstein A. Problems of spectrum and bias in evaluating the efficacy of diagnostic tests. N Engl J Med. 1978;299:926–30.
62. Vergouwe Y, Moons KGM, Steyerberg EW. External validity of risk models: use of benchmark values to disentangle a case-mix effect from incorrect coefficients. Am J Epidemiol. 2010;172:971–80.
63. Debray TPA, Vergouwe Y, Koffijberg H, Nieboer D, Steyerberg EW, Moons KGM. A new framework to enhance the interpretation of external validation studies of clinical prediction models. J Clin Epidemiol. 2015;68:279–89. 64. Debray TPA, Riley RD, Rovers MM, Reitsma JB, Moons KGM. Individual
participant data (IPD) meta-analyses of diagnostic and prognostic modeling studies: guidance on their use. PLoS Med. 2015;12:1–12.
65. Pennells L, Kaptoge S, White IR, Thompson SG, Wood AM. Assessing risk prediction models using individual participant data from multiple studies. Am J Epidemiol. 2014;179:621–32.
66. Ioannidis JP, Tzoulaki I. What makes a good predictor? The evidence applied to coronary artery calcium score. JAMA. 2010;303:1646–7.
67. Vestbo J, Anderson JA, Brook RD, Calverley PMA, Celli BR, Crim C, et al. Fluticasone furoate and vilanterol and survival in chronic obstructive pulmonary disease with heightened cardiovascular risk (SUMMIT): a double-blind randomised controlled trial. Lancet. 2016;387:1817–26.
68. Fabbri LM, Luppi F, Beghé B, Rabe KF. Complex chronic comorbidities of COPD. Eur Respir J. 2008;31:204–12.
69. Divo M, Cote C, De Torres JP, Casanova C, Marin JM, Pinto-Plata V, et al. Comorbidities and risk of mortality in patients with chronic obstructive pulmonary disease. Am J Respir Crit Care Med. 2012;186:155–61. 70. Reilly BM, Evans AT, Schaider JJ, Das K, Calvin JE, Moran LA, et al.
Impact of a clinical decision rule in the emergency department. JAMA. 2002;288:342–50.
71. McGinn TG, Guyatt GH, Wyer PC, David Naylor C, Stiell IG, Richardson WS. Users’guides to the medical literature. JAMA. 2000;284:79–84.
72. Tzoulaki I, Liberopoulos G, Ioannidis JPA. Assessment of claims of improved prediction beyond the Framingham risk score. JAMA. 2009;302:2345–52. 73. Wedzicha JA, Brill SE, Allinson JP, Donaldson GC. Mechanisms and impact of
the frequent exacerbator phenotype in chronic obstructive pulmonary disease. BMC Med. 2013;11:10.
• We accept pre-submission inquiries
• Our selector tool helps you to find the most relevant journal
• We provide round the clock customer support
• Convenient online submission
• Thorough peer review
• Inclusion in PubMed and all major indexing services
• Maximum visibility for your research
Submit your manuscript at www.biomedcentral.com/submit