R E S E A R C H A R T I C L E
Open Access
Developing risk prediction models for type 2
diabetes: a systematic review of methodology
and reporting
Gary S Collins
*, Susan Mallett, Omar Omar and Ly-Mee Yu
Abstract
Background:The World Health Organisation estimates that by 2030 there will be approximately 350 million people with type 2 diabetes. Associated with renal complications, heart disease, stroke and peripheral vascular disease, early identification of patients with undiagnosed type 2 diabetes or those at an increased risk of
developing type 2 diabetes is an important challenge. We sought to systematically review and critically assess the conduct and reporting of methods used to develop risk prediction models for predicting the risk of having undiagnosed (prevalent) or future risk of developing (incident) type 2 diabetes in adults.
Methods:We conducted a systematic search of PubMed and EMBASE databases to identify studies published before May 2011 that describe the development of models combining two or more variables to predict the risk of prevalent or incident type 2 diabetes. We extracted key information that describes aspects of developing a prediction model including study design, sample size and number of events, outcome definition, risk predictor selection and coding, missing data, model-building strategies and aspects of performance.
Results:Thirty-nine studies comprising 43 risk prediction models were included. Seventeen studies (44%) reported the development of models to predict incident type 2 diabetes, whilst 15 studies (38%) described the derivation of models to predict prevalent type 2 diabetes. In nine studies (23%), the number of events per variable was less than ten, whilst in fourteen studies there was insufficient information reported for this measure to be calculated. The number of candidate risk predictors ranged from four to sixty-four, and in seven studies it was unclear how many risk predictors were considered. A method, not recommended to select risk predictors for inclusion in the multivariate model, using statistical significance from univariate screening was carried out in eight studies (21%), whilst the selection procedure was unclear in ten studies (26%). Twenty-one risk prediction models (49%) were developed by categorising all continuous risk predictors. The treatment and handling of missing data were not reported in 16 studies (41%).
Conclusions:We found widespread use of poor methods that could jeopardise model development, including univariate pre-screening of variables, categorisation of continuous risk predictors and poor handling of missing data. The use of poor methods affects the reliability of the prediction model and ultimately compromises the accuracy of the probability estimates of having undiagnosed type 2 diabetes or the predicted risk of developing type 2 diabetes. In addition, many studies were characterised by a generally poor level of reporting, with many key details to objectively judge the usefulness of the models often omitted.
* Correspondence: [email protected]
Centre for Statistics in Medicine, University of Oxford, Wolfson College Annexe, Linton Road, Oxford, OX2 6UD, UK
Background
The global incidence of type 2 diabetes is increasing rapidly. The World Health Organisation predicts that the number of people with type 2 diabetes will double to at least 350 million worldwide by 2030 unless appropriate action is taken [1]. Diabetes is often associated with renal complications, heart disease, stroke and peripheral vascu-lar disease, which lead to increased morbidity and prema-ture mortality, and individuals with diabetes have mortality rates nearly twice as high as those without dia-betes [2]. Thus the growing healthcare burden will present an overwhelming challenge in terms of health service resources around the world. Early identification of patients with undiagnosed type 2 diabetes or those at an increased risk of developing type 2 diabetes is thus a crucial issue to be resolved.
Risk prediction models have considerable potential to contribute to the decision-making process regarding the clinical management of a patient. Typically, they are multi-variable, combining several patient risk predictors that are used to predict an individual’s treatment outcome. Health-care interventions or lifestyle changes can then be targeted towards those at an increased risk of developing a disease. Similarly, the function of these models can also be to screen individuals to identify those who are at an increased risk of having an undiagnosed condition, for which diag-nosis management and treatment can be initiated and ulti-mately improve patient outcomes.
However, despite the large number of risk prediction models being developed, only a very small minority end up being routinely used in clinical practice. Reasons for the uptake of one risk prediction model and not another is unclear, though poor design, conduct and ultimately reporting will inevitably be leading causes for apprehen-sion. Lack of objective and unbiased evaluation (validation) is a clear concern, but also, when performance is evalu-ated, poor performance data to support the uptake of a risk prediction model can contribute to scepticism regard-ing the reliability and ultimately the clinical usefulness of a model. Dictating the performance is how the risk predic-tion model was originally developed.
There is a growing concern that the majority of risk pre-diction models are poorly developed because they are based on a small and inappropriate selection of the cohort, questionable handling of continuous risk predictors, inap-propriate treatment of missing data, use of flawed or unsuitable statistical methods and, ultimately, a lack of transparent reporting of the steps taken to derive the model [3-12].
Whilst a number of guidelines in the medical litera-ture exist for the reporting of randomised, controlled trials [13], observational studies [14], diagnostic accuracy [15], systematic reviews and meta-analyses [16] and tumour marker prognostic studies [17], there are
currently no consensus guidelines for developing and evaluating multivariable risk prediction models in terms of conduct or reporting. Although a number of texts and guidance exist that cover many of the issues in developing a risk prediction model [18-20], these are spread across the literature at varying levels of prior knowledge and expertise. Raising the quality of studies is likely to require a single, concise resource for easy use by authors, peer reviewers and ultimately consumers of risk prediction models to objectively evaluate the relia-bility and usefulness of new risk prediction models. Furthermore, there is currently no guidance on what aspects of model development and validation should be reported so that readers can objectively judge the value of the prediction model.
The aim of this article is to review the methodological conduct and reporting of articles deriving risk prediction models for predicting the risk of having undiagnosed (prevalent) type 2 diabetes or the future risk of develop-ing (incident) type 2 diabetes.
Methods
We identified articles that presented new risk prediction models for predicting the risk of detecting undiagnosed (prevalent) diabetes or predicting the risk of developing (incident) type 2 diabetes. The PubMed and EMBASE databases were initially searched on 25 February 2010 (a final search was conducted on 13 May 2011). The search string is given in Appendix 1. Articles were restricted to the English-language literature. Searches included articles from all years in the PubMed (from 1965) and EMBASE (from 1980) databases. Additional articles were identified by searching the references in papers identified by the search strategy and our own personal reference lists.
Inclusion criteria
Articles were included if they met our inclusion criteria: the primary aim of the article had to be the development of a multivariable (more than two variables) risk predic-tion model for type 2 diabetes (prediabetes, undiagnosed diabetes or incident diabetes). Articles were excluded if (1) they included only validation of a preexisting risk pre-diction model (that is, the article did not develop a model), (2) the outcome was gestational diabetes, (3) the outcome was type 1 diabetes, (4) participants were chil-dren or (5) the authors developed a genetic risk predic-tion model.
Data extraction, analysis and reporting
reviewer (GSC) assessed all articles and all items, whilst the other reviewers collectively assessed all articles (SM, LMY and OO). Articles were assigned to reviewers (SM, LMY and OO) in a random manner using variable block randomisation. In articles that presented more than one model, the model that was recommended by the authors was selected. No study protocol is available. Data items extracted for this review include study design, sample size and number of events, outcome definition, risk pre-dictor selection and coding, missing data, model-building strategies and aspects of performance. The data extrac-tion form for this article was based largely on two pre-vious reviews of prognostic models in cancer [3,21,22] and can be obtained on request from the first author (GSC).
For the primary analysis, we calculated the proportion of studies and, where appropriate, the number of risk predic-tion models for each of the items extracted. We have reported our systematic review in accordance with the PRISMA guidelines [16], with the exception of items relat-ing to meta-analysis, as our study includes no formal meta-analysis.
Results
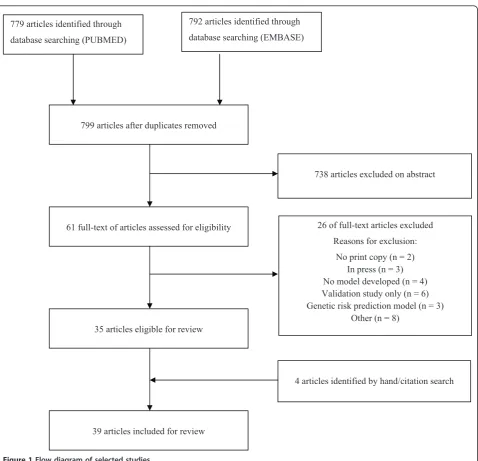
The search string retrieved 779 articles in PubMed and 792 articles in EMBASE, and, after removing duplicates, our database search yielded 799 articles (see Figure 1). Thirty-five articles met our inclusion criteria, and a further four articles were retrieved by hand-searching reference lists or citation searches. In total, 39 studies were eligible for review, among which 32 studies (83%) were published between January 2005 and May 2011. Thirteen studies (33%) were published inDiabetes Care, five studies (13%) were published inDiabetes Research and Clinical Practice, four studies (10%) were published inDiabetic Medicine
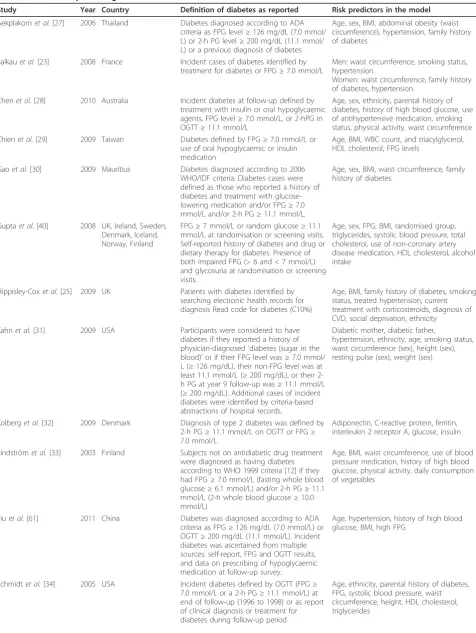
and three studies (8%) were published in theAnnals of Internal Medicine. Four studies reported separate risk pre-diction models for men and women [23-26], thus our review assesses a total of 43 risk prediction models from 39 articles. Thus the denominator is 39 when reference is made to studies and 43 when reference is made to risk prediction models. The outcomes predicted by the models varied because of different definitions of diabetes and patients included (Tables 1, 2 and 3). Seventeen studies (44%) described a model to predict the development of diabetes (incident diabetes) [23,25,27-40], fifteen (38%) described the development of a model to predict the risk of having undiagnosed diabetes [41-53], four described the development of a prediction model for diagnosed and undiagnosed diabetes [24,26,54,55], one described the development of a prediction model for undiagnosed dia-betes and prediadia-betes [56], one described the development of a prediction model for abnormal postchallenge plasma glucose level (defined as ≥ 140 mg/dL) to predict
undiagnosed diabetes [57] and one described the develop-ment of a model to predict the risk of undiagnosed type 2 diabetes and impaired glucose regulation [58].
In terms of geography, all but two risk prediction mod-els were developed using patient data from single coun-tries [38,40]. Eight articles (21%) were from the USA [31,34,36,39,43,56,57,59], thirteen articles (33%) were from Europe [23-25,32,33,35,40,42,46,52,54,55], thirteen articles (33%) were from Asia [26,27,29,37,41,44,45,47-49,51,60], two were from Africa [30,53], one was from Australia [28] and one was from Brazil [50].
Number of patients and events
The number of participants included in developing risk prediction models was clearly reported in 35 (90%) stu-dies. In the four studies where this was not clearly reported, the number of events was not reported [26,34,49,56]. The median number of participants included in model development was 2,562 (interquartile range (IQR) 1,426 to 4,965). One particular study that included 2.54 million general practice patients used separate models for men (1.26 million) and women (1.28 million) [25]. Six studies (15%) did not report the number of events in the analysis [26,34,47,49,56,58]. Where the number of events was recorded, the median number of events used to develop the models was 205 (IQR 135 to 420).
Number of risk predictors
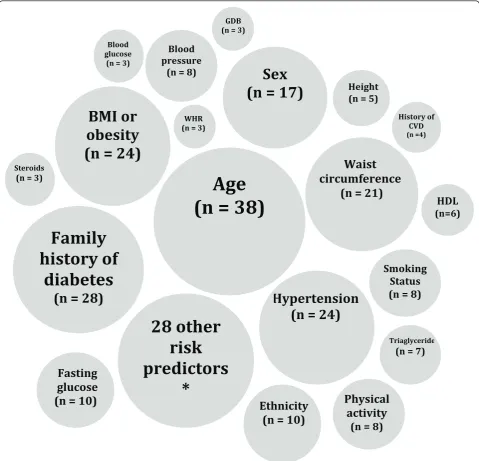
The number of candidate risk predictors was not reported or was unclear in seven studies [27,31,37,47,48,52,54,60]. A median of 14 risk predictors (IQR 9 to 19, range 4 to 64) were considered candidate risk predictors. The ratio-nales or references for including risk predictors were pro-vided in 13 studies [25,29,31,32,38,42,46,49-52,56,58]. The final reported prediction models included a median of six risk predictors (IQR 4 to 8, range 2 to 11). In total, 47 dif-ferent risk predictors were included in the final risk pre-diction models (see Figure 2). The most commonly identified risk predictors included in the final risk predic-tion model were age (n= 38), family history of diabetes (n= 28), body mass index (n= 24), hypertension (n= 24), waist circumference (n= 21) and sex (n= 17). Other com-monly identified risk predictors included ethnicity and fasting glucose level (bothn= 10) and smoking status and physical activity (bothn= 8). Twenty-four risk predictors appeared only once in the final risk prediction model.
Sample size
Treatment of continuous risk predictors
Thirteen prediction models (30%) were developed retaining continuous risk predictors as continuous, twenty-one risk prediction models (49%) dichotomised or categorised all continuous risk predictors and six risk prediction models (14%) kept some continuous risk pre-dictors as continuous and categorised others (Table 4). It was unclear how continuous risk predictors were trea-ted in the development of three risk prediction models (7%). Only five studies (13%) considered nonlinear terms [23,25,34,35,40], of which only the QDScore Diabetes Risk Calculator included nonlinear terms in the final prediction model [25].
Missing data
Twenty-three studies (59%) made reference to missing data in developing the risk prediction model, of which twenty-one studies explicitly excluded individuals with missing data regarding one or more risk predictors (often a speci-fied inclusion criterion), thereby rendering them complete case analyses [23,26,28-31,33-38,40,41,43-46,54,58,61]. One study derived the model using a complete case approach, though it included a sensitivity analysis to examine the impact of missing data [58]. One study used multiple imputations to replace missing values for two risk predic-tors [25]. One study used two different approaches to developing a risk prediction model (logistic regression and 779 articles identified through
database searching (PUBMED)
26 of full-text articles excluded Reasons for exclusion:
No print copy (n = 2) In press (n = 3) No model developed (n = 4) Validation study only (n = 6) Genetic risk prediction model (n = 3)
Other (n = 8)
738 articles excluded on abstract 799 articles after duplicates removed
792 articles identified through database searching (EMBASE)
61 full-text of articles assessed for eligibility
35 articles eligible for review
4 articles identified by hand/citation search
39 articles included for review
Table 1 Models for predicting risk of incident diabetesa
Study Year Country Definition of diabetes as reported Risk predictors in the model
Aekplakornet al.[27] 2006 Thailand Diabetes diagnosed according to ADA criteria as FPG level≥126 mg/dL (7.0 mmol/ L) or 2-h PG level≥200 mg/dL (11.1 mmol/ L) or a previous diagnosis of diabetes
Age, sex, BMI, abdominal obesity (waist circumference), hypertension, family history of diabetes
Balkauet al.[23] 2008 France Incident cases of diabetes identified by treatment for diabetes or FPG≥7.0 mmol/L
Men: waist circumference, smoking status, hypertension.
Women: waist circumference, family history of diabetes, hypertension.
Chenet al.[28] 2010 Australia Incident diabetes at follow-up defined by treatment with insulin or oral hypoglycaemic agents, FPG level≥7.0 mmol/L, or 2-hPG in OGTT≥11.1 mmol/L
Age, sex, ethnicity, parental history of diabetes, history of high blood glucose, use of antihypertensive medication, smoking status, physical activity, waist circumference Chienet al.[29] 2009 Taiwan Diabetes defined by FPG≥7.0 mmol/L or
use of oral hypoglycaemic or insulin medication
Age, BMI, WBC count, and triacylglycerol, HDL cholesterol, FPG levels
Gaoet al.[30] 2009 Mauritius Diabetes diagnosed according to 2006 WHO/IDF criteria. Diabetes cases were defined as those who reported a history of diabetes and treatment with glucose-lowering medication and/or FPG≥7.0 mmol/L and/or 2-h PG≥11.1 mmol/L.
Age, sex, BMI, waist circumference, family history of diabetes
Guptaet al.[40] 2008 UK, Ireland, Sweden, Denmark, Iceland, Norway, Finland
FPG≥7 mmol/L or random glucose≥11.1 mmol/L at randomisation or screening visits. Self-reported history of diabetes and drug or dietary therapy for diabetes. Presence of both impaired FPG (> 6 and < 7 mmol/L) and glycosuria at randomisation or screening visits.
Age, sex, FPG, BMI, randomised group, triglycerides, systolic blood pressure, total cholesterol, use of non-coronary artery disease medication, HDL cholesterol, alcohol intake
Hippisley-Coxet al.[25] 2009 UK Patients with diabetes identified by searching electronic health records for diagnosis Read code for diabetes (C10%)
Age, BMI, family history of diabetes, smoking status, treated hypertension, current treatment with corticosteroids, diagnosis of CVD, social deprivation, ethnicity
Kahnet al.[31] 2009 USA Participants were considered to have diabetes if they reported a history of physician-diagnosed‘diabetes (sugar in the blood)’or if their FPG level was≥7.0 mmol/ L (≥126 mg/dL), their non-FPG level was at least 11.1 mmol/L (≥200 mg/dL), or their 2-h PG at year 9 follow-up was≥11.1 mmol/L (≥200 mg/dL). Additional cases of incident diabetes were identified by criteria-based abstractions of hospital records.
Diabetic mother, diabetic father,
hypertension, ethnicity, age, smoking status, waist circumference (sex), height (sex), resting pulse (sex), weight (sex)
Kolberget al.[32] 2009 Denmark Diagnosis of type 2 diabetes was defined by 2-h PG≥11.1 mmol/L on OGTT or FPG≥ 7.0 mmol/L
Adiponectin, C-reactive protein, ferritin, interleukin 2 receptor A, glucose, insulin
Lindströmet al.[33] 2003 Finland Subjects not on antidiabetic drug treatment were diagnosed as having diabetes according to WHO 1999 criteria [12] if they had FPG≥7.0 mmol/L (fasting whole blood glucose≥6.1 mmol/L) and/or 2-h PG≥11.1 mmol/L (2-h whole blood glucose≥10.0 mmol/L)
Age, BMI, waist circumference, use of blood pressure medication, history of high blood glucose, physical activity, daily consumption of vegetables
Liuet al.[61] 2011 China Diabetes was diagnosed according to ADA criteria as FPG≥126 mg/dL (7.0 mmol/L) or OGTT≥200 mg/dL (11.1 mmol/L). Incident diabetes was ascertained from multiple sources: self-report, FPG and OGTT results, and data on prescribing of hypoglycaemic medication at follow-up survey.
Age, hypertension, history of high blood glucose, BMI, high FPG
Schmidtet al.[34] 2005 USA Incident diabetes defined by OGTT (FPG≥ 7.0 mmol/L or a 2-h PG≥11.1 mmol/L) at end of follow-up (1996 to 1998) or as report of clinical diagnosis or treatment for diabetes during follow-up period
classification trees) with surrogate splitters to deal with missing data when using classification trees, whilst the approach for dealing with missing data in the logistic regression analyses was not reported, in which event a complete case analysis was most likely.. Sixteen studies (41%) made no mention of missing data (Table 4), thus it can only be assumed that a complete case analysis was conducted or that all data for all risk predictors (including candidate risk predictors) were available, which seems unli-kely [24,27,32,39,42,47-53,55,57,59,60].
Model building
Eight studies (21%) reported using bivariable screening (often referred to as‘univariate screening’) to reduce the number of risk predictors [32,34,44-46,50,52,54], whilst it was unclear how the risk predictors were reduced prior to development of the multivariable model in nine stu-dies (23%) [23,29,31,35,37,47,48,55,58]. Two stustu-dies reported examining the association of individual risk pre-dictors with patient outcome after adjusting for age and sex [27] and age and cohort [30]. Nine studies (23%) included all risk predictors in the multivariable analysis [25,26,33,36,39,49,51,53,61].
Twenty-two studies (56%) reported using automated variable selection (forward selection, backward elimina-tion and stepwise) procedures to derive the final multi-variable model (Table 4). Nine studies (23%) reported using backward elimination [24,28,41,43,45,46,50,52,57],
seven studies (18%) reported using forward selection [34,35,38,40,48,55,60] whilst six studies (15%) used step-wise selection methods [23,32,42,47,54,58].
All studies clearly identified the type of model they used to derive the prediction model. The final models were based on logistic regression in 29 articles, the Cox propor-tional hazards model in 7 articles [25,29,30,35,37,38,40], recursive partitioning in 2 articles [26,56] and a Weibull parametric survival model in 1 article [31]. Two studies used two modelling approaches (logistic regression and Cox proportional hazards model [39] and logistic regres-sion and recursive partitioning [56]).
Twenty-five risk prediction models (58%) considered interactions in developing the model; however, this was not explicitly stated for seven of these risk prediction mod-els. Three studies clearly stated that they did not consider interactions to keep the risk prediction model simple, yet all three models implicitly included a waist circumference by sex interaction in their definition of obesity [33,41,44]. Two studies examined over 20 interactions [36,43].
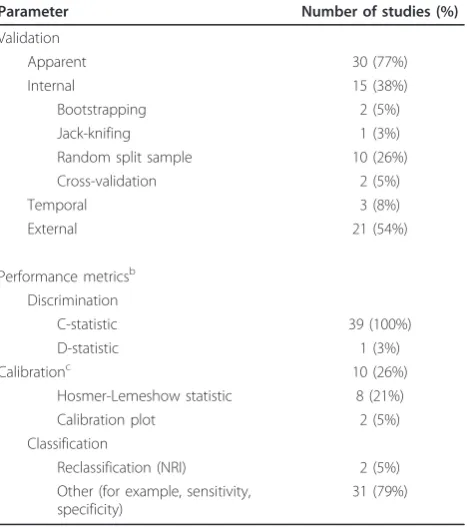
Validation
Ten studies (26%) randomly split the cohort into develop-ment and validation cohorts [24-26,30,31,34,37,46,51,55] (Table 5). Eight of these studies split the original cohort equally into development and validation cohorts. Twenty-one studies (54%) conducted and published an external validation of their risk prediction models within the same
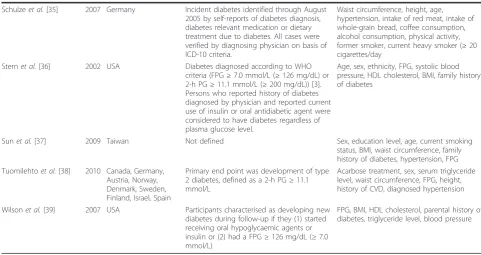
Table 1 Models for predicting risk of incident diabetesa(Continued)
Schulzeet al.[35] 2007 Germany Incident diabetes identified through August 2005 by self-reports of diabetes diagnosis, diabetes relevant medication or dietary treatment due to diabetes. All cases were verified by diagnosing physician on basis of ICD-10 criteria.
Waist circumference, height, age, hypertension, intake of red meat, intake of whole-grain bread, coffee consumption, alcohol consumption, physical activity, former smoker, current heavy smoker (≥20 cigarettes/day
Sternet al.[36] 2002 USA Diabetes diagnosed according to WHO criteria (FPG≥7.0 mmol/L (≥126 mg/dL) or 2-h PG≥11.1 mmol/L (≥200 mg/dL)) [3]. Persons who reported history of diabetes diagnosed by physician and reported current use of insulin or oral antidiabetic agent were considered to have diabetes regardless of plasma glucose level.
Age, sex, ethnicity, FPG, systolic blood pressure, HDL cholesterol, BMI, family history of diabetes
Sunet al.[37] 2009 Taiwan Not defined Sex, education level, age, current smoking status, BMI, waist circumference, family history of diabetes, hypertension, FPG Tuomilehtoet al.[38] 2010 Canada, Germany,
Austria, Norway, Denmark, Sweden, Finland, Israel, Spain
Primary end point was development of type 2 diabetes, defined as a 2-h PG≥11.1 mmol/L
Acarbose treatment, sex, serum triglyceride level, waist circumference, FPG, height, history of CVD, diagnosed hypertension
Wilsonet al.[39] 2007 USA Participants characterised as developing new diabetes during follow-up if they (1) started receiving oral hypoglycaemic agents or insulin or (2) had a FPG≥126 mg/dL (≥7.0 mmol/L)
FPG, BMI, HDL cholesterol, parental history of diabetes, triglyceride level, blood pressure
a
article [23,27,28,33,35,38,41-48,50-53,56-58], and eight of these studies used two or more data sets in an attempt to demonstrate the external validity (that is, generalisability) of the risk prediction model.
Model performance
We assessed the type of performance measure used to evaluate the risk prediction models (Table 5). All studies
reported statistics, with 31 studies (79%) reporting C-statistics on the data used to derive the model [23,26-29,32,33,35-39,41,43-54,56-61], 13 studies (33%) calculating C-statistics on an internal validation data set [24-26,29-32,34,37,39,40,55,56] and 21 studies (54%) reporting C-statistics on external validation data sets [23,27,28,33,35,38,41-48,50-53,56-58]. Only 10 studies (26%) assessed how well the predicted risks compared to
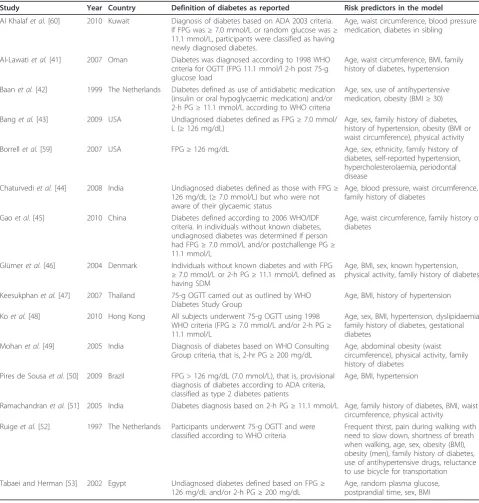
Table 2 Models for predicting risk of prevalent (undiagnosed) diabetesa
Study Year Country Definition of diabetes as reported Risk predictors in the model
Al Khalafet al.[60] 2010 Kuwait Diagnosis of diabetes based on ADA 2003 criteria. If FPG was≥7.0 mmol/L or random glucose was≥ 11.1 mmol/L, participants were classified as having newly diagnosed diabetes.
Age, waist circumference, blood pressure medication, diabetes in sibling
Al-Lawatiet al.[41] 2007 Oman Diabetes was diagnosed according to 1998 WHO criteria for OGTT (FPG 11.1 mmol/l 2-h post 75-g glucose load
Age, waist circumference, BMI, family history of diabetes, hypertension
Baanet al.[42] 1999 The Netherlands Diabetes defined as use of antidiabetic medication (insulin or oral hypoglycaemic medication) and/or 2-h PG≥11.1 mmol/L according to WHO criteria
Age, sex, use of antihypertensive medication, obesity (BMI≥30) Banget al.[43] 2009 USA Undiagnosed diabetes defined as FPG≥7.0 mmol/
L (≥126 mg/dL)
Age, sex, family history of diabetes, history of hypertension, obesity (BMI or waist circumference), physical activity Borrellet al.[59] 2007 USA FPG≥126 mg/dL Age, sex, ethnicity, family history of
diabetes, self-reported hypertension, hypercholesterolaemia, periodontal disease
Chaturvediet al.[44] 2008 India Undiagnosed diabetes defined as those with FPG≥ 126 mg/dL (≥7.0 mmol/L) but who were not aware of their glycaemic status
Age, blood pressure, waist circumference, family history of diabetes
Gaoet al.[45] 2010 China Diabetes defined according to 2006 WHO/IDF criteria. In individuals without known diabetes, undiagnosed diabetes was determined if person had FPG≥7.0 mmol/L and/or postchallenge PG≥ 11.1 mmol/L
Age, waist circumference, family history of diabetes
Glümeret al.[46] 2004 Denmark Individuals without known diabetes and with FPG
≥7.0 mmol/L or 2-h PG≥11.1 mmol/L defined as having SDM
Age, BMI, sex, known hypertension, physical activity, family history of diabetes
Keesukphanet al.[47] 2007 Thailand 75-g OGTT carried out as outlined by WHO Diabetes Study Group
Age, BMI, history of hypertension
Koet al.[48] 2010 Hong Kong All subjects underwent 75-g OGTT using 1998 WHO criteria (FPG≥7.0 mmol/L and/or 2-h PG≥ 11.1 mmol/L
Age, sex, BMI, hypertension, dyslipidaemia, family history of diabetes, gestational diabetes
Mohanet al.[49] 2005 India Diagnosis of diabetes based on WHO Consulting Group criteria, that is, 2-hr PG≥200 mg/dL
Age, abdominal obesity (waist circumference), physical activity, family history of diabetes
Pires de Sousaet al.[50] 2009 Brazil FPG > 126 mg/dL (7.0 mmol/L), that is, provisional diagnosis of diabetes according to ADA criteria, classified as type 2 diabetes patients
Age, BMI, hypertension
Ramachandranet al.[51] 2005 India Diabetes diagnosis based on 2-h PG≥11.1 mmol/L Age, family history of diabetes, BMI, waist circumference, physical activity
Ruigeet al.[52] 1997 The Netherlands Participants underwent 75-g OGTT and were classified according to WHO criteria
Frequent thirst, pain during walking with need to slow down, shortness of breath when walking, age, sex, obesity (BMI), obesity (men), family history of diabetes, use of antihypertensive drugs, reluctance to use bicycle for transportation Tabaei and Herman [53] 2002 Egypt Undiagnosed diabetes defined based on FPG≥
126 mg/dL and/or 2-h PG≥200 mg/dL
Age, random plasma glucose, postprandial time, sex, BMI
a
the observed risks (calibration), investigators in 8 studies (21%) chose to calculate the Hosmer-Lemeshow good-ness-of-fit test [23,27-29,36,37,45,53] and in 2 studies a calibration plot was presented [25,37].
Model presentation
Twenty-four studies (62%) derived simplified scoring sys-tems from the risk models [23,24,27-29,31,33,38,39, 41-46,48-52,57,58,61]. Twelve studies derived a simple points system by multiplying (or dividing) the regression coefficients by a constant (typically 10) and then rounding the result to the nearest integer [24,41-44,46,48, 50-52,57,58]. Four studies used the method of Sullivanet al.[62] to develop a points system [27,29,38,39].
Discussion
Main findings
Our systematic review of 39 published studies highlights inadequate conduct and reporting in all aspects of
developing a multivariable prediction model for detecting prevalent or incident type 2 diabetes. Fundamental aspects of describing the data (i.e. the number of partici-pants and the number of events), a clear description of all selection of risk predictors and steps taken to build the multivariable model were all shown to be poor
One of the problems researchers face when developing a multivariable prediction model is overfitting. This occurs when the number of events in the cohort is dis-proportionately small in relation to the number of candi-date risk predictors. A rule of thumb is that models should be developed with 10 to 20 events per variable (EPV) [63,64]. Of the studies included in this review, 21% had fewer than 10 EPV, whilst there was insufficient detail reported for an EPV to be calculated in 33% of the risk prediction models. The consequences of overfitting are that models subsequently often fail to perform satis-factorily when applied to data sets not used to derive the model [65]. Investigators in other studies have reported
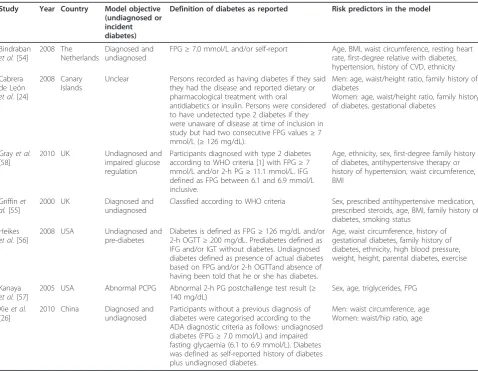
Table 3 Models for predicting risk of other diabetes outcomesa
Study Year Country Model objective (undiagnosed or incident diabetes)
Definition of diabetes as reported Risk predictors in the model
Bindraban et al.[54]
2008 The Netherlands
Diagnosed and undiagnosed
FPG≥7.0 mmol/L and/or self-report Age, BMI, waist circumference, resting heart rate, first-degree relative with diabetes, hypertension, history of CVD, ethnicity Cabrera
de León et al.[24]
2008 Canary Islands
Unclear Persons recorded as having diabetes if they said they had the disease and reported dietary or pharmacological treatment with oral
antidiabetics or insulin. Persons were considered to have undetected type 2 diabetes if they were unaware of disease at time of inclusion in study but had two consecutive FPG values≥7 mmol/L (≥126 mg/dL).
Men: age, waist/height ratio, family history of diabetes
Women: age, waist/height ratio, family history of diabetes, gestational diabetes
Grayet al. [58]
2010 UK Undiagnosed and impaired glucose regulation
Participants diagnosed with type 2 diabetes according to WHO criteria [1] with FPG≥7 mmol/L and/or 2-h PG≥11.1 mmol/L. IFG defined as FPG between 6.1 and 6.9 mmol/L inclusive.
Age, ethnicity, sex, first-degree family history of diabetes, antihypertensive therapy or history of hypertension, waist circumference, BMI
Griffinet al.[55]
2000 UK Diagnosed and undiagnosed
Classified according to WHO criteria Sex, prescribed antihypertensive medication, prescribed steroids, age, BMI, family history of diabetes, smoking status
Heikes et al.[56]
2008 USA Undiagnosed and pre-diabetes
Diabetes is defined as FPG≥126 mg/dL and/or 2-h OGTT≥200 mg/dL. Prediabetes defined as IFG and/or IGT without diabetes. Undiagnosed diabetes defined as presence of actual diabetes based on FPG and/or 2-h OGTTand absence of having been told that he or she has diabetes.
Age, waist circumference, history of gestational diabetes, family history of diabetes, ethnicity, high blood pressure, weight, height, parental diabetes, exercise
Kanaya et al.[57]
2005 USA Abnormal PCPG Abnormal 2-h PG postchallenge test result (≥ 140 mg/dL)
Sex, age, triglycerides, FPG
Xieet al. [26]
2010 China Diagnosed and undiagnosed
Participants without a previous diagnosis of diabetes were categorised according to the ADA diagnostic criteria as follows: undiagnosed diabetes (FPG≥7.0 mmol/L) and impaired fasting glycaemia (6.1 to 6.9 mmol/L). Diabetes was defined as self-reported history of diabetes plus undiagnosed diabetes.
Men: waist circumference, age Women: waist/hip ratio, age
a
similar findings (EPV < 10) when appraising the develop-ment of multivariable prediction models [3,21,66].
Another key component affecting the performance of the final model is how continuous variables are treated, whether they are kept as continuous measurements or whether they have been categorised into two or more cate-gories [67]. Common approaches include dichotomising at
the median value or choosing an optimal cutoff point based on minimising aPvalue. Regardless of the approach used, the practice of artificially treating a continuous risk predictor as categorical should be avoided [67], yet this is frequently done in the development of risk prediction models [4,5,68-74]. In our review, we identified 63% of studies that categorised all or some of the continuous risk
$$(
)5-,*
#$
% #
)5-,*
(
#$ "(
$#
)5.4*
"
#$(
)5.0*
'
)5-3*
)5/4*
.4 $"
"#
!"$ "#
+
(!"$#
)5.0*
#$
"%"
)5.-*
)5/*
$" #
)5/*
)5/*
!"##%"
)54*
$$%#
)54*
(#
$&$(
)54*
"("
)53*
)52* $
)51*
#$ "(
)50*
% #
)5/*
predictors, and similar figures have been reported in other reviews [3]. Dichotomising continuous variables causes a detrimental loss of information and loss of power to detect real relationships, equivalent to losing one-third of the data or even more if the data are exponentially distributed [75]. Continuous risk predictors (that is, age) should be retained in the model as continuous variables, and if the risk predictor has a nonlinear relationship with the out-come, then the use of splines or fractional polynomial functions is recommended [76].
Missing data is common in most clinical data sets, which can be a serious problem in studies deriving a risk prediction model. Regardless of study design, collecting all data on all risk predictors for all individuals is a diffi-cult task that is rarely achieved. For studies that derive models on the basis of retrospective cohorts, there is no scope in retrieving any missing data and investigators are thus confronted with deciding how to deal with incom-plete data. A common approach is to exclude individuals with missing values on any of the variables and conduct a complete case analysis. However, a complete case analy-sis, in addition to sacrificing and discarding useful infor-mation, is not recommended as it has been shown that it can yield biased results [77]. Forty percent of the studies
in our review failed to report any information regarding missing data. Multiple imputation offers investigators a valid approach to minimise the effect of missing data, yet this is seldom done in developing risk prediction models [78], though guidance and illustrative examples are slowly appearing [18,79,80]. The completeness of overall data (how many individuals have complete data on all variables) and by variable should always be reported so that readers can judge the representativeness and quality of the data.
Whilst developing a model, predictors that are shown to have little influence on predicting patients likely to have particular outcomes might be taken out of a final model during model development. However, this is not a simple matter of selecting predictors solely on the basis of statisti-cal significance during model development, as it can be important to retain these among the model risk predictors known to be important from the literature, but which may not reach statistical significance in a particular data set. Unfortunately, the process of developing a risk predictor model for use in clinical practice for prediction is often confused with using multivariate modelling to identify risk predictors with statistical significance in epidemiological studies. This misunderstanding of the modelling aims can lead to use of inappropriate methods such as prescreening candidate variables for a risk predictor model based on
Table 4 Issues in model developmenta
Variables Data
Sample size, median (IQR)
Development cohortb 2,562 (1,426 to 4,965) Validation cohortsc 1,895 (1,253 to 4,398)
Treatment of continuous risk predictors,n(%)
All kept continuous 13 (30%)
All categorised/dichotomised 21 (49%) Some categorised, some not 6 (14%)
Unclear 3 (7%)
Treatment of missing data,n(%)
Not mentioned 16 (41%)
Complete case 21 (54%)
Multiple imputation 1 (3%)
Other (for example, surrogate splitter for regression trees)
1 (3%)
Model-building strategy,n(%)
Stepwise, forward selection, backward elimination
20 (51%)
All significant in univariate analysis 2 (5%)
Other 12 (31%)
Unclear 5 (13%)
Overfitting mentioned or discussed,n(%) 5 (13%)
a
IQR, interquartile range;b
sample size not reported in four studies;c
sample size not reported in two studies and unclear in one study.
Table 5 Evaluating performance of risk prediction modelsa
Parameter Number of studies (%)
Validation
Apparent 30 (77%)
Internal 15 (38%)
Bootstrapping 2 (5%)
Jack-knifing 1 (3%)
Random split sample 10 (26%)
Cross-validation 2 (5%)
Temporal 3 (8%)
External 21 (54%)
Performance metricsb Discrimination
C-statistic 39 (100%)
D-statistic 1 (3%)
Calibrationc 10 (26%)
Hosmer-Lemeshow statistic 8 (21%)
Calibration plot 2 (5%)
Classification
Reclassification (NRI) 2 (5%)
Other (for example, sensitivity, specificity)
31 (79%)
a
NRI,- Net Reclassification Index;bstudies can report more than one performance metric;c
bivariable tests of association with the outcome (that is, a statistical test to examine the association of an individual predictor with the outcome). This has been shown to be inappropriate, as it can wrongly reject important risk pre-dictors that become prognostic only after adjustment of other risk predictors, thus leading to unreliable models [18,81]. More importantly, it is crucial to clearly report any procedure used to reduce the number of candidate risk predictors. Nearly half of the studies in our review reduced the initial number candidate risk predictors prior to the multivariable modelling, yet over half of these failed provide sufficient detail on how this was carried out.
The most commonly used strategy to build a multivari-able model is to use an automated selection approach (for-ward selection, back(for-ward elimination or stepwise) to derive the final risk prediction model (50% in our review). Automated selection methods are data-driven approaches based on statistical significance without reference to clini-cal relevance, and it has been shown that these methods frequently produce unstable models, have biased estimates of regression coefficients and yield poor predictions [82-84].
Arguably, regardless of how the multivariable model is developed, all that ultimately matters is to demonstrate that the model works. Thus, after a risk prediction model has been derived, it is essential that the performance of the model be evaluated. Broadly speaking, there are three types of performance data one can present, in order of increasing levels of evidence: (1) apparent validation on the same data used to derive the model; (2) internal valida-tion using a split sample (if the cohort is large enough), cross-validation or, preferably, resampling (that is, boot-strapping); and (3) external validation using a completely different cohort of individuals from different centres or locations than those used to derive the model [85,86]. Investigators in over half of the studies in our review (54%) conducted an external validation on cohorts that were much larger than other reporting in other reviews [72,87].
Reporting performance data solely from an apparent validation analysis is to a large extent uninformative, unless the obvious optimism in evaluating the perfor-mance based on the same data used to derive the model is accounted for and this optimism quantified (using internal validation techniques such as resampling). Unless the cohort is particularly large (> 20,000), then using a split sample to derive and evaluate a model also has limited value, especially if the cohorts are randomly split, since the two cohorts are selected to be similar and thus produce overly optimistic performance data. In models in which a split sample has been used, a better approach is a nonrandom split (that is, certain centres or a temporal split) [85,86].
What is already known on the topic
The findings of this review are consistent with those of other published reviews of prediction models in cancer [3,70,71], stroke [4,73,88], traumatic brain injury [68,72], liver transplantation [5] and dentistry [89]. We observed poor reporting in all aspects of developing the risk predic-tion models in terms of describing the data and providing sufficient detail in all steps taken in building the model.
Limitations
Our systematic review was limited to English-language articles and did not consider grey literature; therefore, we may have missed some studies. However, we strongly suspect that including articles in our review would not have altered any of the findings.
Conclusions
This systematic review of 39 published studies highlights numerous methodological deficiencies and a generally poor level of reporting in studies in which risk prediction models were developed for the detection of prevalent or incident type 2 diabetes. Reporting guidelines are avail-able for therapeutic [90], diagnostic [91] and other study designs [14,92,93], and these have been shown to increase the reporting of key study information [94,95]. Such an initiative is long overdue for the reporting of risk predic-tion models. We note that in the field of veterinary oncology, recommended guidelines for the conduct and evaluation of prognostic studies have been developed to stem the tide of low-quality research. Until reporting guidelines suitable for deriving and evaluating risk pre-diction models are developed and adopted by journals and peer reviewers, the conduct, methodology and reporting of such models will remain disappointingly poor.
Appendix 1: Search strings
PubMed search string
‘diabetes’[ti] AND (‘risk prediction model’[tiab] OR‘ pre-dictive model’[tiab] OR‘predictive equation’[tiab] OR ‘prediction model’[tiab] OR‘risk calculator’[tiab] OR‘ pre-diction rule’[tiab] OR‘risk model’[tiab] OR‘statistical model’[tiab] OR‘cox model’[tiab] OR‘multivariable’ [-tiab]) NOT (review[Publication Type] OR Bibliography [Publication Type] OR Editorial[Publication Type] OR Letter[Publication Type] OR Meta-analysis[Publication Type] OR News[Publication Type]).
EMBASE search string
risk calculator.ti. or prediction rule.ab. or prediction rule.ti. or risk model.ab. or risk model.ti. or statistical model.ab. or statistical model.ti. or cox model.ab. or cox model.ti. or multivariable.ab. or multivariable.ti. and dia-betes.ti not letter.pt not review.pt not editorial.pt not conference.pt not book.pt.
Acknowledgements
The authors received no funding for this study. GSC is funded by the Centre for Statistics in Medicine. SM is funded by Cancer Research UK. OO and LMY are funded by the NHS Trust.
Authors’contributions
GSC contributed to the study design, carried out the data extraction of all articles and items, compiled the results and drafted the manuscript. SM contributed to the study design, duplicate data extraction and drafting of the article. OO and LMY carried out duplicate data extraction and commented on the manuscript. All authors read and approved the final manuscript.
Authors’information
All authors are medical statisticians.
Competing interests
The authors declare that they have no competing interests.
Received: 9 May 2011 Accepted: 8 September 2011 Published: 8 September 2011
References
1. Screening for Type 2 Diabetes: Report of a World Health Organization and International Diabetes Federation meeting.[http://www.who.int/ diabetes/publications/en/screening_mnc03.pdf].
2. Mulnier HE, Seaman HE, Raleigh VS, Soedamah-Muthu SS, Colhoun HM, Lawrenson RA:Mortality in people with type 2 diabetes in the UK.Diabet Med2006,23:516-521.
3. Altman DG:Prognostic models: a methodological framework and review of models for breast cancer.Cancer Invest2009,27:235-243.
4. Counsell C, Dennis M:Systematic review of prognostic models in patients with stroke.Cerebrovasc Dis2001,12:159-170.
5. Jacob M, Lewsey JD, Sharpin C, Gimson A, Rela M, van der Meulen JHP: Systematic review and validation of prognostic models in liver transplantation.Liver Transpl2005,11:814-825.
6. Bagley SC, White H, Golomb BA:Logistic regression in the medical literature: standards for use and reporting, with particular attention to one medical domain.J Clin Epidemiol2001,54:979-985.
7. Kalil AC, Mattei J, Florescu DF, Sun J, Kalil RS:Recommendations for the assessment and reporting of multivariable logistic regression in transplantation literature.Am J Transplant2010,10:1686-1694. 8. Khan KS, Chien PF, Dwarakanath LS:Multivariable analysis: a primer for
readers of medical research.Obstet Gynecol1999,93:1014-1020. 9. Mikolajczyk RT, DiSilvestro A, Zhang J:Evaluation of logistic regression
reporting in current obstetrics and gynecology literature.Obstet Gynecol 2008,111:413-419.
10. Ottenbacher KJ, Ottenbacher HR, Tooth L, Ostir GV:A review of two journals found that articles using multivariable logistic regression frequently did not report commonly recommended assumptions.J Clin Epidemiol2004,57:1147-1152.
11. Concato J, Feinsten AR, Holford TR:The risk of determining risk with multivariable models.Ann Intern Med1993,118:201-210.
12. Wasson JH, Sox HC, Neff RK, Goldman L:Clinical prediction rules: applications and methodological standards.N Engl J Med1985, 313:793-799.
13. Schulz KF, Altman DG, Moher D, CONSORT Group:CONSORT 2010 statement: updated guidelines for reporting parallel group randomised trials.BMJ2010,340:c332.
14. von Elm E, Altman DG, Egger M, Pocock SJ, Gøtzsche PC, Vandenbrouke JP, STROBE Initiative:Strengthening the Reporting of Observational Studies
in Epidemiology (STROBE) statement: guidelines for reporting observational studies.BMJ2007,335:806-808.
15. Bossuyt PM, Reitsma JB, Bruns DE, Gatsonis CA, Glasziou PP, Irwig LM, Lijmer JG, Moher D, Rennie D, de Vet HC, Standards for Reporting of Diagnostic Accuracy:Towards complete and accurate reporting of studies of diagnostic accuracy: the STARD initiative.BMJ2003,326:41-44. 16. Moher D, Liberati A, Tetzlaff J, Altman DG, PRISMA Group:Preferred
reporting items for systematic reviews and meta-analyses: the PRISMA statement.BMJ2009,339:b2535.
17. McShane LM, Altman DG, Sauerbrei W, Taube SE, Gion M, Clark GM, Statistics Subcommittee of the NCI-EORTC Working Group on Cancer Diagnostics:REporting recommendations for tumour MARKer prognostic studies (REMARK).Br J Cancer2005,93:387-391.
18. Harrell FE Jr, Lee KL, Mark DB:Multivariable prognostic models: issues in developing models, evaluating assumptions and adequacy, and measuring and reducing errors.Stat Med1996,15:361-387. 19. Metze K:Methodological aspects of prognostic factor studies: some
caveats.Sao Paulo Med J1998,116:1787-1788.
20. Müller-Riemenschneider F, Holmberg C, Rieckmann N, Kliems H, Rufer V, Müller-Nordhorn J, Willich SN:Barriers to routine risk-score use for healthy primary care patients.Arch Intern Med2010,170:719-724. 21. Mallett S, Royston P, Dutton S, Waters R, Altman DG:Reporting methods in
studies developing prognostic models in cancer: a review.BMC Med 2010,8:20.
22. Mallett S, Royston P, Waters R, Dutton S, Altman DG:Reporting performance of prognostic models in cancer: a review.BMC Med2010, 8:21.
23. Balkau B, Lange C, Fezeu L, Tichet J, de Lauzon-Guillain B, Czernichow S, Fumeron F, Froguel P, Vaxillaire M, Cauchi S, Ducimetière P, Eschwège E: Predicting diabetes: clinical, biological, and genetic approaches: data from the Epidemiological Study on the Insulin Resistance Syndrome (DESIR).Diabetes Care2008,31:2056-2061.
24. Cabrera de León A, Coello SD, del Cristo RodríguezPérez M, Medina MB, Almeida González D, Diaz BB, de Fuentes MM, Aguirre-Jaime A:A simple clinical score for type 2 diabetes mellitus screening in the Canary Islands.Diabetes Res Clin Pract2008,80:128-133.
25. Hippisley-Cox J, Coupland C, Robson J, Sheikh A, Brindle P:Predicting risk of type 2 diabetes in England and Wales: prospective derivation and validation of QDScore.BMJ2009,338:b880.
26. Xie J, Hu D, Yu D, Chen CS, He J, Gu D:A quick self-assessment tool to identify individuals at high risk of type 2 diabetes in the Chinese general population.J Epidemiol Community Health2010,64:236-242. 27. Aekplakorn W, Bunnag P, Woodward M, Sritara P, Cheepudomwit S,
Yamwong S, Yipintsoi T, Rajatanavin R:A risk score for predicting incident diabetes in the Thai population.Diabetes Care2006,29:1872-1877. 28. Chen L, Magliano DJ, Balkau B, Colagiuri S, Zimmet PZ, Tonkin AM,
Mitchell P, Phillips PJ, Shaw JE:AUSDRISK: an Australian Type 2 Diabetes Risk Assessment Tool based on demographic, lifestyle and simple anthropometric measures.Med J Aust2010,192:197-202.
29. Chien K, Cai T, Hsu H, Su T, Chang W, Chen M, Lee Y, Hu FB:A prediction model for type 2 diabetes risk among Chinese people.Diabetologia2009, 52:443-450.
30. Gao WG, Qiao Q, Pitkäniemi J, Wild S, Magliano D, Shaw J, Söderberg S, Zimmet P, Chitson P, Knowlessur S, Alberti G, Tuomilehto J:Risk prediction models for the development of diabetes in Mauritian Indians.Diabet Med2009,16:996-1002.
31. Kahn HS, Cheng YJ, Thompson TJ, Imperatore G, Gregg EW:Two risk-scoring systems for predicting incident diabetes mellitus in U.S. adults age 45 to 64 years.Ann Intern Med2009,150:741-751.
32. Kolberg JA, Jørgensen T, Gerwien RW, Hamren S, McKenna MP, Moler E, Rowe MW, Urdea MS, Xu XM, Hansen T, Pedersen O, Borch-Johnsen K: Development of a type 2 diabetes risk model from a panel of serum biomarkers from the Inter99 cohort.Diabetes Care2009,32:1207-1212. 33. Lindström J, Tuomilehto J:The diabetes risk score: a practical tool to
predict type 2 diabetes risk.Diabetes Care2003,26:725-731. 34. Schmidt MI, Duncan BB, Bang H, Pankow JS, Ballantyne CM, Golden SH,
Folsom AR, Chambless LE, Atherosclerosis Risk in Communities Investigators: Identifying individuals at high risk for diabetes: The Atherosclerosis Risk in Communities study.Diabetes Care2005,28:2013-2018.
accurate risk score based on anthropometric, dietary, and lifestyle factors to predict the development of type 2 diabetes.Diabetes Care 2007,30:510-515.
36. Stern MP, Williams K, Haffner SM:Identification of persons at high risk for type 2 diabetes mellitus: Do we need the oral glucose tolerance test? Ann Intern Med2002,136:575-581.
37. Sun F, Tao Q, Zhan S:An accurate risk score for estimation 5-year risk of type 2 diabetes based on a health screening population in Taiwan. Diabetes Res Clin Pract2009,85:228-234.
38. Tuomilehto J, Lindström J, Hellmich M, Lehmacher W, Westermeier T, Evers T, Brückner A, Peltonen M, Qiao Q, Chiasson JL:Development and validation of a risk-score model for subjects with impaired glucose tolerance for the assessment of the risk of type 2 diabetes mellitus: the STOP-NIDDM risk-score.Diabetes Res Clin Pract2010,87:267-274. 39. Wilson PWF, Meigs JB, Sullivan L, Fox CS, Nathan DM, D’Agostino RB Sr:
Prediction of incident diabetes mellitus in middle-aged adults: the Framingham Offspring Study.Arch Intern Med2007,167:1068-1074. 40. Gupta AK, Dahlof B, Dobson J, Sever PS, Wedel H, Poulter NR,
Anglo-Scandinavian Cardiac Outcomes Trial Investigators:Determinants of new-onset diabetes among 19,257 hypertensive patients randomized in the Anglo-Scandinavian Cardiac Outcomes Trial-Blood Pressure Lowering Arm and the relative influence of antihypertensive medication.Diabetes Care2008,31:982-988.
41. Al-Lawati JA, Tuomilehto J:Diabetes risk score in Oman: a tool to identify prevalent type 2 diabetes among Arabs of the Middle East.Diabetes Res Clin Pract2007,77:438-444.
42. Baan CA, Ruige JB, Stolk RP, Witteman JCM, Dekker JM, Heine RJ, Feskens EJM:Performance of a predictive model to identify undiagnosed diabetes in a health care setting.Diabetes Care1999,22:213-219. 43. Bang H, Edwards AM, Bomback AS, Ballantyne CM, Brillon D, Callahan MA,
Teutsch SM, Mushlin AI, Kern LM:Development and validation of a patient self-assessment score for diabetes risk.Ann Intern Med2009, 151:775-783.
44. Chaturvedi V, Reddy KS, Prabhakaran D, Jeemon P, Ramakrishnan L, Shah P, Shah B:Development of a clinical risk score in predicting undiagnosed diabetes in urban Asian Indian adults: a population-based study.CVD Prev Control2008,3:141-151.
45. Gao WG, Dong YH, Pang ZC, Nan HR, Wang SJ, Ren J, Zhang L, Tuomilehto J, Qiao Q:A simple Chinese risk score for undiagnosed diabetes.Diabet Med 2010,27:274-281.
46. Glümer C, Carstensen B, Sabdbaek A, Lauritzen T, Jørgensen T, Borch-Johnsen K:A Danish diabetes risk score for targeted screening.Diabetes Care2004,27:727-733.
47. Keesukphan P, Chanprasertyothin S, Ongphiphadhanakul B, Puavilai G:The development and validation of a diabetes risk score for high-risk Thai adults.J Med Assoc Thai2007,90:149-154.
48. Ko G, So W, Tong P, Ma R, Kong A, Ozakit R, Chow C, Cockram C, Chan J:A simple risk score to identify Southern Chinese at high risk for diabetes. Diabet Med2010,27:644-649.
49. Mohan V, Deepa R, Deepa M, Somannavar S, Datta M:A simplified Indian Diabetes Risk Score for screening for undiagnosed diabetic subjects.J Assoc Physicians India2005,53:759-763.
50. Pires de Sousa AG, Pereira AC, Marquezine GF, Marques do Nascimento-Neto R, Freitas SN, Nicolato RLdC, Machado-Coelho GL, Rodrigues SL, Mill JG, Krieger JE:Derivation and external validation of a simple prediction model for the diagnosis of type 2 diabetes mellitus in the Brazilian urban population.Eur J Epidemiol2009,24:101-109. 51. Ramachandran A, Snehalatha C, Vijay C, Wareham NJ, Colagiuri S:
Derivation and validation of diabetes risk score for urban Asian Indians. Diabetes Res Clin Pract2005,70:63-70.
52. Ruige JB, de Neeling JND, Kostense PJ, Bouter LM, Heine RJ:Performance of an NIDDM screening questionnaire based on symptoms and risk factors.Diabetes Care1997,20:491-496.
53. Tabaei BP, Herman WH:A multivariate logistic regression equation to screen for diabetes: development and validation.Diabetes Care2002, 25:1999-2003.
54. Bindraban NR, van Valkengoed IGM, Mairuhu G, Holleman F, Hoekstra JBL, Michels BPJ, Koopmans RP, Stronks K:Prevalence of diabetes mellitus and the performance of a risk score among Hindustani Surinamese, African Surinamese and ethnic Dutch: a cross-sectional population-based study. BMC Public Health2008,8:271.
55. Griffin SJ, Little PS, Hales CN, Kinmonth AL, Wareham NJ:Diabetes risk score: towards earlier detection of type 2 diabetes in general practice. Diabetes Metab Res Rev2000,16:164-171.
56. Heikes KE, Eddy DM, Arondekar B, Schlessinger L:Diabetes Risk Calculator: a simple tool for detecting undiagnosed diabetes and pre-diabetes. Diabetes Care2008,31:1040-1045.
57. Kanaya AM, Wassel Fyr CL, de Rekeneire N, Schwartz AV, Goodpaster BH, Newman AB, Harris T, Barrett-Connor E:Predicting the development of diabetes in older adults: the derivation and validation of a prediction rule.Diabetes Care2005,28:404-408.
58. Gray LJ, Taub NA, Khunti K, Gardiner E, Hiles S, Webb DR, Srinivasan BT, Davies MJ:The Leicester Risk Assessment score for detecting
undiagnosed type 2 diabetes and impaired glucose regulation for use in a multiethnic UK setting.Diabet Med2010,27:887-895.
59. Borrell LN, Kunzel C, Lamster I, Lalla E:Diabetes in the dental office: using NHANES III to estimate the probability of undiagnosed disease.J Periodontal Res2007,42:559-565.
60. Al Khalaf MM, Eid MM, Najjar HA, Alhajry KM, Doi SA, Thalib L:Screening for diabetes in Kuwait and evaluation of risk scores.East Mediterr Health J 2010,16:725-731.
61. Liu M, Pan C, Jin M:A Chinese diabetes risk score for screening of undiagnosed diabetes and abnormal glucose tolerance.Diabetes Technol Ther2011,13:501-507.
62. Sullivan LM, Massaro JM, D’Agostino RB Sr:Presentation of multivariate data for clinical use: the Framingham study risk score functions.Stat Med2004,23:1631-1660.
63. Peduzzi P, Concato J, Kemper E, Holford TR, Feinstein AR:A simulation study of the number of events per variable in logistic regression analysis.J Clin Epidemiol1996,49:1373-1379.
64. Feinstein AR:Multivariable Analysis: An IntroductionNew Haven: Yale University Press; 1996.
65. Babyak MA:What you see may not be what you get: a brief, nontechnical introduction to overfitting in regression-type models. Psychosom Med2004,66:411-421.
66. Concato J, Peduzzi P, Holford TR, Feinstein AR:Importance of events per independent variable in proportional hazards analysis. I. Background, goals, and general strategy.J Clin Epidemiol1995,48:1495-1501. 67. Royston P, Altman DG, Sauerbrei W:Dichotomizing continuous predictors
in multiple regression: a bad idea.Stat Med2006,25:127-141. 68. Hukkelhoven CWPM, Rampen AJJ, Maas AIR, Farace E, Habbema JDF,
Marmarou A, Marshall LF, Murray GD, Steyerberg EW:Some prognostic models for traumatic brain injury were not valid.J Clin Epidemiol2006, 59:132-143.
69. Leushuis E, van der Steeg JW, Steures P, Bossuyt PMM, Eijkemans MJC, van der Veen F, Mol BWJ, Hompes PGA:Prediction models in reproductive medicine.Hum Reprod Update2009,15:537-552.
70. Mallett S, Royston P, Dutton S, Waters R, Altman DG:Reporting methods in studies developing prognostic models in cancer: a review.BMC Med 2010,8:20.
71. Mallett S, Royston P, Waters R, Dutton S, Altman DG:Reporting performance of prognostic models in cancer: a review.BMC Med2010,8:21.
72. Mushkudiani NA, Hukkelhoven CWPM, Hernandez AV, Murray GD, Choi SC, Maas AIR, Steyerberg EW:A systematic review finds methodological improvements necessary for prognostic models in determining traumatic brain injury outcomes.J Clin Epidemiol2008,61:331-343. 73. Perel P, Edwards P, Wentz R, Roberts I:Systematic review of prognostic
models in traumatic brain injury.BMC Med Inform Decis Mak2006,6:38. 74. Wasson JH, Sox HC, Neff RK, Goldman L:Clinical prediction rules:
applications and methodological standards.N Engl J Med1985, 313:793-799.
75. Lagakos SW:Effects of mismodelling and mismeasuring explanatory variables on tests of their association with a response variable.Stat Med 1988,7:257-274.
76. Royston P, Sauerbrei W:Multivariable Model-Building: A Pragmatic Approach to Regression Analysis Based on Fractional Polynomials for Modelling Continuous VariablesChichester: John Wiley & Sons; 2008.
77. Little RA:Regression with missing X’s: a review.J Am Stat Assoc1992, 87:1227-1237.
79. Marshall A, Altman DG, Royston P, Holder RL:Comparison of techniques for handling missing covariate data withing prognostic modelling studies: a simulation study.BMC Med Res Meth2010,10:7. 80. Vergouwe Y, Royston P, Moons KGM, Altman DG:Development and
validation of a prediction model with missing predictor data: a practical approach.J Clin Epidemiol2010,63:205-214.
81. Sun GW, Shook TL, Kay GL:Inappropriate use of bivariable analysis to screen risk factors for use in multivariable analysis.J Clin Epidemiol1996, 49:907-916.
82. Austin PC, Tu JV:Automated variable selection methods for logistic regression produced unstable models for predicting acute myocardial infarction mortality.J Clin Epidemiol2004,57:1138-1146.
83. Steyerberg EW, Eijkemans MJ, Habbema JD:Stepwise selection in small data sets: a simulation study of bias in logistic regression analysis.J Clin Epidemiol1999,52:935-942.
84. Steyerberg EW, Eijkemans MJC, Harrell FE Jr, Habbema JDF:Prognostic modelling with logistic regression analysis: a comparison of selection and estimation methods in small data sets.Stat Med2000,19:1059-1079. 85. Altman DG, Royston P:What do we mean by validating a prognostic
model?Stat Med2000,19:453-473.
86. Altman DG, Vergouwe Y, Royston P, Moons KGM:Prognosis and prognostic research: validating a prognostic model.BMJ2009,338:b605. 87. Laupacis A, Sekar N, Stiell IG:Clinical prediction rules: a review and
suggested modifications of methodological standards.JAMA1997, 277:488-494.
88. Hier DB, Edelstein G:Deriving clinical prediction rules from stroke outcome research.Stroke1991,22:1431-1436.
89. Ritter AV, Shugars DA, Bader JD:Root caries risk indicators: a systematic review of risk models.Community Dent Oral Epidemiol2010,38:383-397. 90. Schulz KF, Altman DG, Moher D, CONSORT Group:CONSORT 2010
statement: updated guidelines for reporting parallel group randomized trials.Ann Intern Med2010,152:726-732.
91. Little J, Higgins JP, Ioannidis JP, Moher D, Gagnon F, von Elm E, Khoury MJ, Cohen B, Davey-Smith G, Grimshaw J, Scheet P, Gwinn M, Williamson RE, Zou GY, Hutchings K, Johnson CY, Tait V, Wiens M, Golding J, van Duijn C, McLaughlin J, Paterson A, Wells G, Fortier I, Freedman M, Zecevic M, King R, Infante-Rivard C, Stewart A, Birkett N, STrengthening the REporting of Genetic Association Studies:STrengthening the REporting of Genetic Association Studies (STREGA): an extension of the STROBE statement. PLoS Med2009,6:e22.
92. McShane LM, Altman DG, Sauerbrei W, Taube SE, Gion M, Clark GM, Statistics Subcommittee of NCI-EORTC Working Group on Cancer Diagnostics:REporting recommendations for tumor MARKer prognostic studies (REMARK).Breast Cancer Res Treat2006,100:229-235.
93. Hopewell S, Dutton S, Yu LM, Chan AW, Altman DG:The quality of reports of randomised trials in 2000 and 2006: comparative study of articles indexed in PubMed.BMJ2010,340:c723.
94. Plint AC, Moher D, Morrison A, Schulz K, Altman DG, Hill C, Gaboury I:Does the CONSORT checklist improve the quality of reports of randomised controlled trials? A systematic review.Med J Aust2006,185:263-267. 95. Webster JD, Dennis MM, Dervisis N, Heller J, Bacon NJ, Bergman PJ,
Bienzle D, Cassali G, Castagnaro M, Cullen J, Esplin DG, Peña L,
Goldschmidt MH, Hahn KA, Henry CJ, Hellmén E, Kamstock D, Kirpensteijn J, Kitchell BE, Amorim RL, Lenz SD, Lipscomb TP, McEntee M, McGill LD, McKnight CA, McManus PM, Moore AS, Moore PF, Moroff SD, Nakayama H, American College of Veterinary Pathologists’Oncology Committee,et al: Recommended guidelines for the conduct and evaluation of prognostic studies in veterinary oncology.Vet Pathol2011,48:7-18.
Pre-publication history
The pre-publication history for this paper can be accessed here: http://www.biomedcentral.com/1741-7015/9/103/prepub
doi:10.1186/1741-7015-9-103
Cite this article as:Collinset al.:Developing risk prediction models for type 2 diabetes: a systematic review of methodology and reporting.
BMC Medicine20119:103.
Submit your next manuscript to BioMed Central and take full advantage of:
• Convenient online submission
• Thorough peer review
• No space constraints or color figure charges
• Immediate publication on acceptance
• Inclusion in PubMed, CAS, Scopus and Google Scholar
• Research which is freely available for redistribution