©2003. Biological Procedures Online. Published in Biological Procedures Online under license from the author(s). Copying, printing, redistribution and storage permitted.
Biol. Proced. Online 2004;6(1): 94-104.
Suppression subtractive hybridization coupled with microarray
analysis to examine differential expression of genes in virus
infected cells
Shirin Munir,
1*Sushmita Singh,
1Kuljeet Kaur
1and Vivek Kapur
11Departments of Microbiology and Veterinary Biomedical Sciences, and Biomedical Genomics Center,
University of Minnesota, St. Paul, MN 55108, USA.
*To whom correspondence should be addressed: Shirin Munir: Department of Microbiology and Biomedical Genomics Center, 1500 Gortner Avenue, University of Minnesota, St. Paul, MN 55108. Tel: (612) 625-9277; Fax: (612) 624-6264; E-mail: [email protected]
Submitted: March 22, 2004; Revised: May 7, 2004; Accepted: May 12, 2004; Published: May 26, 2004.
Indexing terms: Gene expression; Pneumovirus; Chickens.
ABSTRACT
High throughput detection of differential expression of genes is an efficient means of identifying genes and pathways that may play a role in biological systems under certain experimental conditions. There exist a variety of approaches that could be used to identify groups of genes that change in expression in response to a particular stimulus or environment. We here describe the application of suppression subtractive hybridization (SSH) coupled with cDNA microarray analysis for isolation and identification of chicken transcripts that change in expression on infection of host cells with a paramyxovirus. SSH was used for initial isolation of differentially expressed transcripts, a large-scale validation of which was accomplished by microarray analysis. The data reveals a large group of regulated genes constituting many biochemical pathways that could serve as targets for future investigations to explore their role in paramyxovirus pathogenesis. The detailed methods described herein could be useful and adaptable to any biological system for studying changes in gene expression.
INTRODUCTION
The global investigation of changes in gene expression in a biological system can be carried out with a variety of available tools that promise the identification of differentially expressed transcripts between two populations of mRNA. These include differential analysis of library expression (DAZLE) (1), differential display (2, 3), representational difference analysis (4), enzymatic degradation subtraction (5), linker capture subtraction (6), techniques involving physical removal of common sequences (7, 8) and serial analysis of gene expression (9). Despite the fact that these methods have proven successful in isolation of differentially expressed genes, they all possess some intrinsic drawbacks. In addition to their specific limitations, a common feature is the inability to isolate rare transcripts, i.e., the
SSH and microarray have been successfully used together for studying gene expression profiles in various systems (23, 24). There are several advantages of using SSH in combination with microarray analysis that make them appealing for identifying differentially expressed sequences. SSH is a comprehensive, large-scale gene expression based approach that allows unbiased discovery of the genes induced or suppressed by a particular treatment. Further, since SSH allows the isolation of differentially expressed cDNAs without a prior knowledge of their sequence, it is highly desirable for studying differential gene expression in systems where information on the genomic sequence is scarce. Once isolated by SSH, the validity of SSH sequences can be confirmed by utilizing the high throughput method of microarray hybridization. The main advantage of using microarray analysis is that the expression status of thousands of SSH clones can be validated simultaneously when spotted on the same array and hybridized with the test sample thus generating significant amount of information that is difficult to obtain with any other currently available method.
Infection of host cells with a viral pathogen marks the onset of changes in the host cell’s microenvironment. These are initiated by the host to retard or stop virus propagation as well as by the virus to facilitate its own replication and spread. Defining the transcriptional regulation of host genes on virus infection can be used as a tool to obtain an elaborate insight into mechanisms of host-virus interactions that can help unravel the molecular basis of disease pathogenesis. In this report a detailed description of the methods used in the application of SSH and cDNA microarray analysis to identify differentially expressed genes is presented. This paper serves as a technical methods supplement for our previously reported investigation (25) describing the isolation and identification of differentially expressed genes in chicken cells infected with avian metapneumovirus (aMPV). aMPV is a paramyxovirus and the causal agent of turkey rhinotracheitis, an acute and contagious respiratory infection of turkeys with worldwide distribution (26). We here provide a detailed description of the methodologies used to obtain highly intriguing information on the changes in host gene expression on infection with aMPV. The methods described herein could be easily adapted to any biological system for investigating transcriptional changes in response to a particular treatment or environment.
MATERIALS AND METHODS
Cells and virus
Ten day old embryonated, specific-pathogen-free chicken eggs (SPAFAS, North Franklin, Conn.) were used to prepare primary chicken embryo cells which were grown in a medium containing equal quantities of Leibovitz and McCoy’s medium with 5% fetal bovine serum, 100 IU of penicillin G/ml, and 100mg of dihydrostreptomycin/ml in 150-mm-diameter tissue culture dishes. Confluent cells were passed once and plated into 150-mm-diameter dishes. Cells were ~95% confluent after 24 h of incubation. At this stage they were infected with the Colorado strain of aMPV subtype C at a multiplicity of infection of 0.25 PFU per cell in a volume of 10ml of medium and were allowed
to adsorb at 37°C for 1h. Once adsorbed 25ml of Leibovitz McCoy’s medium was added to the culture and incubated at 37°C. For uninfected controls, cells were mock-treated with sterile media and processed exactly as the infected cells. Cells were harvested at 2.5, 24, 48, and 96h post-infection from both the uninfected control and the aMPV-infected cultures for RNA extraction.
Construction of subtracted cDNA libraries using SSH technique
Adherent cells from aMPV-infected and control samples were washed once with phosphate-buffered saline, lysed and homogenized in Trizol reagent (Invitrogen Life Technologies, Carlsbad, CA). Total RNA was extracted according to the manufacturer’s instructions. Poly(A+) mRNA was isolated from the total RNA using Oligotex mRNA spin columns (Qiagen, Valencia, CA) following the manufacturer’s instructions.
cDNA cloning
The subtracted target cDNAs were ligated (27) with the pGEM-T plasmid vector (Promega, Madison, Wis.) using pGEM-T4 DNA ligase and transformed into maximum efficiency Escherichia coli DH5α cells (Life Technologies). The transformed bacteria were plated onto LB agar plates containing ampicillin , X-gal, IPTG, followed by overnight incubation at 37°C. pGEM-T plasmid contains LacZ reporter at the multiple cloning site and allows blue white screening. Recombinant white colonies were randomly selected and cultured in LB broth containing ampicillin followed by plasmid extraction performed with QIAwell 96-well plasmid purification system (Qiagen). A total of 960 forward and reverse subtracted clones were sequenced by automated DNA sequencing (28) at the Advanced Genetic Analysis Center, University of Minnesota. The sequences were identified based on homology searches with a range of databases including Swiss-Prot, TrEMBL, PIR, NRL-3D, and GenPept. Sequence data were analyzed and edited for quality and vector sequences by using Phred-Phrap/Consed analysis software.
Printing SSH cDNA clones on Poly-L-Lysine coated slides
A cDNA microarray chip containing 2,950 cDNA spots representing 960 SSH clones was constructed as previously described (29, 30). Briefly, 576 forward SSH and 384 reverse SSH clone inserts were amplified by PCR using a primer pair corresponding to the flanking adaptor sequences (Clontech). The PCR products were visualized on 1% agarose gels to ensure quality and quantity of amplification, followed by purification with Multiscreen PCR plates (Millipore, Bedford, Mass.). Triplicates to the PCR products were printed onto poly-L-lysine coated glass slides by employing a Microgrid II robot (BioRobotics, Boston, Mass.). Chlorophyll a/b-binding protein (Cab) gene (Stratagene) from Arabidopsis thaliana were included as negative controls while total chicken cellular cDNA was included as a positive control. The control elements were spotted 14 times each on the array.
cDNA probe synthesis and hybridization
Poly (A+) RNA was purified from aMPV-infected and uninfected control cells at various time points with oligotex mRNA extraction kit (Qiagen) as per manufacturers instructions. RNA thus obtained was reverse transcribed using an oligo(dT)12-18 primer, deoxynucleoside triphosphates, aminoallyl dUTP, and Superscript II reverse transcriptase (Invitrogen Life Techologies). Monofunctional Cy3 and Cy5 dyes (Amersham, Piscataway, NJ) were used to label uninfected control and infected samples, respectively and later hybridized with the spotted array at 67°C for 5h. A. thaliana Cab gene mRNA (Stratagene, La Jolla, CA) was spiked into the cDNA synthesis
reactions of both samples for each hybridization to serve as controls for data normalization. Optimal hybridization conditions under which there was no appreciable cross-hybridization with the control spots were ascertained to maximize specificity and sensitivity. Images of the hybridized arrays were acquired by laser confocal scanning (Scanarray 5000; GSI Lumonics, Watertown, Mass.). Analysis was conducted using Quantarray, version 3.0 (GSI Lumonics) and Spotfire Decision site, version 6.5 software.
Data analysis
The complete experiment starting with primary culture of cells and their infection to RNA isolation was performed twice. Probe synthesis and hybridization to microarray were conducted twice per independent experiment resulting in 12 independent Cy5/Cy3 intensity ratio data points for each spotted cDNA at each time point. Cy5 and Cy3 intensities for each spot on the array were determined with Quantarray 3.0 software (GSI Lumonics). The raw data thus obtained was normalized before being subjected to further analysis. The following steps represent how the Cy5 to Cy3 ratios were calculated including measures to ensure quality control:
i. Subtraction of local background fluorescence from the fluorescence intensity of each of the Cy3 and Cy5 spots. ii. Normalization of the entire data set for both channels based
on A. thaliana cab gene control.
iii. Elimination of spots with high background intensity for either dye.
iv. Calculation of Cy5/Cy3 intensity ratios and elimination of replicate spots that had a Cy5/Cy3 ratio 2 or more standard deviations higher than the mean intensity ratio.
v. Averaging of replicate spots and determination of differential expression.
Gene identifiers and descriptions were imported into the data set and further analysis and visualization of expression profiles was conducted with Spotfire Decision Site software, version 6.5.
Validation of differential expression of genes by real-time RT-PCR
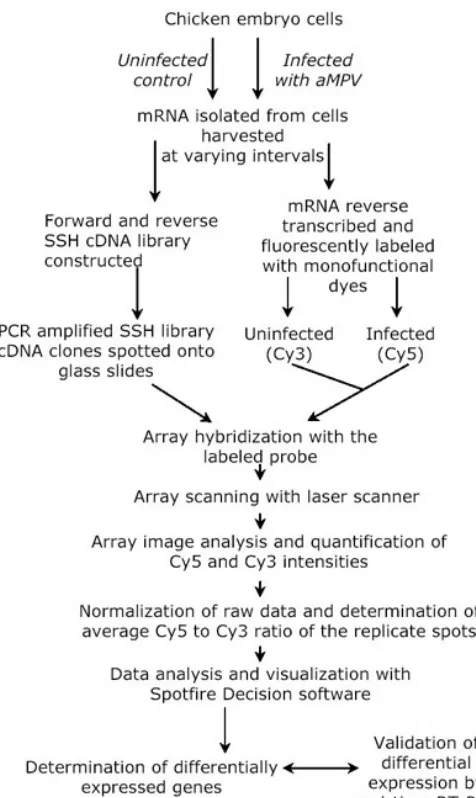
Fig. 1: An overview of the combined application of SSH and cDNA microarray to isolate differentially expressed transcripts. Poly A+ RNA was purified from aMPV infected and uninfected control chicken embryo cells. Forward and reverse subtracted cDNA libraries were constructed using the SSH technology. Random clones were picked and nucleotide sequence determined. The identity of the clones was determined by blast search against the public sequence databases. The cDNA inserts of all SSH clones were amplified by PCR using oligonucleotide primers corresponding to the adaptor sequences flanking the cDNA. PCR products were spotted onto poly-L-lysine coated glass slides. Poly A+ RNA extracted from aMPV infected and uninfected control chicken embryo cells was labeled with Cy5 and Cy3 monofunctional dyes, respectively and hybridized with the spotted array. Images of the hybridized arrays were captured with laser confocal scanner and Cy5/Cy3 intensities determined with Quantarray software. The data was normalized based on Arabidopsis thaliana cab gene control spots. Average Cy5/Cy3 ratios were calculated using the Cy5/Cy3 ratios of the replicate spots and the genes exhibiting differential expression were identified. Finally, validation of the differential expression of a selected group of genes was carried out by real-time RT-PCR using SYBR green-based detection. RT-PCR was performed with gene specific primer pairs and was run on ABI 7700 fluorescent sequence detection system.
RESULTS AND DISCUSSION
The present study describes the combined application of cDNA subtraction and microarray technologies to reveal intriguing
information on changes in host gene expression following infection with a paramyxovirus. A total of 960 SSH clones were randomly selected and subjected to nucleotide sequence analysis. On homology searches of the public sequence databases, 507 (53%) of these were unique genes while the rest represented redundant sequences or various fragments of the same cDNA. Among the unique genes, 58% sequences had no homologue in the public sequence databases, 9% had similarity to sequences with undefined functions in other eukaryotes while the rest showed similarity to previously identified chicken, mouse and human sequences. The transcripts isolated by SSH that had similarity to sequences with known functions were classified into functional groups as shown in Figure 2 using Genespring 6.1 software (Silicon Genetics, Redwood City, CA).
Fig. 2: The distribution of the SSH isolated transcripts based on known functions. The genes were classified into various functional groups using Genespring 6.1 software (Silicon Genetics, Redwood City, CA). The percentages represent the % of genes belonging to a particular functional group of the total number of genes with “known” functions. The genes with unknown functions or the sequences that did not have any homology to known sequences in public databases are not shown.
On microarray analysis, expression levels of 352 genes of the total 507 unique sequences were found to be altered with 268 and 84 genes showing an up- and down-regulation of expression, respectively, over the entire 96h experimental period. The numbers of genes showing altered expression at each of the four time points are listed in Table 1.
Table 1: Number of genes transcriptionally altered over a 96h time-course.
Hours PI Induced genesº Repressed genesº Total
2.5 30(19) 0 30
24 95(67) 8(4) 103
48 206(154) 95(36) 301
96 265(199) 78(31) 343
¿Numbers represent the total number of genes showing altered expression by a factor >2 by microarray analysis.
Number of novel genes or those with unknown functions of the total regulated genes are shown in parenthesis.
protein trafficking and fusion, antigen presentation, cytoskeletal and extracellular matrix protein genes (Table 2). A group of genes of interest found to be differentially expressed by microarray analysis as well as a few that did not change in
expression were further validated by real-time RT-PCR assay. The RT-PCR results were in accordance with the microarray data for 90% of the genes.
Table 2: Differential expression of chicken genes on infection with avian metapneumovirus.
Transcription Fold Change
Gene Accession No. Description 2.5 h 24 h 48 h 96 h
SWP:MX_CHICK Interferon-induced GTP-binding protein Mx* NC 14.20 38.63 61.38 SWP:INI2_PANTR Interferon-induced protein 6-16 precursor* NC 17.39 13.87 30.64 SWP:IFT1_HUMAN Interferon-induced 56 kDa protein* 6.89 32.28 19.70 20.90 EMB:AAH04977 Interferon-induced protein with tetratricopeptide repeats 4* 4.38 12.60 18.67 6.63
SWP:STA1_HUMAN Signal transducer and activator of transcription 1-α/β* NC 16.36 33.77 54.86 SWP:IFT5_HUMAN Retinoic acid and interferon-inducible 58 kDa protein (RI58) 2.80 31.19 28.30 22.23
EMB:Q9QXH3 α.interferon-inducible protein P27_H* NC 15.28 12.19 23.67
SWP:EMF1_CHICK CXC chemokine 9E3 (Human IL-8 homolog)* 2.39 7.30 39.32 53.84
EMB:O73912 CXC chemokine K60* 2.01 2.43 18.64 18.33
EMB:O35131 Complement C3F* NC 2.24 10.03 12.91
SWP:PRSX_SPETR 26S Protease regulatory subunit S10B NC NC 2.37 2.21 SWP:UBPI_HUMAN Ubiquitin carboxyl-terminal hydrolase 18 (Ubp)* 2.13 11.94 6.23 11.83
EMB:AAH01874 Similar to sequestosome 1* 2.01 NC 2.29 7.78
SWP:CUL1_MOUSE Cullin homolog 1 (CUL-1)* NC NC NC 2.13
EMB:O88544 COP9 Complex subunit 4 NC NC 2.00 2.20
EMB:Q9Y4Z6 Vacuolar protein sorting (Vps45) NC NC 5.18 4.44
EMB:Q9D872 Signal recognition particle receptor B subunit NC NC NC 2.30
EMB:Q9JMJ6 Syntaxin 7 NC NC 2.04 3.42
EMB:Q9Y5P9 Endocytic receptor ENDO 180 NC 2.38 3.06 4.33
SWP:CLH1_HUMAN Clathrin heavy chain 1 (CLH-17) NC NC NC 2.82
EMB:O42404 CD80-like protein precursor* NC NC 2.68 4.67
SWP:TMF1_HUMAN TATA element modulatory factor (TMF)* NC NC 3.24 4.83 SWP:PTB_PIG Polypyrimidine tract-binding protein (PTB) NC NC NC 2.48
EMB:O95320 U5 SNRNP-specific 40 kDa protein NC NC 4.58 7.16
EMB:Q9WVG7 Odd-skipped related 1 protein NC -1.89 -2.15 -2.02
SWP:IF37_MOUSE Translation initiation factor 3 subunit (eIF-3) NC 2.03 5.18 6.45
SWP:RL3_BOVIN 60S ribosomal protein L3 NC NC 9.22 11.15
SWP:PDI_CHICK Protein disulfide isomerase (PDI) NC NC -2.32 -2.11 SWP:IF2P_HUMAN Translation initiation factor 2 (IF-2) NC -2.20 -3.20 NC
EMB:Q9PTD6 Ribosomal protein S6 NC NC -3.00 -1.87
SWP:RL5B_XENLA 60S ribosomal protein L5B NC NC -2.67 -2.54
SWP:EF1A_CHICK Elongation factor 1-alpha 1* NC NC -2.46 NC
SWP:NPM_CHICK Nucleophosmin (NPM) (Nucleolar phosphoprotein B23) NC NC -2.18 NC SWP:QSP_CHICK Quiescence-specific protein precursor (P20K) NC 3.97 5.02 7.92
SWP:DIA_DROME Diaphanous protein NC NC -2.06 NC
EMB:Q9U9S7 Adenylyl cyclase 2.18 8.91 9.47 16.52
EMB:O08623 PKC-Zeta-interacting protein (ZIP) NC NC 2.41 6.76
SWP:RSFR_CHICK Ribonuclease homolog precursor (RSFR) NC NC NC 2.54
SWP:SSGP_VOLCA Sulfated surface glycoprotein 185 (SSG 185) 2.22 20.78 16.18 40.35 SWP:N107_HUMAN Nuclear pore complex protein NUP107 NC NC 2.23 2.08
A partial list of the genes exhibiting change in transcription by a factor > 2 in aMPV infected compared to un-inoculated control cells is shown. The sequence accession numbers (SwissProt, EMBL databases), gene names, and fold change in transcription at 2.5, 24, 48, and 96 hours post-infection are listed. The time course experiment was repeated twice and the hybridization with fluorescent-labeled probe was repeated twice per infection experiment. Transcription fold change values are the average of Cy5 to Cy3 ratios of the replicates from four experiments.
The roles and potential implications of the regulated expression of most of these genes have been discussed in detail elsewhere (25). Overall, the results obtained in this investigation provided insight into the previously unknown complexities of host-aMPV molecular interactions. The discovery of differential expression of genes in aMPV infected cells allowed the visualization of several pathways and potential mechanisms that may play a role in aMPV pathogenesis. Identification of regulated genes in aMPV infected cells enabled the development of a model depicting several ways in which host cell responds to infection including
changes that are potentially antiviral such as interferon-stimulated genes and others that may favor virus propagation for instance vesicular protein trafficking and fusion proteins. Gene expression changes also provided clues about the possible mechanisms involved in the development of pathological changes that are characteristic of the disease. Most importantly, the data obtained in this study identifies several genes whose mRNA is regulated on virus infection suggesting an array of hypotheses which could be tested to reveal their role in aMPV molecular pathogenesis.
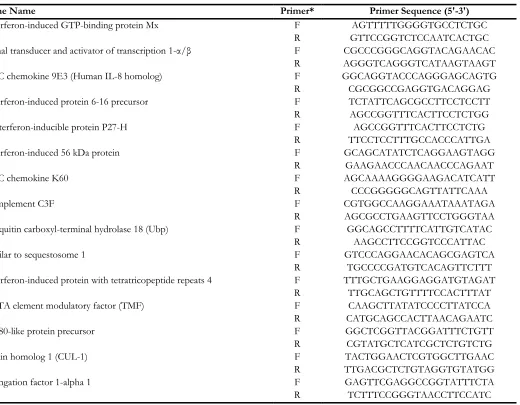
Table 3: Primer sequences used for real-time RT-PCR.
Gene Name Primer* Primer Sequence (5'-3')
Interferon-induced GTP-binding protein Mx F AGTTTTTGGGGTGCCTCTGC
R GTTCCGGTCTCCAATCACTGC
Signal transducer and activator of transcription 1-α/β F CGCCCGGGCAGGTACAGAACAC
R AGGGTCAGGGTCATAAGTAAGT
CXC chemokine 9E3 (Human IL-8 homolog) F GGCAGGTACCCAGGGAGCAGTG
R CGCGGCCGAGGTGACAGGAG
Interferon-induced protein 6-16 precursor F TCTATTCAGCGCCTTCCTCCTT
R AGCCGGTTTCACTTCCTCTGG
α.interferon-inducible protein P27-H F AGCCGGTTTCACTTCCTCTG
R TTCCTCCTTTGCCACCCATTGA
Interferon-induced 56 kDa protein F GCAGCATATCTCAGGAAGTAGG
R GAAGAACCCAACAACCCAGAAT
CXC chemokine K60 F AGCAAAAGGGGAAGACATCATT
R CCCGGGGGCAGTTATTCAAA
Complement C3F F CGTGGCCAAGGAAATAAATAGA
R AGCGCCTGAAGTTCCTGGGTAA
Ubiquitin carboxyl-terminal hydrolase 18 (Ubp) F GGCAGCCTTTTCATTGTCATAC
R AAGCCTTCCGGTCCCATTAC
Similar to sequestosome 1 F GTCCCAGGAACACAGCGAGTCA
R TGCCCCGATGTCACAGTTCTTT
Interferon-induced protein with tetratricopeptide repeats 4 F TTTGCTGAAGGAGGATGTAGAT
R TTGCAGCTGTTTTCCACTTTAT
TATA element modulatory factor (TMF) F CAAGCTTATATCCCCTTATCCA
R CATGCAGCCACTTAACAGAATC
CD80-like protein precursor F GGCTCGGTTACGGATTTCTGTT
R CGTATGCTCATCGCTCTGTCTG
Cullin homolog 1 (CUL-1) F TACTGGAACTCGTGGCTTGAAC
R TTGACGCTCTGTAGGTGTATGG
Elongation factor 1-alpha 1 F GAGTTCGAGGCCGGTATTTCTA
R TCTTTCCGGGTAACCTTCCATC
Gene specific primer sequences shown were used for real-time RT-PCR validation of the changes in gene expression in virus infected cells revealed by SSH and microarray analyses. Real-time PCR based on SYBR green (ABI) mediated detection was run on an ABI 7700 fluorescent sequence detection system (Perkin-Elmer, Foster City, CA, USA).
* Primer sequences are named as F and R representing forward and reverse primer sequences, respectively.
Taken together, the present investigation demonstrates the application of a powerful approach of combining the high throughput technologies of SSH and microarray to study differential expression of genes in response to virus infection. SSH could be used for initial isolation of differentially expressed
ACKNOWLEDGMENTS
S.M. is supported by a post-doctoral fellowship from Cargill Inc. Animal Genomics Research Program. Research in the laboratory of V.K. is supported by competitive awards from the National Institutes of Health, US Department of Agriculture’s NRI and IFAFS programs, the Minnesota Turkey Research and Promotion Council, and the Minnesota Agricultural Experiment Station.
REFERENCES
1. Li H, Gu X, Dawson VL, Dawson TM. Identification of calcium- and nitric oxide-regulated genes by differential analysis of library expression (DAzLE). Proc Natl Acad Sci USA 2004; 101(2):647-652.
2. Liang P, Pardee AB. Differential display of eukaryotic messenger RNA by means of the polymerase chain reaction. Science 1992; 257(5072):967-971.
3. Sokolov BP, Prockop DJ. A rapid and simple PCR-based method for isolation of cDNAs from differentially expressed genes. Nucleic Acids Res 1994; 22(19):4009-4015.
4. Lisitsyn N, Lisitsyn N, Wigler M. Cloning the differences between two complex genomes. Science 1993; 259(5097):946-951.
5. Zeng J, Gorski RA, Hamer D. Differential cDNA cloning by enzymatic degrading subtraction (EDS). Nucleic Acids Res 1994; 22(21):4381-4385.
6. Yang M, Sytkowski AJ. Cloning differentially expressed genes by linker capture subtraction. Anal Biochem 1996; 237(1):109-114.
7. Akopian AN, Wood JN. Peripheral nervous system-specific genes identified by subtractive cDNA cloning. J Biol Chem 1995; 270(36):21264-21270.
8. Deleersnijder W, Hong G, Cortvrindt R, Poirier C, Tylzanowski P, Pittois K, Van Marck E, Merregaert J. Isolation of markers for chondro-osteogenic differentiation using cDNA library subtraction. Molecular cloning and characterization of a gene belonging to a novel multigene family of integral membrane proteins. J Biol Chem 1996; 271(32):19475-19482.
9. Velculescu VE, Zhang L, Vogelstein B, Kinzler KW. Serial analysis of gene expression. Science 1995; 270(5235):484-487. 10. Diatchenko L, Lau YF, Campbell AP, Chenchik A,
Moqadam F, Huang B, Lukyanov S, Lukyanov K, Gurskaya N, Sverdlov ED, Siebert PD. Suppression subtractive hybridization: a method for generating differentially regulated or tissue-specific cDNA probes and libraries. Proc Natl Acad Sci USA 1996; 93(12):6025-6030.
11. Shackel NA, McGuinness PH, Abbott CA, Gorrell MD, McCaughan GW. Novel differential gene expression in human cirrhosis detected by suppression subtractive hybridization. Hepatology 2003; 38(3):577-588.
12. Kiss C, Nishikawa J, Dieckmann A, Takada K, Klein G, Szekely L. Improved subtractive suppression hybridization combined with high density cDNA array screening identifies
differentially expressed viral and cellular genes. J Virol Methods 2003; 107(2):195-203.
13. Patzwahl R, Meier V, Ramadori G, Mihm S. Enhanced expression of interferon-regulated genes in the liver of patients with chronic hepatitis C virus infection: detection by suppression-subtractive hybridization, J Virol 2001; 75(3):1332-1338.
14. Kuang WW, Thompson DA, Hoch RV, Weigel RJ. Differential screening and suppression subtractive hybridization identified genes differentially expressed in an estrogen receptor-positive breast carcinoma cell line. Nucleic Acids Res 1998; 26(4):1116-1123.
15. Carmeci C, Thompson DA, Kuang WW, Lightdale N, Furthmayr H, Weigel RJ. Moesin expression is associated with the estrogen receptor-negative breast cancer phenotype. Surgery 1998; 124(2):211-217.
16. Nam JH, Hwang KA, Yu CH, Kang TH, Shin JY, Choi WY, Kim IB, Joo YR, Cho HW, Park KY. Expression of interferon inducible genes following Hantaan virus infection as a mechanism of resistance in A549 cells. Virus Genes 2003; 26(1):31-38.
17. Su ZZ, Chen Y, Kang DC, Chao W, Simm M, Volsky DJ, Fisher PB. Customized rapid subtraction hybridization (RaSH) gene microarrays identify overlapping expression changes in human fetal astrocytes resulting from human immunodeficiency virus-1 infection or tumor necrosis factor-alpha treatment. Gene 2003; 306:67-78.
18. Nam JH, Yu CH, Hwang KA, Kim S, Ahn SH, Shin JY, Choi WY, Joo YR, Park KY. Application of cDNA microarray technique to detection of gene expression in host cells infected with viruses. Acta Virol 2002; 46(3):141-146. 19. Aizaki H, Harada T, Otsuka M, Seki N, Matsuda M, Li YW,
Kawakami H, Matsuura Y, Miyamura T, Suzuki T. Expression profiling of liver cell lines expressing entire or parts of hepatitis C virus open reading frame. Hepatology 2002; 36(6):1431-1438.
20. Jones JO, Arvin AM. Microarray analysis of host cell gene transcription in response to varicella-zoster virus infection of human T cells and fibroblasts in vitro and SCIDhu skin xenografts in vivo. J Virol 2003; 77(2):1268-1280.
21. Carter KL, Cahir-McFarland E, Kieff E. Epstein-barr virus-induced changes in B-lymphocyte gene expression. J Virol 2002; 76(20):10427-10436.
22. Zhu H, Zhao H, Collins CD, Eckenrode SE, Run Q, McIndoe RA, Crawford JM, Nelson DR, She JX, Liu C. Gene expression associated with interferon alfa antiviral activity in an HCV replicon cell line. Hepatology 2003; 37(5):1180-1188.
23. Yang GP, Ross DT, Kuang WW, Brown PO, Weigel RJ. Combining SSH and cDNA microarrays for rapid identification of differentially expressed genes. Nucleic Acids Res 1999; 27(6):1517-1523.
25. Munir S, Kapur V. Regulation of host cell transcriptional physiology by the avian pneumovirus provides key insights into host-pathogen interactions. J Virol 2003; 77(8):4899-4910.
26. Cook JK. Avian pneumovirus infections of turkeys and chickens. Vet J 2000; 160(2):118-125.
27. Sambrook J, Maniatis T, Fritsch EF. Molecular cloning: A Laboratory Manual. Cold Spring Harbor Laboratory 1989; Cold Spring Harbor, NY.
28. Zimmermann J, Voss H, Schwager C, Stegemann J, Ansorge W. Automated Sanger dideoxy sequencing reaction protocol. FEBS Lett 1988; 233(2):432-436.
29. Schena M, Shalon D, Davis RW, Brown PO. Quantitative monitoring of gene expression patterns with a complementary DNA microarray. Science 1995; 270(5235):467-470.
PROTOCOLS
cDNA microarray construction
Preparation of poly-L-lysine coated slides (for 180 slides).
Wash solution: 200 g NaOH pellets, 1200 ml 95% EtOH, 800 ml Milli-Q H2O.
Poly-l-lysine solution (use only plastic ware for poly-l-lysine): 1500 ml Milli-Q-H2O, 205 ml 1X PBS (filtered), 352 ml poly-l-lysine (to be mixed in the order
listed).
Use powder-free gloves and Milli-Q-H2O for entire procedure.
1. Place Goldseal Microslides securely in slide rack and rinse completely with water. 2. Pour wash solution over slides and shake gently for 2 hours.
3. Rinse slides vigorously with several liters of water.
4. Let slides sit in water while you prepare the poly-l-lysine solution.
5. Dump water from slides and immediately pour poly-l-lysine solution over them. 6. Shake slides gently for 30 minutes.
7. Rinse slides again with water in a vigorous fashion. 8. Immediately spin slides at 600 rpm for ~ 5 minutes.
9. Place slides rack in 50°C vacuum oven for 5 minutes to ensure complete dryness. 10. Store slides in a clean plastic slide box.
11. Slides MUST be stored for at least 14 days before spotting DNA.
Post-processing of microarrays
Hydration and heat fixing: 1X SSC, hydration tray, slide warmer, heat block 1. Pick out slides to be processed.
2. Etch lines above and below the array on the back of the slides to mark array. 3. Pour 100 ml of 1X SSC into hydration tray and warm on slide warmer at 37°C. 4. Set slide array down and observe spots until proper hydration is achieved. 5. Once hydrated immediately snap dry slide, array side up on heat block. 6. Place slide in rack.
Surface blocking: Succinic anhydride (Sigma-Aldrich), 1-methyl-2-pyrrolidinone (Sigma-Aldrich), 1M Sodium borate, pH8.0 (boric acid from Fisher Scientific), 95% Ethanol, boiling water.
1. Pour 335 ml of 1-methyl-2-pyrrolidinone into a slide dish. 2. Add 5.5 g of succinic anhydride to it and let dissolve completely. 3. Add 15 ml of 1M Sodium borate and mix well.
4. Plunge slides rapidly in blocking solution and shake under level for at least 1 min. 5. Soak slides in solution on shaker for 15 min.
6. Drain excess blocking solution off slides and transfer rack to water at 95°C. 7. Plunge rack a couple of times and incubate for 90 s.
8. Transfer rack to 95% Ethanol and plunge 5 times. 9. Spin down slides on table-top centrifuge to dry. 10. Use slides immediately or store for future use.
Total RNA isolation: Trizol reagent (Invitrogen life technologies), RNAse free water, ethanol, chloroform, RNAse free sterilized microfuge tubes. 1. Wash cells with phosphate-buffered saline.
4. Add 0.2 ml chloroform per 1 ml Trizol and shake for 15 s. 5. Incubate at 15-30°C for 2-3 min.
6. Centrifuge at 12k, at 2-8°C for 15 min.
7. Transfer the colorless upper aqueous phase to a fresh tube. 8. Add 0.5 ml isopropanol per 1 ml Trizol.
9. Incubate at 15-30°C for 10 min.
10. Centrifuge at 12k, at 2-8°C for 10 min, forming a gelatinous pellet. 11. Remove and discard supernatant.
12. Wash the RNA pellet in 1 ml of 75% (v/v) ethanol per 1 ml Trizol used. 13. Vortex to resuspend pellet and centrifuge at 7.5k, at 2-8°C for 5 min.
14. Allow the pellet to dry briefly and resuspend in 50-200 µl of RNAse free water. 15. Incubate at 55-60°C for 10 min to ensure total resuspension.
16. Quantify RNA and store at -70°C.
Poly(A+) mRNA isolation: Isolated from total RNA according to the manufacturer’s directions using Oligotex mRNA spin columns (Qiagen, Valencia, CA).
Reverse Transcription and amino-allyl coupling: (derived from a protocol developed at Rosetta Inpharmatics, Kirkland, WA)
RT Reaction: Oligo (dT)12-18 primer (Invitrogen ), 50X aa-dUTP/dNTP mix (10 µl each of 100 mM dATP, dGTP, dCTP, 4 µl of 100 mM aa-dUTP, 6 µl of 100 mM dTTP),SuperScript II (Invitrogen).
Set up the reverse transcription reaction as follows:
1. Mix 1 µg of Oligo (dT)12-18 primer with 300 ng of poly(A+) mRNA and add RNAse free water to a final volume of 15.5 µl. 2. Incubate the reaction mixture at 70°C for 10 min.
3. Chill on ice for 10 min.
4. Set up cDNA synthesis as follows: Mix 6 µl of 5X buffer (supplied with SSII), 0.6 µl of 50X aa-dUTP/dNTP, 3 µl of 0.1M DTT (also comes with SSII), 1.9 µl of SuperScript II (200 U/µl) and 3 µl of RNAse-free water leading to a final volume of 14.5 µl per reaction.
5. Mix the two reaction mixtures and incubate at 42°C for 2h.
Hydrolysis
6. Add and mix 10 µl of 1N NaOH and 10 µl of 0.5M EDTA. 7. Incubate for 15 min at 65°C.
8. Add 25 µl of 1M Tris-HCl pH 7.4 and mix well to neutralize (samples can be stored at 4°C overnight at this point).
Cleanup: Microcon-YM30 filter (Amicon)
9. Fill one Microcon 30 concentrator with 450 µl of RNAse free water. 10. Add the neutralized reaction to it.
11. Spin at 12k rpm for 8 min. 12. Dump the flow-through.
13. Repeat procedure 2 times, refilling the original filter.
14. Elute by turning microcon upside down in clean tube and spinning at 4k for 4 min. 15. Dry the eluate in a speed vac (store samples at -20°C until needed).
Coupling: Cy3 and Cy5 dyes (Amersham, Piscataway, NJ) 16. Resuspend the cDNA pellet in 9 µl of NaBicarbonate buffer, pH 9. 17. Let sit for 10-15 min at room temperature.
19. Mix well by pipetting and incubate in the dark at room temperature for 1h.
Quenching and clean up: Hydroxylamine (Sigma)
20. Add 4.5 µl of 4M hydroxylamine and let sit for 15 min in the dark. 21. Combine Cy3 and Cy5 reactions.
22. Remove unincorporated/quenched dyes with Qia-Quick PCR purification kit (Qiagen).
• Add 70 µl water.
• Add 500 µl buffer PB.
• Apply to Qia-quick column and spin at 13k rpm for 30-60 s.
• Aspirate off flow-through.
• Add 750 µl of buffer PE and spin 30-60 s.
• Aspirate off flow-through and repeat.
• Aspirate flow-through and spin for 1 min at high speed to dry column.
• Transfer to fresh centrifuge tube.
• Add 30 µl buffer EB to the center of filter and let sit 1 min at RT.
• Spin at 13k rpm for 1 min.
• Repeat elution step.
Array hybridization: Hybridizaiton chamber (DieTech, DeRisi Hyb. chamber).
23. Dry down Qia-quick eluate in speed vac (at this point the probe can be stored overnight at 4°C before hybridization). 24. Resuspend in 15 µl of RNAse free water.
25. Add 3 µl of 20X SSC and 1.5 µl poly A (10 mg/ml) to the reaction. 26. Add 0.45 µl of 10% SDS to the mixture.
27. Boil probe for 2 min at 100°C. Let cool for 5-10 min at room temperature. 28. Label slide with etcher and set in hybridization chamber.
29. Put a 10 µl drop of 3X SSC at one end of the hyb chamber and another at the other end of the chamber on top of the slide to prevent the array from drying.
30. Clean a glass coverslip with ethanol and kimwipes.
31. Put the labeled probe directly on the printed array and cover with a coverslip carefully with forceps, avoiding any bubbles. 32. Tightly screw down the hybridization chamber and place in a 67°C water bath (The hybridization temperature needs some
standardization and can be varied from 63-67°C to achieve stringent hybridization). Take caution to keep array completely flat during transfer and hybridization.
33. Allow hybridization to run for at least 5 hours.
Array washing and scanning: Scanner (Scanarray 5000, GSI Lumonics, Watertown, MA) 34. At the end of hybridization time carefully remove the array from water bath.
35. Dry array with paper towels carefully “wicking” the water away from the seams. 36. Unscrew chamber and remove array.
37. Keeping array level, submerge slides in Wash I (0.5XSSC, 0.02% SDS) at 42°C. 38. Tilt array gently to dump off coverslip.
39. Once slip is off the slide, put array in rack and remove any additional hybridizations from the water bath. 40. After all the slides are in the rack plunge rack up and down for 6 min.
41. Individually transfer slides to dish containing Wash II (0.05XSSC) at 42°C, then plunge the rack up and down for 6 min. 42. Dry array by centrifuging at room temperature at 600 rpm for 5min.