DEMOGRAPHIC RESEARCH
VOLUME 34, ARTICLE 20, PAGES 563
−
586
PUBLISHED 23 MARCH 2016
http://www.demographic-research.org/Volumes/Vol34/20/ DOI: 10.4054/DemRes.2016.34.20
Research Article
Diverging patterns of fertility decline in Uruguay
Mathias Nathan
Ignacio Pardo
Wanda Cabella
©2016 Mathias Nathan, Ignacio Pardo & Wanda Cabella.
This open-access work is published under the terms of the Creative Commons Attribution NonCommercial License 2.0 Germany, which permits use, reproduction & distribution in any medium for non-commercial purposes, provided the original author(s) and source are given credit.
1 Introduction 564
2 Background 565
3 Data and measures 568
4 Results 570
4.1 Trends in quantum and tempo of fertility by birth order 570 4.2 Conditional ASFR by birth order in Uruguay 574 4.3 MAB1 and sdMAB1 in Uruguay and selected countries 576
5 Conclusions 579
6 Acknowledgements 581
References 582
Diverging patterns of fertility decline in Uruguay
Mathias Nathan1
Ignacio Pardo2
Wanda Cabella3
Abstract
BACKGROUND
The total fertility rate (TFR) in Uruguay fell from 2.5 to 1.9 children per woman between 1996 and 2011. However, no study to date has examined the decline of the TFR by observing changes in fertility patterns by birth order.
OBJECTIVE
The main aim of this study is to analyze recent changes in fertility level and timing of childbearing by birth order in Uruguay.
METHODS
We estimate unconditional and conditional age- and birth-order-specific fertility rates for 1996–2011 using data from vital statistics, population census, and national population estimates. Additionally, three period summary measures of birth-order-specific fertility quantum are calculated: TFR, PATFR and TFRp*. Timing changes by birth order are examined with MAB and TMAB, focusing on MAB1 and its standard deviation and comparing their evolutions in Uruguay with those of selected countries.
RESULTS
Fertility decline fits a parity-specific stopping model with a moderate increase in the mean ages of first, second, and third births. The distribution of conditional fertility rates for first and second births depicts an asymmetric bimodal shape linked to the increasing heterogeneity of the timing of childbearing. Compared to countries with similar fertility trends, heterogeneity in the age at first birth in Uruguay is remarkably high.
CONCLUSIONS
Previous studies suggest that heterogeneity in first and second birth timing is related to structural social inequalities, as women from lower social strata have not significantly changed the age at which they bear a first child, whereas women of middle to high
1
Universidad de la República del Uruguay. 2
social strata have started to postpone it. The new evidence reinforces the idea that postponement transition in Uruguay cannot be studied without considering this consolidation of social status polarization in fertility timing.
1. Introduction
The purpose of this paper is to analyze the changes in the level and timing of fertility in Uruguay between 1996 and 2011, using period fertility measures by birth order. The analysis of the evolution of fertility trends by birth order can contribute to the understanding of the three main processes in the transition towards a low-fertility setting: the reduction of higher-order births through parity-specific fertility control, the increase in the proportion of women who remain childless throughout their reproductive years, and the postponement of childbearing. Each one of these processes is closely related to the others and together they typically cause the decline of the conventional period total fertility rate (TFR).
With some exceptions (Batyra 2015; Miranda-Ribeiro, Rios-Neto, and Ortega 2008; Rios-Neto and Miranda-Ribeiro 2015), the analysis of the recent decline in the TFR in Latin American countries has relied exclusively on data on births by age of the mother. While several European and North American countries have long series of data on birth counts by both age of the mother and birth order, they are rare to find in Latin America countries with the exceptions of Chile, Costa Rica, and – recently - Uruguay (Lima et al. 2015; Rosero-Bixby, Castro-Martin, and Martín García 2009).
For this study we constructed the 1996−2011 series of births by age of the mother and birth order by using individual birth registers from the Live Birth Certificate and the Perinatal Information System of Uruguay, and estimated age- and birth-order-specific fertility rates and summary measures of timing and quantum of fertility. We analyzed this set of indicators to demonstrate the extent of family limitation, childlessness, and postponement in the evolution of fertility for synthetic cohorts during the recent decline of the period TFR in Uruguay.
Studying fertility by birth order may allow a more rigorous analysis of the demographic components of recent changes in fertility and the construction of new measures will allow the comparison of fertility decline in Uruguay with those of other, mostly European countries.
They found that TFR decreased almost entirely by quantum decline, as the tempo effect only accounted for TFR change through a peak in the 3−4 worst years of the economic crisis that hit the country between 1998 and 2004 and a mild increase in the last years. In this paper we also apply tempo-adjusted period fertility indicators to compare their trends with the developments in the conventional period TFR, examining to what extent the two differed over time and how sizeable the recent impact of the tempo effect on Uruguayan TFR is. Furthermore, the use of the tempo- and parity-adjusted measures of quantum fertility by birth order would allow breaking down changes in tempo-adjusted fertility into their birth order components, possibly providing more accurate evidence on the role of parity-specific fertility declines in the observed changes in period fertility. The structure of the article is as follows. First, it provides some background on fertility decline in Latin America and the Caribbean, and specifically Uruguay. Then, the context of extensive socioeconomic and family change within which it has taken place is discussed. Next, the data and methods used are described and fertility level and timing by birth order are reported, including conditional age-specific fertility rates by birth order and summary measures on both dimensions. Finally, mean age at first birth and its standard deviation in Uruguay is compared with those of other selected countries and some final remarks are made.
2. Background
Latin America and the Caribbean have experienced a rapid decline in fertility level during the last decades. The TFR of the region is currently approaching sub-replacement levels and several countries such as Brazil, Cuba, Chile, Costa Rica, and Uruguay have already reached a TFR below two children per woman (United Nations 2015). Greater availability and accessibility of contraceptive methods, is considered to be the key factor behind the fertility decline (Guzman et al. 2006). However, teenage fertility rates remain relatively high, with an average age-specific fertility rate (ASFR) of 66‰ (ECLAC 2011; Rodríguez 2014). At the same time, the postponement of first births has proven to be an emergent pattern in the region (Esteve et al. 2012). As a result of several trends, the mean age at birth (MAB) remains close to 27 years, at a similar level to that registered in 1990 (Cabella and Pardo 2014). In many countries, lack of proper and extensive data does not allow researchers to dig deeper into these trends.
lower than the average for Latin America and the Caribbean (0.5) (ECLAC 2014). The almost complete lack of indigenous people and the high historical level of urbanization also distinguish the country from the rest of Latin American countries: in 2014 the rural population was around 5% (United Nations 2014).
Its early demographic transition is also atypical of the region. The low level of Uruguayan fertility has been a distinctive feature over the last sixty years (Chackiel 2004; Guzmán et al. 2006). More precisely, Uruguay’s long-term fertility decline shows a pattern displaying traits of both European and Latin American countries, though overall more similar to the former (Figure 1). By the mid-20th century, Uruguayan women had less than three children on average, while the average in Latin American was six. By 1970, fertility had remained stable for a long time (TFR = 2.8–3.0 children per woman); it then decreased to 2.5 in the mid-1980s. No significant changes took place for the next ten years. Between 1996 and 2011 the TFR in Uruguay experienced a remarkable decline, reaching 1.9 children per woman (INE 2014).
Figure 1: Period TFR in Uruguay and selected regions and countries, 1950−2015
Source: United Nations, World Population Prospects: The 2015 Revision.
This marked difference in reproductive behavior is linked to a set of social changes in Uruguayan society. Perhaps the most important is the process of social fragmentation triggered by the crisis of a welfare regime that promoted social integration through the state (Rama 1987). The deterioration of this “hyperintegrated” society, an increasingly segmented labor market, and the growing inability to retain disadvantaged young people in school, has led to differentiated trajectories of youth upon reaching adult life (Cardozo and Iervolino 2009; Ciganda 2008; Filardo 2015; Videgain 2006).
3. Data and measures
Annual series of births by age of mother and birth order between 1996 and 2011 were compiled using microdata provided by the Ministry of Public Health and the National Institute of Statistics of Uruguay. We worked with births records from the Live Birth Certificate System between 1996 and 2007. Due to the increasing proportion of births registered without information on mother’s parity in 2008−2011, we linked the records of all the children born in those years to the Perinatal Information System database.4
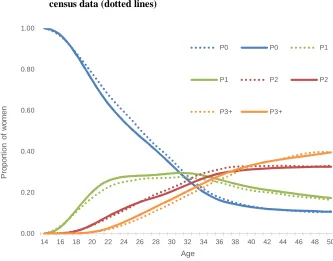
Female population exposures between 1996 and 2011 – denominators for age and birth-order-specific fertility rates – were computed using official mid-year population estimates by age and sex, provided by the National Statistics Institute of Uruguay, 2013 Revision. The relative age and parity distribution of women was first estimated for the starting year (1996) using population census data, and extrapolated for every subsequent year (1997−2011) by using the reconstructed age- and order-specific fertility rates. Our calculations were based on those documented in the Methods Protocol for the Human Fertility Database (Jasilioniene et al. 2012). To check the accuracy of this procedure we compared the proportion of women by age and parity in 2011 as a result of the extrapolation method with data from the 2011 population census.5 As shown in Figure A-1, the extrapolation method provides a relative distribution of women by age and parity that is consistent with data from the 2011 census. The largest differences were observed between the ages of 20 and 25, mostly in proportion to the number of women with parity 0, which should not significantly affect our results.
4A subsequent step to compute birth order information was to retrieve birth history data of the mother for a
given number of cases where the mother had had two or more children between 2003 and 2011 (based on previous or subsequent birth records and information about the number of previous pregnancies). Finally, data was tabulated by year of occurrence for ages 14 to 50+ and birth orders 1 to 4+, and weighted using the under-coverage values published by the National Institute of Statistics (see INE 2014).
5
Unconditional and conditional age- and birth-order-specific fertility rates between 1996 and 2011 were estimated. The conditional fertility rates by age and birth order mi(x,t) were computed from the number of annual births from women of agex and order
iin yeart divided by the number of women of agex and parityi-1 estimated for mid-year t. The following summary indicators were then computed, using period fertility tables, for each order and for all orders combined:
♦ Parity- and age-adjusted total fertility rate (PATFRi), a summary measure that can
be described as the total fertility rate derived from conditional rates that control for changes in the age and parity composition of women.
♦ Table mean age at birth (TMABi), the version of the mean age at birth that relies
on the age distribution of the fertility table number of births.
We compare PATFR and TMAB with conventional summary measures TFR and MAB, also computed for the period. The former are parity-adjusted indicators and therefore provide information of the quantum and tempo of fertility without compositional distortions. However, they do not control for tempo distortions (Bongaarts and Sobotka 2012; Kohler and Ortega 2002).
In fact, both TFR and PATFR, and its components by birth order, are affected by annual changes in the mean age at birth. Thus, we introduce another measure, TFRp*, to describe potential tempo distortions in the results section. TFRp* uses fertility rates of the first kind with births of each order treated as separate non-repeatable events,6 adjusting also for distortions that come from the changing parity distribution of women of reproductive age. It does not include all women agedx, as in the cases of TFR, but women aged x who have a parity j, given j < i (Bongaarts and Sobotka 2012). The PATFR (Parity-Age Total Fertility Rate), an indicator developed by Rallu and Toulemon (1994), as well as the adjusted version, PATFR*, provided by Kohler and Ortega (2002), include denominators where the exposed population for each age x is composed by women of age x and parity i-1. The adjustment variant needs a more complex computation, involving the change in the mean age at birth and also its variance. Bongaarts and Sobotka (2012) demonstrated that this adjusted version performs poorly as compared to TFRp*, in terms of its usefulness as a proxy of the cohort-completed fertility rate (especially for higher orders)7. This is the reason why we choose TFRp* to measure period fertility controlling for both tempo and parity effects.
6
“Any recurrent event may be resolved into a series of non-recurrent events, which can be analyzed separately” Bongaarts and Feeney (2006: 2).
7
At the same time, Bongaarts and Feeney (2006) proved that TMAB1 and MAB1 can show different levels, as tempo distortions produce an upward bias in the TMAB1 (derived from conditional fertility rates) when the MAB1 of a specific birth order is increasing. We analyze if this is the case for Uruguayan TMAB1 and MAB1, and subsequent birth orders. For comparative purposes, the conventional mean age at first birth (MAB1) was used. It is available for several countries and across a long span of years in the Human Fertility Database/Collection. The standard deviation in the mean age at first birth (sdMAB1) was also used, in this case to examine the level of fertility dispersion by age in Uruguay and other countries.
4. Results
4.1 Trends in quantum and tempo of fertility by birth order
Figure 2 presents the evolution of the three summary measures of period fertility quantum, TFR, PATFR, and TFRp*, between 1996 and 2011. TFR and PATFR show a very similar evolution: total fertility decreased from 2.5 to 1.9 children per woman. TRFp* departs from TFR and PATFR in several years, showing that tempo effects played a role during certain periods in the decline of the TFR in Uruguay8. Between 2002 and 2004, both TFR and PATFR may be deflated due to a short period of postponement of fertility, likely to have been fueled by the extensive economic crisis suffered by the country in those years. Mild tempo effects are also displayed from 2007 to 2010, where TFRp* values remained above TFR and PATFR. In the absence of composition and tempo effects the decline of the total fertility in Uruguay would have been less intense, reaching an average of 2.0 children per woman in 2010 instead of the 1.9 observed with the TFR.
8
Figure 2: TFR, PATFR, and TFRp*, Uruguay 1996−2011
Source: Authors’ calculations based on Live-Birth Certificate and Perinatal Information System (Ministry of Public Health-Office of National Statistics of Uruguay), age-parity weights from 1996 national census and mid-year population estimates (Office of National Statistics of Uruguay 2013 revision).
As shown in Figure 3, TFR and PATFR exhibit different trends in birth-order-specific fertility, in spite of showing similar levels when all birth orders are considered combined. For instance, the average number of births per woman in PATFR1 and PATFR2 is higher than in TFR1 and TFR2 in the period considered, but PATFR4+ is lower than TFR4+. Both composition and tempo effects account for lower values of TFR1 and TFR2, as seen with the evolution of TFRp* for 1st and 2nd birth orders. There is little difference between the evolution of PATFR and TFRp* for first births, and both present almost no changes in their levels. Similar trends are also displayed by PATFR2 and TFRp*2, although the latter presents two bulges, in 2002 and 2003, and 2008−2010. Likewise, TFRp*3 and TFRp*4+ show specific peaks in those years, especially in 2004.
0.00 0.50 1.00 1.50 2.00 2.50 3.00
1996 1997 1998 1999 2000 2001 2002 2003 2004 2005 2006 2007 2008 2009 2010 2011
C
h
il
d
re
n
p
e
r
w
o
m
a
n
Year
Figure 3: TFR, PATFR, and TFRp* by birth order, Uruguay 1996−2011
Source: Authors’ calculations based on Live-Birth Certificate and Perinatal Information System (Ministry of Public Health-Office of National Statistics of Uruguay), age-parity weights from 1996 national census and mid-year population estimates (Office of National Statistics of Uruguay 2013 revision).
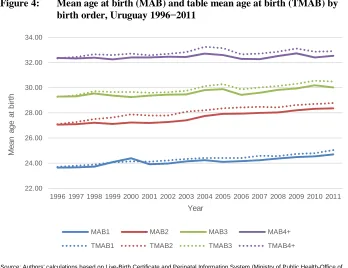
Figure 4 shows that women in Uruguay are delaying childbearing. MAB increased in birth orders 1 to 3, especially in the last years. These changes, however, occurred at a slow pace, particularly for first births. Between 1996 and 2011, MAB1 increased just one year (23.7 to 24.7) and remained lower than that observed in countries with low fertility (see Figure 6 ).
Bongaarts and Feeney (2006) pointed out that TMAB1 values tend to be higher than MAB1 when MAB1 is increasing due to tempo distortions. Our results show that this inflating effect can also be observed - and tends to be more intense - in subsequent birth orders.
0.00 0.20 0.40 0.60 0.80 1.00 1.20
1996 1997 1998 1999 2000 2001 2002 2003 2004 2005 2006 2007 2008 2009 2010 2011
C
h
il
d
re
n
p
e
r
w
o
m
a
n
Year
TFR1 TFR2 TFR3 TFR4+
PATFR1 PATFR2 PATFR3 PATFR4+
Figure 4: Mean age at birth (MAB) and table mean age at birth (TMAB) by birth order, Uruguay 1996−2011
Source: Authors’ calculations based on Live-Birth Certificate and Perinatal Information System (Ministry of Public Health-Office of National Statistics of Uruguay), age-parity weights from 1996 national census and mid-year population estimates (Office of National Statistics of Uruguay 2013 revision).
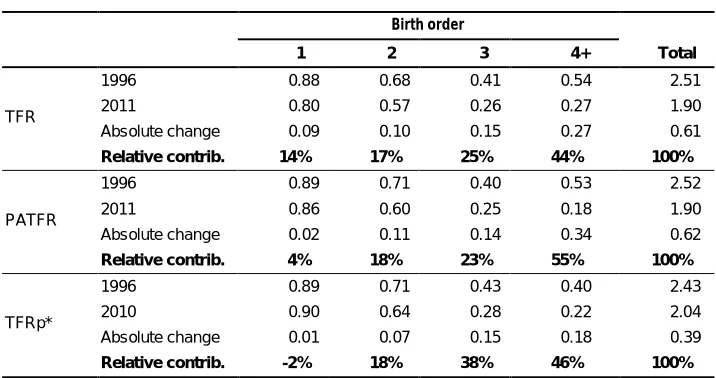
All things considered, it is clear that fertility decline in Uruguay between 1996 and 2011 was largely driven by the lower fertility rates of order 3 and 4+ (Table 1). In fact, the decrease in fertility of those birth orders accounts for as much as 70% (TFR) or 80% (PATFR and TFRp*) of the total fertility decrease. The contribution of birth order 2 was smaller, close to 18%. As shown in Table 1, when controlled by parity composition and tempo effects, fertility decline in first births is negligible. In other words, fertility decline was linked to a parity-specific stopping model with a moderate ‘deflating’ effect as a result of changes in the composition of female exposure and age at first and second births.
22.00 24.00 26.00 28.00 30.00 32.00 34.00
1996 1997 1998 1999 2000 2001 2002 2003 2004 2005 2006 2007 2008 2009 2010 2011
M
e
a
n
a
g
e
a
t
b
ir
th
Year
MAB1 MAB2 MAB3 MAB4+
Table 1: TFR, PATFR, and TFRp* by birth order, absolute change, and relative contribution to total fertility decline,
Uruguay 1996 and 2011
Birth order
Total
1 2 3 4+
TFR
1996 0.88 0.68 0.41 0.54 2.51
2011 0.80 0.57 0.26 0.27 1.90
Absolute change ‒0.09 ‒0.10 ‒0.15 ‒0.27 ‒0.61
Relative contrib. 14% 17% 25% 44% 100%
PATFR
1996 0.89 0.71 0.40 0.53 2.52
2011 0.86 0.60 0.25 0.18 1.90
Absolute change ‒0.02 ‒0.11 ‒0.14 ‒0.34 ‒0.62
Relative contrib. 4% 18% 23% 55% 100%
TFRp*
1996 0.89 0.71 0.43 0.40 2.43
2010 0.90 0.64 0.28 0.22 2.04
Absolute change 0.01 ‒0.07 ‒0.15 ‒0.18 ‒0.39
Relative contrib. -2% 18% 38% 46% 100%
Source: Authors’ calculations based on Live-Birth Certificate and Perinatal Information System (Ministry of Public Health-Office of National Statistics of Uruguay), age-parity weights from 1996 national census and mid-year population estimates (Office of National Statistics of Uruguay 2013 revision).
4.2 Conditional ASFR by birth order in Uruguay
Conditional age-specific fertility rates provide a more complete account of the evolution of fertility. Firstly, if we consider all birth orders combined, these rates show that fertility levels have decreased in all years and for almost all reproductive ages (Figure 2a). Nevertheless, the shape of the age schedule remains almost unchanged, with a plateau that extends from ages 22 to 34. This unusual picture becomes more accentuated over time. In a context of fertility decline of orders 3 and 4+, we would not expect this extended plateau to be an expression of uniform fertility rates across the entire age range. Instead, it may show an aggregate effect of different trends by birth order and age, which balance each other out. Therefore we plotted conditional ASFR by birth order to get a more complete impression of order-specific trends.
5c), which disappears when plotting ASFR for third births (Figure 5d). This increasing heterogeneity of reproductive behavior is driven by two different trends: firstly, the persistence of high teenage fertility rates, and secondly, a growing number of women delaying their entry into motherhood.
Results for conditional age-specific fertility rates for first births (m1(x)) are consistent with previous research in Uruguay from a cohort approach that showed the social status polarization in the age at first childbirth (Nathan 2015 and 2013; Videgain 2006).
Figure 5a−5d: Age-specific fertility rates (all birth orders combined) and conditional age-specific fertility rates for first, second, and third birth orders (three-age moving average),
Uruguay 1996, 2001, 2006, and 2011
All birth orders combined Birth order 1
Birth order 2 Birth order 3
Source: Authors’ calculations based on Live-Birth Certificate and Perinatal Information System (Ministry of Public Health-Office of National Statistics of Uruguay), age-parity weights from 1996 national census, and mid-year population estimates (Office of National Statistics of Uruguay 2013 revision).
0.000 0.020 0.040 0.060 0.080 0.100 0.120 0.140 0.160 0.180
15 17 19 21 23 25 27 29 31 33 35 37 39 41 43 45 47 49
f( x ) Age 0.000 0.020 0.040 0.060 0.080 0.100 0.120 0.140 0.160 0.180
15 17 19 21 23 25 27 29 31 33 35 37 39 41 43 45 47 49
m (x ) Age 0.000 0.020 0.040 0.060 0.080 0.100 0.120 0.140 0.160 0.180
1517 1921 23 2527 2931 33 3537 3941 4345 47 49
m (x ) Age 1996 2001 2006 2011 0.000 0.020 0.040 0.060 0.080 0.100 0.120 0.140 0.160 0.180
15 17 19 21 23 25 27 29 31 33 35 37 39 41 43 45 47 49
4.3 MAB1 and sdMAB1 in Uruguay and selected countries
Looking for patterns in the shape of the ASFR distribution is certainly helpful to achieve a thorough description of fertility trends, but it is also necessary to use standardized measures to depict the extent to which the Uruguayan fertility schedule differs from that of other countries. In order to do so, we compared the MAB1 and its standard deviation for Uruguay with those of selected countries of Latin America and the Caribbean, Europe, and North America (Chile, Denmark, Hungary, Italy, Portugal, Serbia, Spain, Sweden, and USA). Besides using the MAB1 to compare the extent of the postponement of first births, we use its standard deviation to analyze dispersion, which could be important, considering the bimodal pattern commented on in the previous section.
The lowest MAB1 available in each country was selected to depict the evolution over the following 15 years, the same time-span considered in the analysis of the Uruguayan data (1996−2011). Table 2 shows the year of the initial data point in each country. In general, the selected countries also show a similar TFR at the beginning of the period (not shown).9 Nowadays, those countries tend to have much higher MAB1 values. For instance, the OECD average is currently 28 years10.
The lowest value of the MAB1 in the years of available data for each country extends from ages 22.2 (USA in 1963) to 24.8 (Spain in 1979). Uruguay has an intermediary value of 23.7 years (1996) (Table 2). More recent initial values tend to be higher, especially in European countries, where the delay in first births began sooner than other regions. The increase in the MAB1 of Uruguay is comparatively low, both in terms of absolute increase and proportional change (Table 3 and Figure 6).
9
Every country shows a TFR between 1.8 and 2.5, except for the USA, which has higher values. 10
Table 2: Year of lowest MAB1 in available period (Uruguay and selected countries)
Country MAB1 Year
USA 22.24 1963
Hungary 22.41 1976
Serbia 22.54 1971
Chile 23.22 1995
Denmark 23.48 1968
Uruguay 23.66 1996
Portugal 23.90 1983
Sweden 24.22 1974
Italy 24.65 1975
Spain 24.81 1979
Source: Authors’ calculations based on data from the Human Fertility Database/Collection.
Table 3: Change in MAB1 in the fifteen years following the lowest available value (%) (Uruguay and selected countries)
Country % change
Spain 13.30
Portugal 9.37
Italy 9.21
Sweden 8.63
Denmark 7.58
Serbia 4.61
USA 4.59
Chile 4.57
Uruguay 4.40
Hungary 3.48
Figure 6: MAB1 in Uruguay and selected countries (fifteen-year period following the lowest available MAB1 value)
Source: Authors’ calculations based on data from the Human Fertility Database and the Human Fertility Collection.
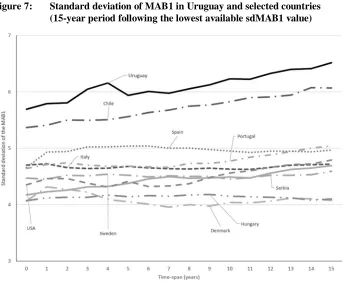
Figure 7: Standard deviation of MAB1 in Uruguay and selected countries (15-year period following the lowest available sdMAB1 value)
Source: Authors’ calculations based on data from the Human Fertility Database and the Human Fertility Collection.
5. Conclusions
The aim of this study was to analyze the changes in the level and timing of fertility in Uruguay between 1996 and 2011 using mostly summary measures by birth order and conditional ASFR. We presented new evidence for a better description of the patterns of fertility decline in Uruguay, looking for trends in childlessness, family limitation, and postponement of childbearing from a period approach. To the best of our knowledge, this is the first paper to analyze the trends in fertility by birth order for a Latin American country using vital statistics.
of the total fertility was almost nil. Among the possible drivers of fertility decline, parity-specific fertility control seems to have been the most important.
An increase in the period mean age at first and second births was also shown, which might reflect the onset of fertility postponement in Uruguay. Although Uruguay seems to be at the forefront of the group of countries that have already started the postponement phase of the Second Demographic Transition (Esteve et al. 2012), the pace of childbearing postponement in 1996-2011 has been relatively slow if compared to the annual change of mean age at first birth for European countries during the “postponement transition” (Kohler, Billari, and Ortega 2002; Goldstein, Sobotka, and Jasilioniene 2009). However, the increase of the mean age at birth for lower birth orders was sufficient to produce the deflation of the conventional TFR for specific years between 1996 and 2011.
One of the main findings of this study is that conditional age-specific first-birth fertility rates exhibit an asymmetric bimodal distribution with peaks around ages 20 and 30, which can be observed to a lesser extent in second-order births. The emergence and consolidation of this pattern accompanies an increasing heterogeneity in the timing of childbearing, which is larger than that of other countries selected for comparison (USA, some European countries, Chile), as can be observed when using the standard deviation in the mean age at first birth.
In fact, high and increasing heterogeneity in reproductive behavior in the context of decreasing fertility levels might be a distinctive feature of Uruguay. All the evidence suggests that women from lower social strata have not significantly changed their behavior regarding their age at first childbirth, while women of middle to high social strata have experienced some postponement (Videgain 2006; Nathan 2015, 2013; Fernández Soto, Fostik, and Varela 2012; Varela, Fostik, and Pollero 2008; Cabella 2009). The coexistence of both patterns produces a moderate increase in the MAB1 and the accentuation of the bimodal curves of fertility rates by age at first birth.
A plausible scenario for the years to come is that while Uruguay consolidates its low fertility regime and eventually goes through the postponement transition, the entire population will converge into a more homogenous quantum behavior (with TFR levels below two children per woman11) but remain divergent in fertility timing based on social strata. In other words, the gap in reproductive behavior resulting from the differential educational and working opportunities mentioned above will be focused on timing and not quantum.
Although the lack of information on other Latin American countries does not allow us to infer the existence of a regional pattern, the similarity in the trajectories of Chile and Uruguay in recent years (Lima et al. 2015) stands out from the rest of the countries considered. The increase in the heterogeneity of timing of first births and its relation to social inequality patterns are both going to form part of the regional research agenda in the forthcoming years.
6. Acknowledgements
This paper was produced with funding from the Comisión Sectorial de Investigación Científica (CSIC, Universidad de la República, Uruguay) under the research project “El descenso de la fecundidad en Uruguay (1996−2011): ¿cuál es su verdadera dimensión?”. We would like to thank the Ministry of Public Health and the National Institute of Statistics of Uruguay for allowing us to access the data and for their technical support. We are also very thankful to the anonymous reviewers of an earlier version of this paper for their valuable recommendations and to Kristof Zeman for his useful comments about our computations of female population exposures.
Corrections
The previous version included wrong TFRp* values introduced by an incorrect formula of r (that accounts for the inter-annual variation of MAB) in the STATA code. Instead of r(t)=[MAB(t+1)-MAB(t-1)]/2, we had left this formula as [MAB(t+1)-MAB(t)]/2.
Small differences arise in our results with corrected TFRp* and they do not affect the core of our analysis. However, Figures 2 and 3, and Table 1, were TFRp* results are shown, had to be adjusted with new calculations. Some TFRp* values mentioned in the text on pages 570, 571, and 573 also needed to be revised.
11
References
Batyra, E. (2015). Fertility and changing pattern of childbearing timing in Colombia. Paper presented at the Population Association of America, 2015 Annual Meeting, San Diego, CA.
Bongaarts, J. and Feeney, G. (2006). The Quantum and Tempo of Life-Cycle Events. Vienna Yearbook of Population Research 4: 115−151.
Bongaarts, J. and Sobotka, T. (2012). A Demographic Explanation for the Recent Rise in European Fertility. Population and Development Review 38(1): 83−120.
doi:10.1111/j.1728-4457.2012.00473.x.
Cabella, W. (2009). Dos décadas de transformaciones de la nupcialidad uruguaya. La convergencia hacia la segunda transición demográfica.Estudios Demográficos y Urbanos 24(2): 389−427.
Cabella, W. and Pardo, I. (2014). Hacia un régimen de baja fecundidad en América Latina y el Caribe, 1990−2015. In: Cavenaghi, S. and Cabella, W. (eds.). Comportamiento reproductivo y fecundidad en América Latina: una agenda inconclusa. Rio de Janeiro: ALAP: 13−31.
Cardozo, S. and Iervolino, A. (2009). Adiós juventud: tendencias en las transiciones a la vida adulta en Uruguay.Revista de Ciencias Sociales 22(25): 60−81.
Castro, R. and Zeman, K. (2014). Human Fertility Database documentation: Chile [electronic resource]. www.humanfertility.org.
Chackiel, J. (2004). La transición de la fecundidad en América Latina 1950−2000. Papeles de Población 10(41): 9−58.
Ciganda, D. (2008). Jóvenes en transición hacia la vida adulta: el orden de los factores ¿no altera el resultado? In: Varela, C. (ed.). Demografía de una sociedad en transición: la población uruguaya a inicios del siglo XX. Montevideo: Trilce. ECLAC (Economic Commission for Latin America and the Caribbean) (2011). Social
Panorama of Latin America 2011. Santiago: United Nations.
ECLAC (Economic Commission for Latin America and the Caribbean) (2014). Social Panorama of Latin America 2014. Santiago: United Nations.
Fernández Soto, M., Fostik, A., and Varela, C. (2012). Convergencia y divergencia en el pasaje a la vida adulta: la transición a la maternidad. Paper presented at the V Congreso de la Asociación Latinoamericana de Población, Montevideo, Uruguay.
Filardo, V. (2015). Cambios y permanencias en las transiciones a la vida adulta de los jóvenes en Uruguay (2008−2013). Cuadernos Temáticos de la ENAJ nº1, MIDES-INJU-FCS Udelar.
Fostik, A.L. (2014). La naissance du premier enfant et la transition à la vie adulte en Uruguay [Ph.D. Thèse, Doctorat en démographie]. Université du Québec. Goldstein, J.R., Sobotka, T., and Jasilioniene, A. (2009). The end of ‘lowest-low’
fertility? Population and Development Review 35(4): 663−699. doi:10.1111/
j.1728-4457.2009.00304.x.
Guzmán, J.M., Rodríguez, J., Martínez, J., Contreras, J.M., and González, D. (2006). The Demography of Latin America and the Caribbean since 1950.Population-E 61(5-6): 519−576.doi:10.3917/pope.605.0519.
INE (National Statistics Institute of Uruguay) (2014). Estimaciones y proyecciones de la población de Uruguay: metodología y resultados, Revisión 2013. Montevideo: Instituto Nacional de Estadística.
Jasilioniene, A., Jdanov, D., Sobotka, T., Andreev, E.M., Zeman, K., and Shkolnikov, V.M. (2012). Methods Protocol for the Human Fertility Database. 10.08.2012 version [electronic resource]. www.humanfertility.org.
Kohler, H.P. and Ortega, J.A. (2002). Measuring Low Fertility: Rethinking Demographic Methods. MPIDR Working Paper, WP 2002-001. Max Planck Institute for Demographic Research.
Kohler, H.P., Billari, F.C., and Ortega, J.A. (2002). The emergence of lowest-low fertility in Europe during the 1990s. Population Development Review 28(4):
641−680.doi:10.1111/j.1728-4457.2002.00641.x.
Miranda-Ribeiro, A., Rios-Neto, E., and Ortega, J.A. (2008). Declínio da fecundidade no Brasil e México e o nível de reposição: efeitos tempo, parturição e quantum. In: Wong, L. (ed.).Población y Salud Sexual y Reproductiva en América Latina. Rio de Janeiro: ALAP: 81−100.
Nathan, M. (2015). La creciente heterogeneidad en la edad al primer hijo en Uruguay: un análisis de las cohortes 1951−1990.Notas de Población 100: 35−60.
Nathan, M. (2013). Inicio de la fecundidad en mujeres de Montevideo y área metropolitana. ¿Postergación? ¿Polarización?.RELAP 7(12): 33−58.
Pardo, I. and Cabella, W. (2014). El descenso de la fecundidad en Uruguay (1996−2011) y el efecto tempo en las medidas sintéticas.Paper presented at the VI Congreso de la Asociación Latinoamericana de Población, Lima, Peru. Peri, A. and Pardo, I. (2008). Nueva evidencia sobre la Hipótesis de la Doble
Insatisfacción: ¿Cuán lejos estamos de que toda la fecundidad sea deseada?Serie Divulgación. Montevideo: UNFPA.
Rallu, L. and Toulemon, T. (1994). Period fertility measures. The construction of different indices and their application to France, 1946−89. Population, An English Selection 6: 59−94.
Rama, G. (1987). La democracia en Uruguay. Una perspectiva de interpretación. Buenos Aires: Grupo Editor Latinoamericano.
Rios-Neto, E. and Miranda-Ribeiro, A. (2015) Fertility Decline in Brazil: Tempo, Quantum and Parity Composition Effects. Paper presented at the Population Association of America, 2015 Annual Meeting, San Diego, CA.
Rodriguez, J. and Cavenaghi, S. (2013). Adolescent and youth fertility and social inequality in Latin America and the Caribbean: what role has education played? Paper presented at the XXVII IUSSP International Population Conference, 2013, Busan.
Rodriguez, J. (2014). Fecundidad adolescente en América Latina: una actualización. In: Cavenaghi, S. and Cabella, W. (eds.). Comportamiento reproductivo y fecundidad en América Latina: una agenda inconclusa. Rio de Janeiro: ALAP: 33−65.
Sullivan, R. (2005). The age pattern of first-birth rates among U.S. women: the bimodal 1990s.Demography 42(2): 259−273.doi:10.1353/dem.2005.0018.
United Nations (2014).World Urbanization Prospects. The 2014 Revision. New York: United Nations.
United Nations (2015). World Population Prospects. The 2015 Revision. New York: United Nations.
Varela, C, Fostik, A., and Pollero, R. (2008). La fecundidad: evolución y diferenciales en el comportamiento reproductivo. In: Varela, C. (ed.). Demografía de una sociedad en transición: la población uruguaya a inicios del siglo XX. Montevideo: Trilce.
Varela, C., Lara, C., Nathan, M., Pardo, I., and Tenenbaum, M. (2014). La fecundidad en el Uruguay (1996−2011). Desigualdad social y diferencias en el comportamiento reproductivo. Atlas Sociodemográfico y de la Desigualdad del Uruguay. Montevideo: Trilce.
Appendix
Figure A-1: Proportion of women by age and parity on Jan 1st, 2011, computed by two methods: extrapolation using 1996 census data with age- and parity-specific fertility rates for 1996–2010 (solid lines) versus 2011 census data (dotted lines)
Source: authors’ calculation based on Live-Birth Certificate, Perinatal Information System, 1996 and 2011 census, and official female population estimates by age.
0.00 0.20 0.40 0.60 0.80 1.00
14 16 18 20 22 24 26 28 30 32 34 36 38 40 42 44 46 48 50
P
ro
p
o
rt
io
n
o
f
w
o
m
e
n
Age
P0 P0 P1
P1 P2 P2