DEMOGRAPHIC RESEARCH
VOLUME 35, ARTICLE 21, PAGES 581
−
616
PUBLISHED 1 SEPTEMBER 2016
http://www.demographic-research.org/Volumes/Vol35/21/ DOI: 10.4054/DemRes.2016.35.21
Research Article
Are daughters’ childbearing intentions related to
their mothers’ socio-economic status?
Maria Rita Testa
Valeria Bordone
Beata Osiewalska
Vegard Skirbekk
©2016 Testa, Bordone, Osiewalska & Skirbekk.
This open-access work is published under the terms of the Creative Commons Attribution NonCommercial License 2.0 Germany, which permits use, reproduction & distribution in any medium for non-commercial purposes, provided the original author(s) and source are given credit.
1 Introduction 582
2 Background 583
2.1 Human capital and fertility intentions 585
2.2 A cross-country comparison 587
3 Data and method 589
3.1 Sample 589
3.2 Measures of fertility intention and explanatory variables 590
3.3 Zero-inflated Poisson model 594
4 Results 596
4.1 Descriptive analysis 596
4.2 Regression analysis 598
5 Discussion 606
6 Acknowledgements 608
Are daughters’ childbearing intentions related to
their mothers’ socio-economic status?
Maria Rita Testa1
Valeria Bordone2
Beata Osiewalska3
Vegard Skirbekk4
Abstract
BACKGROUND
Unlike actual fertility, fertility intentions are often found to be positively correlated with education. The literature explaining this paradox is scarce.
OBJECTIVE
We aim to fill the gap in the existing scientific literature by searching for the main factors that influence highly educated women to plan a larger family size.
METHODS
Using the first wave of the Generations and Gender Survey for four countries (Austria, Bulgaria, Italy, and Norway), we analyse the relationship between mother’s economic status and daughter’s fertility intentions, controlling for daughter’s socio-economic status and sibship size. Zero-inflated Poisson regression models are employed to estimate the predictors of women’s additionally intended number of children.
RESULTS
We find that the effect of family of origin is exerted mainly through sibship size among childless daughters: Daughters with more siblings intend to have more children. After the transition to parenthood, the effect of family of origin is exerted mainly through the
1 Wittgenstein Centre (IIASA, VID/ÖAW, WU), Vienna Institute of Demography/Austrian Academy of Sciences and Vienna University of Economics and Business, Austria. E-Mail: [email protected]. 2 Centre for Research on Ageing and ESRC Centre for Population Change, University of Southampton, United Kingdom. E-Mail: [email protected].
3 Cracow University of Economics, Department of Demography, Poland. E-Mail: [email protected].
mother’s level of education: Daughters with highly educated mothers intend to have more children.
CONCLUSIONS
The empirical results suggest that the positive link between births intentions and level of education might not merely be an artefact generated by the design of cross-sectional surveys but the outcome of a better socio-economic status that allows forming positive reproductive plans.
CONTRIBUTION
The positive role of mother’s socio-economic status on daughter’s fertility decision-making offers a valuable interpretation of the positive link between education and fertility intentions which goes beyond the alternative explanations referring to self-selection, partner effect, or time squeeze, and needs to be confirmed by further research.
1. Introduction
Fertility intentions are the most proximate determinants of actual fertility (e.g., Barber 2001; Bongaarts 1992) and inform us about directional trends (Hin et al. 2011; Testa 2014). They are transmitted across generations from parents to children (Fernandez and Fogli 2006). However, the literature on intergenerational transmission of fertility has viewed the effect of the family of origin mainly in terms of sib-ship size; that is, women with more siblings are likely to have more children (e.g., Murphy and Knudsen 2002).
levels, female labour market participation rates, welfare state models, and gender role systems. The importance of taking a comparative approach in studying intergenera-tional transmission of fertility has been widely acknowledged in the literature (Billari, Philipov, and Testa 2009; Liefbroer and Billari 2010; Keim, Klärner, and Bernardi 2009), yet existing research does not always account for cross-cultural and cross-national variation. The novelty of this analysis lies in a new dimension of inter-generational transmission, i.e., the work–fertility joint behaviour of mothers with adolescent daughters, which is considered in combination with the mother/daughter transmission of education, and in a cross-country comparative approach accounting for different cultural and institutional settings. Continuity between parents and children in fertility-related outcomes has consequences in terms of both population size and structure. Hence, more knowledge about the intergenerational transmission of fertility is particularly valuable.
The paper is structured as follows: after a review of the relevant literature on fertility intentions and intergenerational transmission of fertility-related behaviour, the similarities and differences of four European countries are examined in terms of both institutional context and labour market. Next, data and methodology are presented and, finally, results are described and critically discussed in the concluding section.
2. Background
This study lies at the intersection of those asserting a strong link between intentions and behaviours, as in the theory of ‘planned behaviour’ (Ajzen 1991), and those arguing that parental behaviour and the parent-child relationship during childhood and adolescence significantly influence both the intentions and the behaviours of children in adulthood, as in the ‘linked lives’ theoretical framework (Elder 1977; 1994).
more relevant at the beginning of the reproductive career while perceived control plays a stronger role after the birth of the first child (e.g., Billari, Philipov, and Testa 2009; Mills et al. 2008; Testa and Grilli 2006).
A crucial issue is whether and to what extent women are able to predict constraints when formulating their intentions. Elder’s concept of “linked lives” (Elder 1977; 1994) points to the fact that family members’ lives are interdependent. Individual actors affect each other through their behaviour and children are often presumed to take after their parents. Hence, intentions may arise from the family-of-origin domain, and in particular we argue that observing and learning from the mother’s experience may contribute to forming the fertility intentions of adult daughters.
A wide array of studies has shown that mothers serve as significant others from whom daughters learn. Mothers are one of the main providers of immediate care, advice, and social support on reproductive issues for young women (Chan and Elder 2000; Dubas 2001; Pollet, Nelissen, and Nettle 2009). Yet, to our knowledge, so far no study has focused on mothers’ socio-economic characteristics as predictors of daughters’ fertility intentions - a topic we are going to address below.
on intergenerational transmission of fertility, it is expected that a mother’s number of children is positively associated with her daughter’s intended family size (H1).
It is also worth noting that several studies have documented a positive relation between mother’s and daughter’s education in different countries and periods (Kye 2011; Mare and Maralani 2006; Matras 1961).
2.1 Human capital and fertility intentions
Becker’s new home economics (e.g., Becker 1981) derived a negative effect of female education on fertility from the positive association between education and labour force participation, because it considered opportunity costs to be more important among the highly educated. However, the effect of a woman’s education on her own fertility intentions is complex and does not necessarily reflect the association between actual fertility and education, insofar as highly educated women are not able to anticipate the negative effect of postponement on their reproductive careers. Moreover, over three decades ago Folbre (1983) argued that fertility theory should take into account power relations within the household. Since then several studies have indicated women’s human capital (commonly measured by their educational attainment) as a proxy for the bargaining power of the woman within the household (e.g., Mills et al. 2008). Higher levels of education allow women to question traditional roles (McDonald 2006) and are often associated with a more equal gender division of household chores (e.g., Mencarini and Tanturri 2004).
Fertility intentions are recognised as an important channel through which educa-tion affects fertility. Yet several studies have found that, unlike in developing countries, European women who invest more in education do not necessarily intend to have a smaller family size than their less-educated counterparts (e.g., Testa 2014; see also Esping-Andersen 2009; Kravdal and Rindfuss 2008). Indeed, because of their ability to break traditional roles, to achieve more gender equality in the division of household labour, and to attain higher economic assets, highly educated women may have better opportunities to balance work and family (Gauthier 2007), and therefore they may even tend to plan more children than women with low education. Following this line of research, we anticipate that daughter’s level of education is positively associated with daughter’s number of intended children (H2).
(e.g., Bongaarts and Watkins 1996; Montgomery and Casterline 1996; Kohler, Behrman, and Watkins 2001). Indirect evidence for this can be found in previous results showing an effect of significant others’ education on contraceptive use among women in developing countries (e.g., Moursund and Kravdal 2003). An early study by Hirsch, Seltzer, and Zelnik (1981) showed a positive relationship between the educational attainment of the parents or childraisers and the desired family size of teenage women in the USA. A mother’s high socio-economic status normally implies that she enjoys healthier and wealthier conditions, which in turn translate into stronger potential support for her daughter(s) in terms of monetary transfers, emotional support, and provision of help: circumstances that may favour daughters’ reproductive plans (Tanskanen and Rotkirch 2014). Thus, we expect that mother’s level of education is positively associated with daughter’s number of intended children (H3).
2.2 A cross-country comparison
Four European countries are considered: Norway from Scandinavia, Austria from Central Europe, Italy from the Mediterranean, and Bulgaria from Eastern Europe. These countries differ in terms of economic opportunity, employment level, welfare system, and family policy, which could all have implications for cross-national differences in fertility levels, and thus are good subjects for comparative study. We were unable to enlarge this comparative setting to other countries whose data are available in the Generation and Gender Program, either because the question on mother’s occupational status was not collected in a reliable way in the survey questionnaire or because the other key variables of our analysis contained an unacceptable amount of missing values. Table 1 reports female employment rates for all four countries between 1960 and 2010. Two aspects are worth noticing: first, the large increase in the proportion of employed women in each country over the whole period, and second, the persistent cross-country difference in the level of female employment, which is still remarkable in the year 2010. Since 1980 the Italian female employment rate has been almost half that in Norway. The 2010 data show that about 73% of Norwegian women between 15 and 64 are working, while in Italy this percentage is only 46%, one of the lowest in Europe (Del Boca and Vuri 2007). Austria and Bulgaria occupy an in-between position, with about 66% and 56% of women aged 15–64 employed, respectively.
Table 1: Female employment rates (age 15–64), 1960‒2010
1960d 1980 d 2000 d 2010e
Austria 55.2 a, f 52.4 59.3 65.7
Bulgaria 33.5 b, g 66.5 c 46.3 b 56.4
Italy 28.1 33.2 39.7 46.1 Norway 26.1 58.4 73.4 73.3
Note: a) labour force of all ages divided by the population 15-64 years old; b) all ages; c) data from 1990.
Source: d) Pisarrides et al. 2005; e) data downloaded from Eurostat (http://appsso.eurostat.ec.europa.eu/nui/submitView TableAction.do) on 25 July 2016; f) Lupri 1983; g) Kaser 2008.
A similar pattern of difference can be observed in recent fertility levels, which are highest in Norway (where the total fertility rate (TFR) is equal to 1.85) and lowest in Italy (TFR= 1.43), with an intermediate position for Bulgaria (TFR = 1.5). The Austrian fertility level is close to that of Italy (1.44) (Scherbov et al. 2014).
service sector, low percentages of women working part-time, and high unemployment rates (D’Addio and Mira d’Ercole 2005). Moreover, gender equity in the family and in public provision for the family remains limited, as in other Mediterranean countries (Del Boca and Rosina 2009; McDonald 2000; Mencarini and Tanturri 2004; Mills et al. 2008). The Italian context, based on a ‘familistic’ welfare system and relying on the central role of woman as principal caregivers (Esping-Andersen 1999), is characterised by a rigidity in the labour market that simultaneously increases the costs of having children and discourages the labour market participation of married women (Del Boca 2002). By contrast, Norway is characterised by a generous family policy and a large service sector. The supportive Scandinavian welfare system, based on individual independence and collective social solidarity, pioneered the transformation of parenthood into a political issue, incentivising women’s continuous employment and enabling parents (men as well as women) to combine parenthood with paid work (Lappegård 2010). As in the other Scandinavian countries, Norway’s generous and egalitarian parental leave policies, large supply of part-time jobs with extensive social benefits, subsidised day care facilities, flexible working hours, and economic support for families with children contribute to both female employment and childbearing. Norway, however, has a more ‘ dualistic’ family policy than other countries and ranks high on policies that give both dual-earner support and more general family support (Ellingsæter and Leira 2006).
In Austria, tax and benefit policies have long discouraged married women’s participation in the labour market (Morgan 2006). Until at least the 1980s, The Social Democratic Party of Austria leaned toward the male-breadwinner model and did not produce policies encouraging mothers’ employment. More recent flexible working-time arrangements have allowed women to combine work and family life, with part-time work being the main option. In the 2001 European Labour Force Survey more than 40% of Austrian women working part-time reported the ability to look after children or elderly family members as a reason for preferring this work arrangement.
In Bulgaria, as in Italy, women have a central role in the family, but as opposed to Italy and similar to Norway, the dual-breadwinner model is far more present (Naldini 2003). The female employment rate in Bulgaria has been very high compared to other European countries, with a peak in the mid-1980s, but has declined in subsequent decades because of increasing unemployment, especially for the youngest and most-educated (Genov and Krasteva 2001).
The idea is that in such contexts daughters do not learn the skills required for combining work and family life through the example of (their or others’) mothers.
3. Data and method
3.1 SampleWe used data from the GGS, carried out from 2002 as part of the Generation and Gender Programme (GGP, www.ggp-i.org) in 19 countries. The GGS is a set of comparative surveys on childbearing, partners, parents, work, and everyday life. It includes several questions concerning relations between generations, as well as a section dedicated to the characteristics of the respondent’s family of origin. Data for Italy were collected in 2003, for Bulgaria in 2004, for Austria in 2008/2009, and for Norway in 2007/2008. Although fecundity may be quite low at older reproductive ages (45‒49), we decided not to omit this group from the empirical analysis. Indeed, several circumstances could increase the likelihood that women aim to realize their childbearing intentions towards the end of their reproductive life, such as, for example, better health at these ages and the increased availability of assisted reproductive technologies. These circumstances might affect especially highly educated women who might plan to have a(nother) child relatively late in life. After this selection the working sample consisted of 12,606 women aged 18 to 49 for whom information about their mothers was available. We selected only the daughter‒mother sample because our focus is on transmission models across female generations. The non-response rate for the question on mother’s occupational status was low (3%). The large majority of interviewed daughters (93%) answered questions regarding fertility intentions. Interestingly, previous literature has shown that most relevant link in the intergenerational transmission of fertility is that between mother and daughter (Tanskanen and Rotkirch 2014), and that (grand)mothers play a crucial role in (grand)childrearing activities (Coall and Hertwig 2010; Mace and Sear 2005).
(92.8%). Indeed, in the parity 1+ sub-sample the variance in the fertility intentions variable was already low ‒ positive fertility intentions were just 18%.
3.2 Measures of fertility intention and explanatory variables
The dependent variable ‘intended number of children’ was measured through the following survey questions “Do you intend to have a(nother) child in the next three years?” and “Suppose you do not have a(nother) child during the next three years, do you intend to have any (more) children at all?”. The response options were, in both cases, “definitely yes”, “probably yes”, “probably not”, “definitely not”, and “does not know”. Of these two questions, we computed a binary variable measuring the intentions to have a(nother) child at all, which is equal to 1 if the respondent intends to have a(nother) child (either definitely or probably and regardless of whether within three years or after that), and 0 otherwise. This variable is the outcome of the zero component of the Zero-Inflated Poisson (ZIP) model used in the analysis (see next section on modelling).
In addition, if the intention was positive (the answer to one of the two questions on childbearing intentions was either “probably” or “definitively”), the following question was asked: “How many (more) children in total do you intend to have?” Respondents were required to indicate a numerical answer ranging from 0 to 8. The variable ‘additionally intended number of children’ is the outcome of the count component of the ZIP model (see next section on modelling).
The key explanatory variables are the following:
a. Daughter’s number of siblings, coded as a categorical variable equal to 0 if the woman is a single child, 1 if she has one brother or sister, 2 if she has two siblings, and 3 if she has three or more siblings.
b. Daughter’s educational attainment. The original 6 ISCED categories were grouped into low (ISCED 0‒2 = pre-primary, primary, lower secondary); medium (ISCED 3‒4 = upper secondary, post-secondary, non-tertiary); and high (ISCED 5‒6 = tertiary) educational attainment. c. Mother’s educational attainment, coded in three categories as for the
daughter.
We created a binary variable coded 1 if the mother was working and 0 otherwise.
e. Country dummies have been included in all models to control for the different socio-economic and cultural contexts. Additionally, all interactions between mother’s characteristics and country have been tested and retained in the final models when significant.
f. Control variables include: age, marital status, employment status, and living arrangement. They all refer to daughter’s characteristics at the time of interview. Age was grouped in six categories: 18–24, 25–29, 30–34 (reference), 35–39, 40–44, and 45–49. Marital status was coded in four categories: married (reference category), single, partnered but not married, and divorced or widowed. Employment status was included as a four-category variable: employed (reference), unemployed, not active, and enrolled in education. Since the characteristics of the mother and the influence the mother has on her daughter’s intentions may depend on living arrangements, we additionally considered whether the respondent lived with the parents and, if not, the time since the respondent had left the parental home. Three dummies were computed and included in the models: “daughter lives with parents”; “daughter has lived separately from her parents for less than six years”; “daughter has lived outside her parental home for six years or more.”
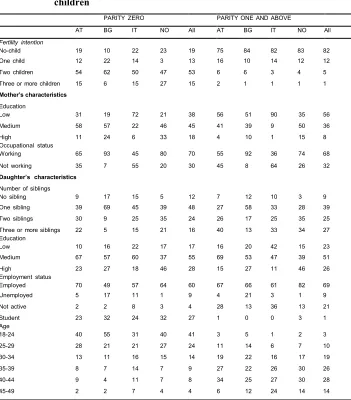
The full distribution of the variables used in the regression analysis by parity and country are reported in Table 2. In the country pooled dataset, the two-child family is the most frequently reported intended family size among two-childless daughters (53%), while 18% of daughters with one or more children intend to have at least one additional child (12% one, 5% two, and 1% three or more children).
Table 2: Descriptive statistics of variables used in the regression.
Values in %. N=4,215 childless daughters and 8,391 daughters with children
PARITY ZERO PARITY ONE AND ABOVE
AT BG IT NO All AT BG IT NO All
Fertility intention
No-child 19 10 22 23 19 75 84 82 83 82 One child 12 22 14 3 13 16 10 14 12 12 Two children 54 62 50 47 53 6 6 3 4 5 Three or more children 15 6 15 27 15 2 1 1 1 1
Mother’s characteristics
Education
Low 31 19 72 21 38 56 51 90 35 56 Medium 58 57 22 46 45 41 39 9 50 36 High
Occupational status Working 11 65 24 93 6 45 33 80 18 70 4 55 10 92 1 36 15 74 8 68 Not working 35 7 55 20 30 45 8 64 26 32
Daughter’s characteristics
Number of siblings
No sibling 9 17 15 5 12 7 12 10 3 9 One sibling 39 69 45 39 48 27 58 33 28 39 Two siblings 30 9 25 35 24 26 17 25 35 25 Three or more siblings
Education Low 22 10 5 16 15 22 21 17 16 17 40 16 13 20 33 42 34 15 27 23 Medium 67 57 60 37 55 69 53 47 39 51 High
Employment status Employed 23 70 27 49 18 57 46 64 28 60 15 67 27 66 11 61 46 82 26 69 Unemployed 5 17 11 1 9 4 21 3 1 9 Not active 2 2 8 3 4 28 13 36 13 21 Student Age 18-24 23 40 32 55 24 31 32 40 27 41 1 3 0 5 0 1 3 2 1 3 25-29 28 21 21 27 24 11 14 6 7 10 30-34 13 11 16 15 14 19 22 16 17 19
35-39 8 7 14 7 9 27 22 26 30 26
40-44 9 4 11 7 8 34 25 27 30 28
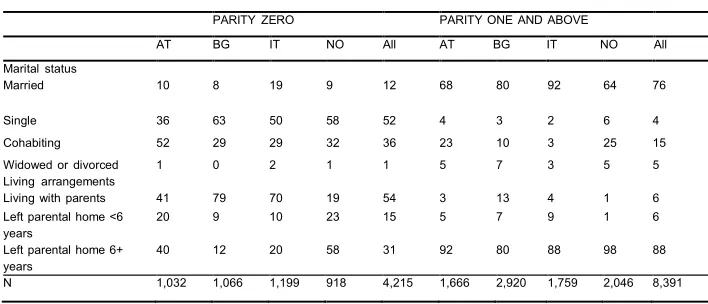
Table 2: (Continued)
PARITY ZERO PARITY ONE AND ABOVE
AT BG IT NO All AT BG IT NO All Marital status
Married 10 8 19 9 12 68 80 92 64 76
Single 36 63 50 58 52 4 3 2 6 4
Cohabiting 52 29 29 32 36 23 10 3 25 15 Widowed or divorced
Living arrangements Living with parents
1
41 0
79 2
70 1
19 1
54 5
3 7
13 3
4 5
1 5
6 Left parental home <6
years
20 9 10 23 15 5 7 9 1 6
Left parental home 6+ years
40 12 20 58 31 92 80 88 98 88
N 1,032 1,066 1,199 918 4,215 1,666 2,920 1,759 2,046 8,391
Source: Authors’ elaboration based on GGS: 2003 Italy, 2004 Bulgaria, 2008/2009 Austria, and 2007/2008 Norway.
Most of the daughters have a medium level of education in both zero parity and higher parity samples (50% of those childless and 51% of those with children) and in the country samples. The only exception is Norway, where the majority of daughters ‒ 46%, regardless of whether childless or with children ‒ are highly educated. Around two-thirds of daughters are employed and a substantial proportion of those childless are still enrolled in education (27%): These percentages range from quarter to one-third, depending on the country considered.
Sixty-five per cent of childless daughters are in the youngest age groups between 18 and 29 years, while 42% of daughters with children are aged 40 and above. More than half of childless daughters are single and about one third are partnered but not married, while 12% are married. By contrast, among daughters with children the great majority (76%) are married, yet a substantial proportion of partnered-but-not-married daughters can be observed in Austria (23%) and Norway (25%). Most daughters (88%) in the parity-one-and-above sub-sample have left the parental home for six or more years, but in the childless sub-sample more than 70% of daughters in Bulgaria (79%) and Italy (70%) still live with their parents.
mothers not working when the daughters were teenagers, 55% for parity zero and 64% for parity one and above.
3.3 Zero-inflated Poisson model
We used a ZIP model to estimate the predictors of women’s fertility intentions. This model is suitable for outcome variables that have a count nature, as in the case of the intended number of children, but that at the same time are likely to have many zeros ‒ not all individuals intend to have children (Osiewalska 2013). The ZIP model encompasses two components that correspond to different zero-generating processes. The first process is governed by a binary distribution (with the probability of occurrence equal to p) that generates structural zeros. The second process is governed by a Poisson distribution that generates counts, some of which may also be zero. As such, those zeros, in accordance with the standard Poisson distribution, are ‘expected’ and are also called Poisson or imperfect zeros, while the others are ‘unexpected’ and are also called perfect zeros (e.g., Lambert 1992). In our case, perfect zeros derive from the clear intention not to have a(nother) child (e.g., because of infertility); while imperfect zeros are related to women who hesitate on the intention to have a child/additional children (that is, women who would like to keep open the possibility of starting or enlarging their family, but still answer ‘zero’; for example, because they are negatively oriented toward additional childbearing).
Hence, ZIP is a statistical model (one distribution) that simultaneously fits two separate regressions. This means that the model has two states: the ‘zero state’ is the regression for probability p of being in perfect state, most commonly a logistic regression; while the ‘count state’ is the standard Poisson regression with expected value equal to λ. These two regressions are connected by the probability (1-p). The formula for the ZIP model, assuming n independent variables Yi (i = 1, 2, …, n) can be represented as follows:
𝑃(𝑌𝑖= 𝑦𝑖) = �
𝑝𝑖+ (1 − 𝑝𝑖) exp(−λ𝑖), 𝑦𝑖= 0
(1 − 𝑝𝑖) exp(−λ𝑖)λ𝑖 𝑦𝑖
𝑦𝑖! , 𝑦𝑖= 1,2, …
� 𝑝𝑖∈ [0,1]
The regressions, both for zero and count states, are included in the following form:
𝑝𝑖=1 + exp (𝑥exp (𝑥𝑖𝛾)
where xiand ωiare vectors of covariates and γ and δ are vectors of parameters. The
coefficients estimated in the zero state should be interpreted as in a standard logistic regression (log of odds ratio), while the coefficients estimated in the count state have the same interpretation as in a standard Poisson regression (logarithmic transformation of lambda).
We selected the ZIP model for two main reasons. First, the no-child intention may have different meanings. It can be a deliberate decision to remain childless or stop childbearing because the intended family size is completed, or the result of an inability to have children, for example, due to infertility. This aspect is taken into account in the model that treats the identical outcome (i.e., zero) as a result of these two different processes. Second, the ZIP model takes into account that positive fertility intentions (i.e., the intention to have a(nother) child) differ from negative fertility intentions (i.e., the intention not to have a(nother) child)5because they require
different actions and have different levels of predictive accuracy of actual fertility (Miller 2011). Nevertheless, they are correlated: If a person has a probability of not intending a child which is equal to p, the intended number of children depends also on the probability 1-p of intending a child. This implies that the two sets of regression coefficients are interdependent and are not merely equal to the coefficient parameters coming from two separate models, i.e., the logistic regression model and the Poisson regression model run on the same sample. This circumstance is a convincing argument for using this complex and less parsimonious model instead of the conventional logistic and Poisson regression models.
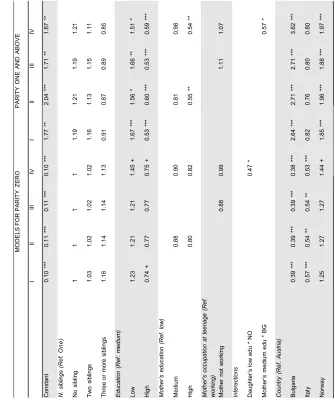
We run four models, differing from each other in that Model I includes the number of siblings and education of the daughter, Model II adds to Model I a control for mother’s education, Model III adds to Model I a control for mother’s occupation at daughter’s teen age, and Model IV considers both mother’s education and mother’s occupation and adds interaction effects between mother’s education and country and between daughter’s education and country. Interactions were included to see whether mother’s education had a different effect in different countries. Interaction effects were retained only where significant in at least one of the two parts – zero or count – of the models, for the sake of model parsimony.
4. Results
4.1 Descriptive analysis
Table 3 reports, separately by parity (zero; one or above), the percentage of daughters intending a(nother) child (upper part), and daughters’ mean intended family size (bottom part), by daughter’s and mother’s level of education and by country. The great majority of childless daughters intend to have at least a first child (81% of parity-zero daughters in the pooled sample report the intention of having a child) but only 18% of those who already have one or more children at the time of the survey express the intention to have a(nother) child. The mean intended family size in the pooled dataset is 1.67 among childless daughters and 2.19 among daughters with children (the first ranging between 1.64 in Bulgaria and 1.68 in Norway and the second between 2 in Bulgaria and Italy and 2.45 in Norway). The difference (around 0.5 children) between the two sub-groups is likely to be artificial, i.e., due to the higher number of ever-born children in the parent sub-sample than in the childless sub-sample, because here the intended family size is calculated as the sum of children already born plus those intended in the future (i.e., complete family size). By contrast, in the outcome variable of the regression models (Models I-IV, Table 4) only the planned component of the family size is considered, while the component of family size related to the children already born is controlled for by stratifying the analysis.
The percentage of daughters intending to have any (more) children increases with daughter’s and mother’s educational attainment. For daughter’s education, among childless women the increase takes a reversed U-shape in Austria and Italy, is U-shaped in Norway, and monotonic in Bulgaria. The increase is also monotonic in all countries for women with at least one child. For mother’s education the increase is monotonic in all countries and in both parity sub-samples (except for Italy in parity one and above, where it takes a reversed U-shape).
Table 3: Fertility intentions by daughter’s and mother’s level of education. Parity zero (0 child) and parity one and above (1+ children)
Austria Bulgaria Italy Norway All countries
Intending any (more) children (%)
Parity 0 1+ 0 1+ 0 1+ 0 1+ 0 1+
Daughter’s education
Low 70 22 86 13 69 13 81 15 76 15
Medium 83 25 90 14 82 21 74 15 83 18 High 80 26 91 23 75 24 77 18 81 23
Mother’s education
Low 75 22 79 9 75 17 65 13 74 14
Medium 83 28 92 23 85 27 76 15 85 23 High 84 38 93 31 91 25 85 27 88 30 Total 81 25 90 16 78 18 77 16 81 18
Number of intended children (Mean)
Parity 0 1+ 0 1+ 0 1+ 0 1+ 0 1+
Daughter’s education
Low 1.51 2.77 1.61 2.52 1.38 2.03 2.03 2.52 1.61 2.47 Medium 1.73 2.37 1.66 1.90 1.70 1.97 1.79 2.43 1.71 2.14 High 1.63 2.35 1.62 1.85 1.51 1.97 1.74 2.44 1.61 2.12
Mother’s education
Low 1.60 2.47 1.43 2.12 1.51 1.99 1.50 2.50 1.51 2.25 Medium 1.67 2.40 1.69 1.88 1.75 1.99 1.76 2.40 1.72 2.13 High 1.97 2.27 1.67 1.89 1.93 2.21 2.07 2.49 1.90 2.18 Total 1.68 2.43 1.64 2.00 1.59 2.00 1.81 2.45 1.67 2.19 N 1,032 1,666 1,066 2,920 1,199 1,759 918 2,046 4,215 8,391
Source: Authors’ elaboration based on Generation and Gender Surveys: 2003 Italy, 2004 Bulgaria, 2008/2009 Austria, and 2007/2008 Norway
4.2 Regression analysis
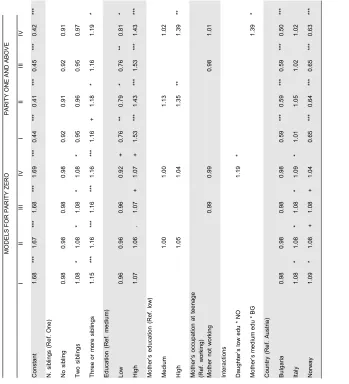
Table 4 reports the estimates of ZIP models run separately on childless daughters and daughters with children. Data for all four countries were pooled together and country dummies were included in the models. Panel a) of Table 4 shows the estimates of the zero part of the model, i.e., the effects of the explanatory variables on the intention not to have a(nother) child. Estimates are given in odds ratios; thus values greater than 1 indicate a positive effect of the covariate on the no-child intention, holding all other variables in the model constant, and values smaller than 1 are suggestive of a negative association. Panel b) of Table 4 reports the estimates of the count part of the model, i.e., the effects of the explanatory variables on the number of intended children expressed in risk ratios. Thus, values greater than 1 indicate a probability to prefer a larger family size, holding all other variables in the model constant, and values smaller than 1 are suggestive of intentions of a smaller family size. In the following, results are presented in parallel for the zero and the count parts of the model whose estimates are reported in panel a) and panel b) of Table 4 respectively. We comment on the results following the order of our hypotheses.
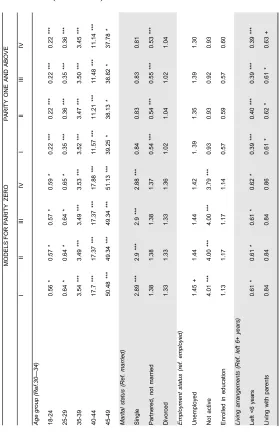
The number of siblings does not significantly influence the zero-child preference but is positively and statistically significantly associated with daughter’s intended number of children. There is no difference between daughters with no siblings and those with one. However, daughters with two and those with three or more siblings are more likely to plan a larger family size than their counterparts with only one brother or sister (the risk ratio is slightly below 1.2 in all the models for both the childless sub-sample and the higher parity sub-sub-sample). The effect is stronger for the childless than for the higher parity sub-sample. In the latter sub-sample there is statistical significance only in Models II and IV, where we control for mother’s education.
Daughter’s education is statistically significantly associated with both the intention of zero children (negatively) and the intended family size (positively), as suggested by the descriptives. Although the direction of these associations is the same in both parity sub-samples, only in the parity-one-or-above sub-sample are they highly statistically significant (e.g., odds ratio equal to 0.59 for high-educated as compared to middle-educated daughters in Model IV of panel a); risk ratio equal to 1.43 for high-educated as compared to middle-high-educated daughters in Model IV of panel b)).
the sub-sample of daughters with children, but the direction is similar in the parity-zero sub-sample.
Country effects show that childless daughters are less likely to report a preference for a no-child family in Italy than in Austria (the odds ratios are about 0.4 and 0.5, respectively, in all the models of panel a) for parity zero), and consistently they have a higher probability of intending a larger family size in Italy than in Austria (risk ratio equal to 1.1 in the models of panel b) for parity zero). In the higher parity sub-sample the situation is different: Bulgaria and Norway are the countries showing the highest odds ratio of no-child intention (3.62 and 1.97, respectively, in the full model of panel a)) and the lowest risk ratio for a given family size (0.50 and 0.63, respectively, in the full model of panel b)).
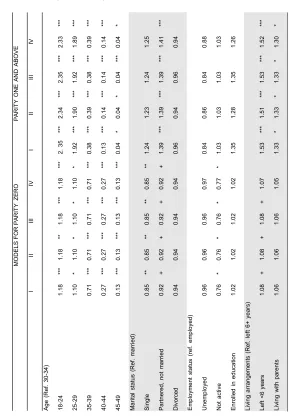
Among the control variables, age has a statistically significant positive effect on the zero-child intention and a statistically significant negative effect on the total number of intended children. The negative relationship between age and intended family size is in line with the life course approach and the interpretation of fertility plans as a moving target (Lee 1980), and goals that are readjusted over the individual’s life course (Liefbroer 2009; Iacovou and Tavares 2011). The positive relationship between a zero-child intention and age is consistent with studies documenting the existence of age norms related to childbearing (Billari et al. 2010). The extremely high odds ratios for no-child obtained in the age groups 40–44 and 45–49 are an indication of the presence of biological limits to reproduction (declining fecundity). For the parity zero sub-sample, being single increases the likelihood of zero-child intentions by a factor of about 2.9 and decreases the expected number of intended children by a factor of 0.85, while being single does not significantly influence the fertility intentions of daughters who already have children. This finding is in line with research showing the importance of being in a partnership for stating positive fertility intentions (Testa and Toulemon 2006). For only parity one and above, being partnered but not married significantly decreases the likelihood of a no-child intention by a factor of 0.5 as compared to being married, while it significantly increases the expected number of intended children by a factor of 1.4. This finding is consistent with prior research documenting a positive effect of cohabitation on fertility intentions, especially when cohabiting is considered as a prelude to marriage (Hiekel and Castro-Martín 2014).
panel a)). A similar result is obtained for daughters at parity one and above. Moreover, in this latter sub-sample, still living with parents is also statistically significantly associated with a lower preference for not having another child. Finally, daughters with children who still live with their parents or left the parental home less than six years ago are more likely to intend to have a larger family as compared to their counterparts who left the parental home six or more years ago (risk ratios equal 1.53 and 1.33 respectively in panel b)).
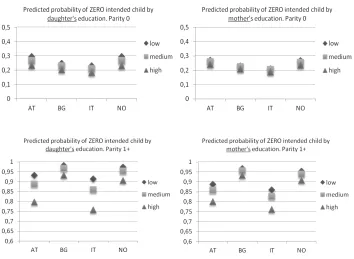
In line with the regression estimates, no relevant educational differences were found in the probability of intending no-child among childless daughters. This result held irrespective of whether daughter’s or mother’s education was considered. By contrast, at parity one or above the zero-child preference was less likely among highly educated daughters as well as among daughters of highly educated mothers, especially in Austria and in Italy (Figure 1, panel a)). In the case of mother’s education, the contrast was mainly between low and medium education on the one hand and high education on the other.
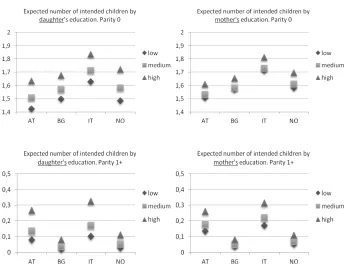
In all four countries, highly educated daughters were found to expect a higher number of intended children. In the sub-sample of daughters with one or more children, differences in the expected number of intended children by daughter’s education and, to a lesser extent, by mother’s education were observed especially in Austria and Italy (Figure 1, panel b)).
Table 4: Intended children among daughters aged 18-45. Zero-inflated Poisson models. N= 4,215 parity zero; 8,391 parity one or above
Panel a) Zero part of the model – odds ratios of intending no child
Table 4: (Continued)
Note: + p < 0.10; * p < 0.05; ** p < 0.01; *** p < 0.001.
Table 4: (Continued)
Panel b) Count part of the model – risk ratios of intending a given number of children
Table 4: (Continued)
Note: + p < 0.10; * p < 0.05; ** p < 0.01; *** p < 0.001.
Figure 1: Predicted probability and expected number of intended children by level of education and parity
Figure 1: (continued)
Panel b) Expected number of intended children
Note: Predicted probabilities and expected number of intended children reported in the graphs are computed on the basis of Models IV estimated in Table 4.
5. Discussion
for daughters who had initiated childbearing at the time of the survey. For this latter sub-group, the decision of whether to have another child is presumably more influenced by their own experience of parenthood than by their childhood/teenage experience in the family of origin. This empirical evidence lends support to previous literature that explains the mother–daughter link with socialisation theories and the availability of social support (as discussed in the Background section).
A second important finding of the analysis reveals that college-educated daughters are more likely to opt for a family with children and to plan a larger family size than their less- educated counterparts, in support of our second research hypothesis. This result is in line with some recent research documenting a positive effect ‒ whether artificial or not ‒ of education on reproductive intentions in low fertility settings (Testa 2014). Yet this is in contrast to earlier studies that found a negative effect of education on fertility behaviour, with better education being related to higher contraceptive use, greater opportunity costs of childbearing, and fewer unplanned births (Bongaarts 2003; Gustavsson 2006; Jejeebhoy 1995) across different cultures and world regions from the early 20th century (see for a review Jones 1982; Skirbekk 2008).
A third important finding is related to the role of the mother’s socio-economic status in the daughter’s fertility intentions. Consistent with the third research hypothesis, we found that mother’s level of education has a positive statistically significant effect on daughter’s number of intended children, even after controlling for daughter’s own education level, though only in the sub-sample of daughters with children. This finding suggests that having a highly educated mother positively influences the number of the daughter’s intended children, regardless of the mechanism behind such a link.
significant association between working mother during her daughter’s teenage years and daughter’s fertility intentions at reproductive age.
Finally, although country differences were observable in the predicted probabilities of intending to have no child at all and the intended number of children, we could not detect any statistically significant country differences in the relationship between the mother’s socio-economic status and the daughter’s fertility intentions, contrary to our research hypothesis 5.
This paper offers a unique contribution by extending existing research on fertility intentions in several ways. First, focusing on mother’s working status and educational level when the daughter was 15 years old places emphasis upon a period in life when the socialization theory assumes children to be affected by their family environment. Moreover, the relation between mother’s socio-economic status and daughter’s fertility intention accounts for the intergenerational transmission of fertility behaviour, i.e., the number of siblings. Second, we also make a methodological contribution to this strand of literature: the zero-inflated Poisson regression model allows us to treat separately the alternative ‘children or no children’ on the one hand, and the preference for a given family size on the other. This is clearly an advantage because these choices are qualitatively different. Third, the availability of a large-scale cross-national survey allowed us to make inferences about the role of mother’s socio-economic status on daughter’s childbearing intentions by comparing Norway, Austria, Italy, and Bulgaria. The data revealed that the mother’s socio-economic status positively influences the daughter’s fertility intentions after the transition to a first child and that this association is common to all four of the countries considered. This result is in contrast to the negative education–fertility relation. To the extent that education is transmitted from mothers to daughters, the positive role of mother’s socio-economic status on daughter’s fertility decision-making offers a valuable interpretation of the positive link between education and fertility intentions that goes beyond the alternatives of self-selection, partner effect, or time squeeze.
6. Acknowledgements
References
Acock, A.C. and Bengtson, V.L. (1980). Socialization and attribution process actual versus perceived similarity among parents and youth. Journal of Marriage and the Family 42(3): 501‒515. doi:10.2307/351895.
Ajzen, I. (1991). The theory of planned behavior. Organizational Behavior and Human Decision Processes 50: 179‒211. doi:10.1016/0749-5978(91)90020-T.
Ajzen, I. (2005). Laws of human behavior: Symmetry, compatibility, and attitude-behavior correspondence. In: Beauducel, A., Biehl, B., Bosniak, M., Conrad, W., Schönberger, G., and Wagener, D. (eds.). Multivariate research strategies. Maastricht: Shaker Publishers: 3‒19.
Ajzen, I. and Fishbein, M. (1980). Understanding attitudes and predicting social behavior. Englewood Cliffs: Prentice Hall.
Barber, J.S. (2001). Ideational influences on the transition to parenthood: Attitudes toward childbearing and competing alternatives. Social Psychology Quarterly 64(2): 101‒127. doi:10.2307/3090128.
Becker, G.S. (1981). A treatise on the family. Cambridge: Harvard University Press. Billari, F.C., Goisis, A., Liefbroer, A.C., Settersen, R.A., Aassve, A., Hagestad, G., and
Speder, Z. (2010). Social age deadlines for the childbearing of women and men. Human Reproduction 26(3): 616‒622. doi:10.1093/humrep/deq360.
Billari, F.C., Philipov, D., and Testa, M.R. (2009). Attitudes, norms and perceived behavioural control: Explaining fertility intentions in Bulgaria. European Journal of Population 25: 439‒466. doi:10.1007/s10680-009-9187-9.
Bolzendahl, C.I. and Myers, D.J. (2004). Feminist attitudes and support for gender equality: Opinion change in women and men, 1974–1998. Social Forces 83(2): 759–790. doi:10.1353/sof.2005.0005.
Bongaarts, J. (1992). Do reproductive intentions matter? International Family Planning Perspectives 18(3): 102‒108. doi:10.2307/2133409.
Bongaarts, J. (2003). Completing the fertility transition in the developing world: The role of educational differences and fertility preferences. Population Council (Policy Research Working Paper; 177). doi:10.1080/0032472032000137835.
Chan, C.G. and Elder, G.H., Jr. (2000). Matrilineal advantage in grandchild- grandparent relations. Gerontologist 40(2): 179‒190. doi:10.1093/geront/40.2.1 79.
Coall, D.A. and Hertwig, R. (2010). Grandparental investments: Past, present, and future. Behavioural and Brain Sciences 33(1): 1‒59. doi:10.1017/S0140525X0 9991105.
D’Addio, A.C. and Mira d’Ercole, M. (2005). Trends and determinants of fertility rates in OECD countries: The role of policies. Paris: OECD Publishing (Social, employment and migration working papers, 27). doi:10.1787/880242325663.
Del Boca, D. (2002). Low fertility and labour force participation of Italian women: evidence and interpretation. Paris: OECD Publishing (Labour market and social policy occasional papers, 61). doi:10.1787/263482758546.
Del Boca, D. and Rosina, A. (2009). Famiglie sole: Sopravvivere con un welfare insufficiente. Bologna: Il Mulino.
Del Boca, D. and Vuri, D. (2007). The mismatch between employment and child care in Italy: The impact of rationing. Journal of Population Economics 20(4): 805‒ 832. doi:10.1007/s00148-006-0126-3.
Dommermuth, L., Klobas, J., and Lappegård, T. (2011). Now or later? The theory of planned behaviour and timing of fertility intentions. Advances in Life Course Research 16: 42‒53. doi:10.1016/j.alcr.2011.01.002.
Dubas, J.S. (2001). How gender moderates the grandparent-grandchild relationship: A comparison of kin-keeper and kin-selector theories. Journal of Family Issues 22(4): 478‒492. doi:10.1177/019251301022004005.
Easterlin, R.A. (1980). Birth and fortune. New York: Basic Books.
Elder, G.H. , Jr. (1977). Family history and the life course. Journal of Family History 2(4): 279‒304. doi:10.1177/036319907700200402.
Elder, G.H., Jr. (1994). Time, human agency, and social change: Perspectives on the life course. Social Psychology Quarterly 57(1): 4‒15. doi:10.2307/2786971.
Esping-Andersen, G. (1999). Social foundations of postindustrial economies. Oxford: Oxford University Press. doi:10.1093/0198742002.001.0001.
Esping-Andersen, G. (2009). The incomplete revolution: Adapting to women’s new roles. Cambridge: Polity Press.
Fan, P.L. and Marini, M.M. (2000). Influences on gender-role attitudes during the transition to adulthood. Social Science Research 29(2): 258–283. doi:10.1006/ ssre.1999.0669.
Fernandez, R. and Fogli, A. (2006). Fertility: The role of culture and family experience. Journal of the European Economic Association 4(2‒3): 552‒561. doi:10.1162/ jeea.2006.4.2-3.552.
Fishbein, M. and Ajzen, I. (2010). Predicting and changing behavior: The reasoned action approach. New York: Psychology Press.
Folbre, N. (1983). Of patriarchy born: The political economy of fertility decisions. Feminist Studies 9(2): 261‒284. doi:10.2307/3177490.
Gauthier, A.H. (2007). The impact of family policies on fertility in industrialized countries: A review of the literature. Population Research and Policy Review 26(3): 323‒346. doi:10.1007/s11113-007-9033-x.
Genov, N. and Krasteva, A. (2001). Recent social trends in Bulgaria, 1960‒1995. Montreal/Kingston: McGill-Queen’s University Press.
Glass, J., Bengtson, V.L., and Dunham, C.C. (1986). Attitude similarity in three- generation families: Socialization, status inheritance, or reciprocal influence? American Sociological Review 51(5): 685‒698. doi:10.2307/2095493.
Goldstein J., Lutz, W., and Testa, M.R. (2003). The emergence of sub-replacement fertility ideals in Europe. Population Research and Policy Review 22(5‒6): 479‒ 496. doi:10.1023/B:POPU.0000020962.80895.4a.
Gustavsson, S. (2006). (ed.). Education and postponement of maternity. Amsterdam: Kluwer.
Hiekel, N. and Castro-Martín, T. (2014). Grasping the diversity of cohabitation: Fertility intentions among cohabiters across Europe. Journal of Marriage and Family 76(3): 489‒505. doi:10.1111/jomf.12112.
Hirsch, M.B., Seltzer, J.R., and Zelnik, M. (1981). Desired family size of young American women, 1971 and 1976. In: Hendershot, G.E. and Placek, P.J. (eds.). Predicting fertility. Lexington: Lexington Books: 207‒233.
Iacovou, M. and Tavares, L.P. (2011). Yearning, learning, and conceding: Reasons men and women change their childbearing intentions. Population and Development Review 37(1): 89‒123. doi:10.1111/j.1728-4457.2011.00391.x.
Jejeebhoy, S.J. (1995). Women’s education, autonomy and reproductive behaviour: Experience from developing countries. Oxford: Clarendon Press.
Jones, E.F. (1982). Socio-economic differentials in achieved fertility: World Fertility Survey comparative studies 21. Voorburg: International Statistical Institute. Kahn, J.R. and Anderson, K.E. (1992). Intergenerational pattern of teenage fertility.
Demography 29(1): 39‒57. doi:10.2307/2061362.
Kaser, K. (2008). Patriarchy after patriarchy: Gender relations in Turkey and in the Balkans, 1500‒2000. Münster: Lit Verlag.
Keim, S., Klärner, A., and Bernardi, L. (2009). Who is relevant? Exploring fertility relevant social networks. Rostock: Max Planck Institute for Demographic Research (MPIDR Working Paper;WP 2009-001).
Kohler, H.P., Behrman, J.R., and Watkins, S.C. (2001). The density of social networks and fertility decisions: evidence from South Nyanza district, Kenya. Demography 38(1): 43‒58. doi:10.1353/dem.2001.0005.
Kohler, H.P., Rodgers, J.L., and Christensen, K. (1999). Is fertility behavior in our genes? Findings from a Danish twin study. Population and Development Review 25(2): 253–288. doi:10.1111/j.1728-4457.1999.00253.x.
Kotte, M. and Ludwig, V. (2011). Intergenerational transmission of fertility intentions and behaviour in Germany: The role of contagion. Vienna Yearbook of Population Research 9: 207–226. doi:10.1553/populationyearbook2011s207.
Kravdal, Ø. and Rindfuss, R.R. (2008). Changing relationships between education and fertility: A study of women and men born 1940 to 1964. American Sociological Review 73(5): 854–873. doi:10.1177/000312240807300508.
Lambert, D. (1992). Zero-inflated Poisson regression, with an application to defects in manufacturing. Technometrics 34(1): 1‒14. doi:10.2307/1269547.
Lappegård, T. (2010). Family policies and fertility in Norway. European Journal of Population 26(1): 99‒116. doi:10.1007/s10680-009-9190-1.
Lee, R. (1980). Aiming at moving target: period fertility and changing reproductive goals. Population Studies 34(2): 205‒226. doi:10.1080/00324728.1980.104 10385.
Liefbroer, A.C. (2009). Changes in family size intentions across young adulthood: A life-course perspective. European Journal of Population 25(4): 363‒386.
doi:10.1007/s10680-008-9173-7.
Liefbroer, A.C. and Billari, F.C. (2010). Bringing norms back in: A theoretical and empirical discussion of their importance for understanding demographic behaviour. Population, Space and Place 16(4): 287‒305. doi:10.1002/psp.552.
Liefbroer, A.C. and Elzinga, C.H. (2012). Intergenerational transmission of behavioural patterns: How similar are parents’ and children’s demographic trajectories? Advances in Life Course Research 17(1): 1‒10. doi:10.1016/j.alcr.2012.01.002.
Lupri, E. (1983). The changing position of women in family and society: A cross-national comparison. Leiden: E. J. Brill.
Mace, R. and Sear, R. (2005). Are humans cooperative breeders? In: Voland, E., Chasiotis, A., and Schiefenhövel, W. (eds.). Grandmotherhood: The evolutionary significance of the second half of female life. New Brunswick: Rutgers University Press: 143‒159.
Mare, R.D. and Maralani, V. (2006). The intergenerational effects of changes in women’s educational attainments. American Sociological Review 71(4): 542‒ 564. doi:10.1177/000312240607100402.
Matras, J. (1961). Differential fertility, intergenerational occupational mobility, and change in the occupational distribution: Some elementary interrelationships. Population Studies 15(2): 187‒197. doi:10.1080/00324728.1961.10406068.
McDonald, P. (2000). Gender equity in theories of fertility transition. Population and Development Review 26(3): 427–439. doi:10.1111/j.1728-4457.2000.00427.x.
Mencarini, L. and Tanturri, M.L. (2004). Time use, family role-set and childbearing among Italian working women. Genus 60(1): 111–137.
Miller, W.B. (2011). Differences between fertility desires and intentions: Implications for theory, research and policy. Vienna Yearbook of Population Research 9: 75‒
98. doi:10.1553/populationyearbook2011s75.
Miller, W.B. and Pasta, D.J. (1995). Behavioural intentions: Which ones predict fertility behaviour in married couples? Journal of Applied Social Psychology 25(6): 530‒555. doi:10.1111/j.1559-1816.1995.tb01766.x.
Mills, M., Mencarini, L., Tanturri, M.L., and Begall, K. (2008). Gender equity and fertility intentions in Italy and the Netherlands. Demographic Research 18(1): 1–
26. doi:10.4054/DemRes.2008.18.1.
Montgomery, M.R. and Casterline, J.B. (1996). Social learning, social influence, and new models of fertility. Population and Development Review 22(Supplement: Fertility in the United States: New patterns, new theories): 151‒175.
doi:10.2307/2808010.
Morgan, K.J. (2006). Working mothers and the welfare state:Rreligion and the politics of work-family policies in western Europe and the United States. Stanford: Stanford University Press.
Moursund, A. and Kravdal, Ø. (2003). Individual and community effects of women’s education and autonomy on contraceptive use in India. Population Studies 57(3): 285‒301. doi:10.1080/0032472032000137817.
Murphy, M. and Knudsen, L.B. (2002). The intergenerational transmission of fertility in contemporary Denmark: The effects of number of siblings (full and half), birth order, and whether male or female. Population Studies 56(3): 235‒248.
doi:10.1080/00324720215937.
Murphy, M. and Wang, D. (2001). Family-level continuities in childbearing in low- fertility societies. European Journal of Population 17(1): 75‒96. doi:10.1023/ A:1010744314362.
Naldini, M. (2003). The family in the Mediterranean welfare states. London/Portland: Taylor and Francis.
Osiewalska, B. (2013). Transmission of fertility pattern in mother–daughter relation: Bayesian view (a case study of Austria). Studia Demograficzne 1(163): 3‒35. Pissarides, C.A., Garibaldi, P., Olivetti, C., Petrongolo, B., and Wasmer, E. (2005).
D., and Pissarides, C. (eds.). Women at work: An economic perspective. Oxford: Oxford University Press: 9‒120.
Pollet, T.V., Nelissen, M., and Nettle, D. (2009). Lineage based differences in grandparental investment: Evidence from a large British cohort study. Journal of Biosocial Science 41(3): 355‒379. doi:10.1017/S0021932009003307.
Rodgers, J.L. and Doughty, D. (2000). Genetic and environmental influences on fertility expectations and outcomes using NLSY kinship data. In: Rodgers, J.L., Rowe, D.C., and Miller, W.B. (ed.). Genetic influences on human fertility and sexuality. New York: Springer: 85‒105. doi:10.1007/978-1-4615-4467-8_6.
Saraceno, C. (1997). Family change, family policies and the restructuring of welfare. OECD (ed.). Family, market and community. Paris: Organisation for Economic Co-operation and Development: 81‒100 (Social Policy Studies No. 21).
Scherbov, S., Mamolo, M., Potančoková, M., Sobotka, T., and Zeman, K. (2014). European demographic data sheet 2014. Vienna: Wittgenstein Centre for Demography and Global Human Capital (IIASA, VID/ÖAW, WU).
Skirbekk, V. (2008). Fertility trends by social status. Demographic Research 18(5): 145‒180. doi:10.4054/DemRes.2008.18.5.
Starrels, M.E. and Holm, K.E. (2000). Adolescents’ plans for family formation: Is parental socialization important? Journal of Marriage and the Family 62(2): 416–429. doi:10.1111/j.1741-3737.2000.00416.x.
Tanskanen, A.O. and Rotkirch, A. (2014). The impact of grandparental investment on mother’s fertility intentions in four European countries. Demographic Research 31(1): 1‒26. doi:10.4054/DemRes.2014.31.1.
Testa, M.R. and Grilli, L. (2006). The influence of childbearing regional contexts on ideal family size in Europe. Population-E 61(1–2): 109–138. doi:10.3917/popu. 601.0107.
Testa, M.R. and Toulemon, L. (2006). Family formation in France: Individual preferences and subsequent outcome. Vienna Yearbook of Population Research 4: 41‒75.
Testa, M.R. (2014). On the positive correlation between education and fertility intentions in Europe: Individual- and country-level evidence. Advances in Life Course Research 21: 28‒42. doi:10.1016/j.alcr.2014.01.005.
Thomson, E. (1992). Family structure, gender and parental socialization. Journal of Marriage and the Family 54(2): 368‒378. doi:10.2307/353068.
Thomson, E. (1997). Couple childbearing desires, intentions, and births. Demography 34(3): 343‒354. doi:10.2307/3038288.
Westoff, C.F. and Potvin, R.H. (1967). College women and fertility values. Princeton: Princeton University Press. doi:10.1515/9781400876051.