R E S E A R C H
Open Access
Risk prediction for 30-day mortality among
patients with
Clostridium difficile
infections:
a retrospective cohort study
Hsiu-Yin Chiang
1, Han-Chun Huang
1, Chih-Wei Chung
1, Yi-Chun Yeh
1, Yi-Chin Chen
2, Ni Tien
3, Hsiu-Shan Lin
3,
Mao-Wang Ho
4and Chin-Chi Kuo
1,2,5*Abstract
Background:Current guidelines have unsatisfied performance in predicting severe outcomes afterClostridium difficileinfection (CDI). Our objectives were to develop a risk prediction model for 30-day mortality and to examine its performance among inpatients with CDI.
Methods:This retrospective cohort study was conducted at China Medical University Hospital, a 2111-bed tertiary medical center in central Taiwan. We included adult inpatients who had a first positiveC. difficileculture or toxin assay and had diarrhea as the study population. The main exposure of interest was the biochemical profiles of white blood cell count, serum creatinine (SCr), estimated glomerular filtration rate, blood urea nitrogen (BUN), serum albumin, and glucose. The primary outcome was the 30-day all-cause mortality and the secondary outcome was the length of stay in the intensive care units (ICU) following CDI. A multivariable Cox model and a logistic regression model were developed using clinically relevant and statistically significant variables for 30-day mortality and for length of ICU stay, respectively. A risk scoring system was established by standardizing the coefficients. We compared the performance of our models and the guidelines.
Results:Of 401 patients, 23.4% died within 30 days. In the multivariable model, malignancy (hazard ratio [HR] = 1.95),≥1.5-fold rise in SCr (HR = 2.27), BUN-to-SCr ratio > 20 (HR = 2.04), and increased glucose (≥193 vs < 142 mg/ dL, HR = 2.18) were significant predictors of 30-day mortality. For patients who survived the first 30 days of CDI, BUN-to-SCr ratio > 20 (Odds ratio [OR] = 4.01) was the only significant predictor for prolonged (> 9 days) length of ICU stay following CDI. The Harrell’scstatistic of our Cox model for 30-day mortality (0.727) was significantly superior to those of SHEA-IDSA 2010 (0.645), SHEA-IDSA 2018 (0.591), and ECSMID (0.650). Similarly, the
conventionalcstatistic of our logistic regression model for prolonged ICU stay (0.737) was significantly superior to that of the guidelines (SHEA-IDSA 2010,c= 0.600; SHEA-IDSA 2018,c= 0.634; ESCMID,c= 0.645). Our risk prediction scoring system for 30-day mortality correctly reclassified 20.7, 32.1, and 47.9% of patients, respectively.
Conclusions:Our model that included novel biomarkers of BUN-to-SCr ratio and glucose have a higher predictive performance of 30-day mortality and prolonged ICU stay following CDI than do the guidelines.
Keywords:Clostridium difficile infection, Mortality, ICU stay, Glucose, BUN-to-SCr ratio
© The Author(s). 2019Open AccessThis article is distributed under the terms of the Creative Commons Attribution 4.0 International License (http://creativecommons.org/licenses/by/4.0/), which permits unrestricted use, distribution, and reproduction in any medium, provided you give appropriate credit to the original author(s) and the source, provide a link to the Creative Commons license, and indicate if changes were made. The Creative Commons Public Domain Dedication waiver (http://creativecommons.org/publicdomain/zero/1.0/) applies to the data made available in this article, unless otherwise stated. * Correspondence:chinchik@gmail.com
1Big Data Center, China Medical University Hospital, Taichung 404, Taiwan 2Department of Medical Research, Department of Internal Medicine, China
Medical University Hospital, Taichung 404, Taiwan
Background
Clostridium difficile infection (CDI) is a critical healthcare-associated infection and accounts for 20–30% of antibiotic-associated diarrhea [1, 2]. The Antibiotic Resistance Threats in the United Statesreport prioritized
C. difficile as an urgent threat because it spreads rapidly and is naturally resistant to many antimicrobials used to treat other infections [3].
Predicting patients with CDI who are at risk of developing severe complications can guide appropriate treatment and follow-up, and in turn, prevent adverse outcomes [4, 5]. SHEA-IDSA 2010 and SHEA-IDSA 2018 clinical practice guidelines for treating CDI recommend using vancomycin or fidaxomicin to treat initial severe CDI [6, 7]. Two pub-lished studies provided evidence that, as high as 31.2–38% of severe CDI and 56–65% of severe-complicate CDI were under-treated [4, 5]. Compared with patients who were treated appropriately, those who were under-treated (ac-cording to SHEA-IDSA 2010 guideline) [6] were more likely to have adverse outcomes of all-cause mortality (Crowell’s: 7.2% vs 15.0%; Patel’s: 12.9% vs 43.5%), CDI-related mortal-ity (Crowell’s: 3.8% vs 7.7%; Patel’s: 8.9% vs 21.7%), pro-longed CDI-related hospital length of stay (Crowell’s: mean 7.5 days vs 9.4 days), or CDI-related ICU transfer (Patel’s: 4.8% vs 17.4%) [4,5]. When patients were stratified by sever-ity (defined by SHEA-IDSA 2010 guideline) [6], patients with severe CDI who were under-treated experienced more complications than those who were appropriately treated (death: 20% vs 18.5% for severe CDI; ICU transfer: 20% vs 7.4% for severe CDI), although these findings were not sta-tistically significant [5]. Therefore, identification of poten-tially severe cases of CDI could provide evidence for appropriate treatment and lead to better patient outcomes.
Conventionally, marked leukocytosis, acute rise in serum creatinine (SCr), hypoalbuminemia, and older age are considered to be prognostic factors of severe compli-cations (ie, intensive care unit [ICU] admission, colec-tomy, or death), according to guidelines developed by the Society for Healthcare Epidemiology of America and the Infectious Disease Society of America (SHEA-IDSA) in 2010 and 2018 and guidelines developed by the Euro-pean Society of Clinical Microbiology and Infectious Diseases (ESCMID) in 2014 [6–8]. Although these indi-cators reasonably represent the underlying interactions between infection, immune–inflammatory responses, and malnutrition, their performance in predicting CDI severity is unsatisfactory [7,9].
Other severity indices that included comorbidities (eg, malignancy and renal disease) [10, 11], symptoms (eg, fever, hypotension, septic shock, pseudomembranous col-itis, and ascites) [12–14], or antibiotic utilization [15, 16] as severity predictors have been reported to improve risk assessment of CDI severity in inpatients or ICU settings [17]. However, subjective measures, different outcomes
(ie, mortality, colectomy, ICU admission, recurrence, or cure rate), and inconsistent CDI diagnostic criteria (eg, without information of diarrhea status) [9,18], comprom-ise the comparability and generalizability of the previous findings [17]. From a pathophysiological perspective, dehy-dration, a warning sign of severe diarrhea and subsequent hemodynamic instability, should certainly be considered but has never been evaluated as a risk predictor for severe CDI. Blood urea nitrogen (BUN)-to-SCr ratio, which can quantify dehydration and distinguish pre renal kidney in-jury from intrinsic kidney disease, is a potential predictor for severe CDI.
To address the aforementioned gaps, we conducted this study to develop a new risk prediction model in-corporating comorbidities, markers of infection, renal function, dehydration, and serum glucose to predict the risk of 30-day mortality, and to compare the predictive performance of our model and existing guidelines among adult patients with symptomatic CDI.
Methods Data source
This retrospective cohort study was conducted at China Medical University Hospital (CMUH), a 2111-bed ter-tiary medical center in Taiwan. The data source was the CMUH–Clinical Research Data Repository (CRDR), which accumulates the single unified views of 2,660,472 patients who had sought care at CMUH between 2003 and 2016. The Institutional Review Board of CMUH ap-proved this study (105-REC3–068 & 107-REC2–016).
Study population
Our study included all patients who had first-time positive results ofC. difficile toxin assay or culture at CMUH be-tween January 1, 2012, and December 31, 2016. The index date was the date when the specimen of positiveC. difficile
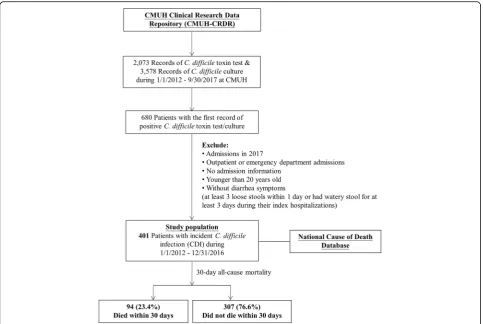
result was obtained. We excluded patients who 1) were aged younger than 20 years, 2) were not admitted, or 3) did not have diarrhea (at least 3 loose stools per day or loose stools for at least 3 days during hospitalization) [14, 19]. Data were pulled from the CMUH–CRDR, except for diar-rhea status, which was manually reviewed using medical re-cords. The mortality data were obtained by linking to the National Cause of Death Database. Our study population comprised 401 adult inpatients who had incident symptom-atic CDI (Fig.1).
Covariables and outcomes
exposure of interest was the biochemical profiles of white blood cell count (WBC), SCr, estimated glomeru-lar filtration rate (eGFR) through CKD-EPI equation [20], BUN, serum albumin, and glucose that were mea-sured within−30 to−3 days of the index date (baseline) or measured within ±3 days of the index date (index). The definitions of variables are listed in Additional file1: Figure S1. The primary outcome of interest was the 30-day all-cause mortality following the index CDI and the secondary outcome of interest was the length of ICU stay following CDI (for patients who survived the first 30 days of CDI).
Severity predictors from guidelines
Previous guidelines have provided certain severity predic-tors for identifying severe cases of CDI. The SHEA-IDSA 2010 criteria for a severe CDI are outlined as follows: hav-ing a WBC of ≥15,000 cells/μL or a 1.5-fold relative in-crease in SCr (compared with premorbid level) [6]. The SHEA-IDSA 2018 criteria are presented as follows: having a WBC of≥15,000 cells/μL or an index SCr of≥1.5 mg/dL (133μM) [7]. The ESCMID 2014 criteria are outlined as follows: being aged ≥65 years, having a WBC of≥15,000 cells/μL, a serum albumin level of < 3.0 g/dL, or a SCr
level of ≥1.5 mg/dL (133μM) or a 1.5-fold relative in-crease in SCr [8].
Statistical analyses
Continuous variables are presented as medians and inter-quartile ranges (IQR) and were analyzed using the Wil-coxon rank-sum test. Categorical variables are presented as frequency and proportions (%) and were analyzed using a chi-square test or Fisher’s exact test. All analyses were 2 sided, and the significance level was set to 0.05.
compared the performance of our risk prediction model with that of the guidelines by using discrimination meas-ure of Harrell’scstatistic for Cox models [22] or conven-tionalcstatistic for logistic regression models.
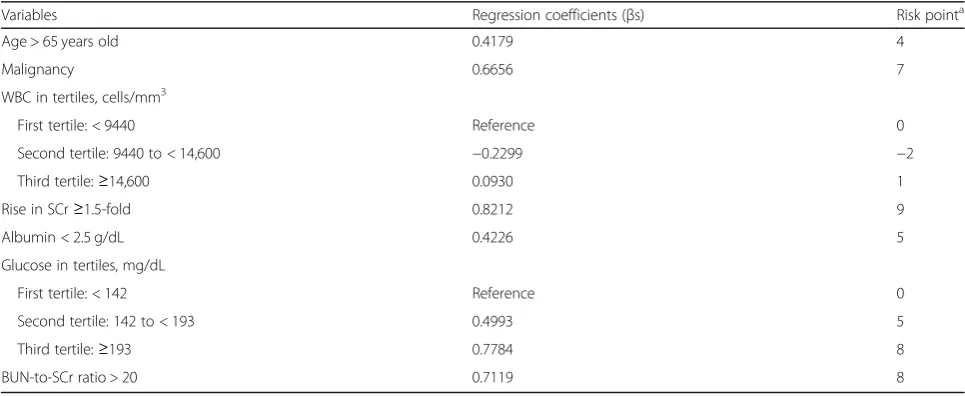
To develop the risk prediction scores, we assigned each independent variable a risk point, which was de-rived by dividing the beta regression coefficient of each variable by the smallest absolute coefficient and round-ing off the quotient to the nearest integer [23]. A sever-ity score was calculated for each patient by summing up the risk points corresponding to the risk factors. We then divided the study population into 2 groups on the basis of their severity scores (< 29 vs≥29). We compared the performance of our risk prediction scoring system with that of the guidelines by using the reclassification measure of net reclassification index (NRI) [24].
Statistical analysis was performed using SAS version 9.4 (SAS Institute Inc., Cary, NC, USA) and R version 3.0.2 (R Foundation for Statistical Computing, Vienna, Austria) software. All analyses were 2 sided, and the sig-nificance level was set to 0.05.
Results
Description of patients withC. difficileinfections
Of 401 inpatients with CDI, the mean age was 68.2 years, 59.1% were men, and 59.3% had documented fever (Table 1). PositiveC. difficile toxin test results were de-tected in 54.1% of the patients and positive culture re-sults were found in the remaining patients. The median hospital stay was 25 days, 52.9% were admitted to the ICU, and 23.4% died within 30 days after the index CDI.
Characteristics associated with 30-day mortality
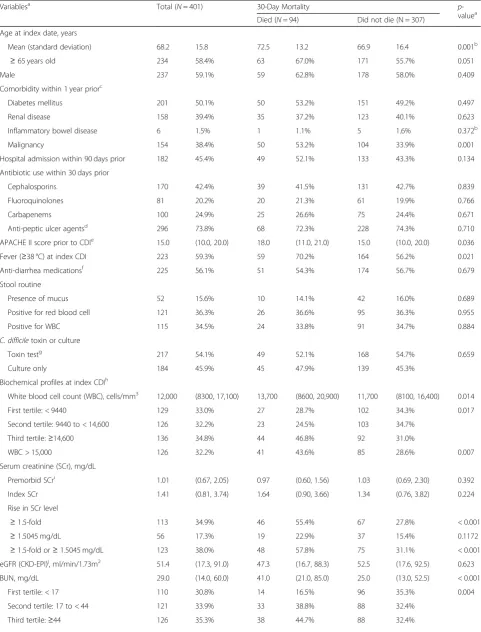
Patient who died within 30 days following their CDI were more likely to be older (mean age: 72.5 vs 66.9 years), have malignancies (eg, leukemia and lymphoma; 53.2% vs 33.9%), have fever (70.2% vs 56.2%), and have higher Acute Physiology and Chronic Health Evaluation (APACHE) II scores among patients admitted to ICUs prior to CDI (median 18 vs 15), compared with those who survived within 30 days (Table1).
The biochemical profiles significantly differed between patients who died and those who survived, except for the baseline eGFR. Patients who died had higher levels of WBC (median 13,700 vs 11,700 cells/μL), an increased likelihood of having an SCr level 1.5-fold higher than their premorbid level (55.4% vs 27.8%), higher levels of BUN (median 41.0 vs 25.0 mg/dL), an increased likelihood of having a BUN-to-SCr ratio of > 20 (69.4% vs 40.8%), lower levels of albumin (median 2.35 vs 2.60 g/dL), and higher levels of glucose (median 192 vs 158 mg/dL).
Risk prediction model for 30-day mortality
To develop the risk prediction model, we included age > 65 years, malignancy history, index WBC in tertiles,
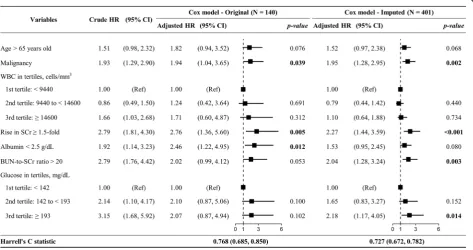
1.5-fold rise in SCr, albumin < 2.5 g/dL, BUN-to-SCr ratio > 20, and glucose in tertiles in a Cox model (Fig. 2). The results obtained for the original and imputed data were similar. Malignancy (hazard ratio [HR] = 1.95; 95% confi-dence interval [CI] = 1.28, 2.95), rise in SCr (HR = 2.27, 95% CI = 1.44, 3.95), BUN-to-SCr ratio > 20 (HR = 2.04, 95% CI = 1.28, 3.24), and glucose level≥193 mg/dL (ref-erence: < 142 mg/dL, HR = 2.18, 95% CI = 1.17, 4.05) were significantly associated with 30-day mortality when imputed data were used. The discrimination perform-ance of our model (Harrell’scstatistic = 0.727; 95% CI = 0.672, 0.782) was significantly superior to that of the model using severity indicators stated in the SHEA-IDSA 2010 (c statistic = 0.645; 95% CI = 0.588, 0.702), SHEA-IDSA 2018 (c statistic = 0.591; 95% CI = 0.537, 0.644), and the ESCMID guidelines (c statistic = 0.650; 95% CI = 0.594, 0.711) (Table2).
Risk prediction scoring system for 30-day mortality
To develop a risk prediction scoring system, we assigned each risk predictor a risk point (Table3). Patients with a risk score of ≥29 were considered to be at a higher risk (10% or higher) of 30-day mortality. Compared with the SHEA-IDSA 2010, SHEA-IDSA 2018, and ESCMID guidelines, our scoring system reclassified 20.7, 32.1, and 47.9% of the CDI patients into the correct risk category, respectively (Additional file1: Table S1).
Risk prediction model for prolonged length of ICU stay following CDI
Of 307 patients who survived the first 30 days following CDI, the mean length of ICU stay following CDI was 9.8 days (median: 0 days; interquartile range, 0–9 days). We used the 3rd quartile (9 days) as the cut-off for pro-longed post-CDI length of ICU stay in the multivariable logistic regression analysis.
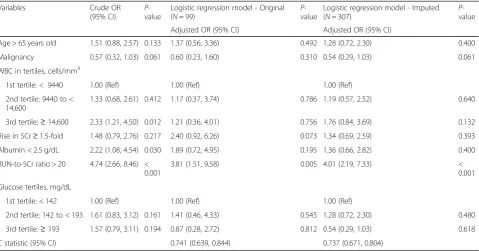
We evaluated the performance of our risk prediction model in predicting post-CDI length of ICU stay > 9 days (Table4). BUN-to-SCr ratio was the only significant and strong predictor for prolonged length of ICU stay follow-ing CDI (imputed data: adjusted OR, 4.01; 95% CI, 2.19– 7.33). The discrimination performance of our prediction model was moderate (imputed data:cstatistic, 0.737; 95% CI, 0.671–0.804), and was superior to the discrimination performance of SHEA-IDSA 2010 (cstatistic, 0.600; 95% CI, 0.527–0.673), SHEA-IDSA 2018 (cstatistic, 0.634; 95% CI, 0.564–0.704), and ESCMID (cstatistic, 0.645; 95% CI, 0.573–0.718) (Table5).
Discussion
Table 1Baseline demographic and clinical characteristics of adult inpatients withClostridium difficileinfections (CDI)
Variablesa Total (N= 401) 30-Day Mortality p
-valuea
Died (N= 94) Did not die (N = 307)
Age at index date, years
Mean (standard deviation) 68.2 15.8 72.5 13.2 66.9 16.4 0.001b
≥65 years old 234 58.4% 63 67.0% 171 55.7% 0.051
Male 237 59.1% 59 62.8% 178 58.0% 0.409
Comorbidity within 1 year priorc
Diabetes mellitus 201 50.1% 50 53.2% 151 49.2% 0.497
Renal disease 158 39.4% 35 37.2% 123 40.1% 0.623
Inflammatory bowel disease 6 1.5% 1 1.1% 5 1.6% 0.372b
Malignancy 154 38.4% 50 53.2% 104 33.9% 0.001
Hospital admission within 90 days prior 182 45.4% 49 52.1% 133 43.3% 0.134
Antibiotic use within 30 days prior
Cephalosporins 170 42.4% 39 41.5% 131 42.7% 0.839
Fluoroquinolones 81 20.2% 20 21.3% 61 19.9% 0.766
Carbapenems 100 24.9% 25 26.6% 75 24.4% 0.671
Anti-peptic ulcer agentsd 296 73.8% 68 72.3% 228 74.3% 0.710
APACHE II score prior to CDIe 15.0 (10.0, 20.0) 18.0 (11.0, 21.0) 15.0 (10.0, 20.0) 0.036
Fever (≥38 °C) at index CDI 223 59.3% 59 70.2% 164 56.2% 0.021
Anti-diarrhea medicationsf 225 56.1% 51 54.3% 174 56.7% 0.679
Stool routine
Presence of mucus 52 15.6% 10 14.1% 42 16.0% 0.689
Positive for red blood cell 121 36.3% 26 36.6% 95 36.3% 0.955
Positive for WBC 115 34.5% 24 33.8% 91 34.7% 0.884
C. difficiletoxin or culture
Toxin testg 217 54.1% 49 52.1% 168 54.7% 0.659
Culture only 184 45.9% 45 47.9% 139 45.3%
Biochemical profiles at index CDIh
White blood cell count (WBC), cells/mm3 12,000 (8300, 17,100) 13,700 (8600, 20,900) 11,700 (8100, 16,400) 0.014
First tertile: < 9440 129 33.0% 27 28.7% 102 34.3% 0.017
Second tertile: 9440 to < 14,600 126 32.2% 23 24.5% 103 34.7%
Third tertile:≥14,600 136 34.8% 44 46.8% 92 31.0%
WBC > 15,000 126 32.2% 41 43.6% 85 28.6% 0.007
Serum creatinine (SCr), mg/dL
Premorbid SCri 1.01 (0.67, 2.05) 0.97 (0.60, 1.56) 1.03 (0.69, 2.30) 0.392
Index SCr 1.41 (0.81, 3.74) 1.64 (0.90, 3.66) 1.34 (0.76, 3.82) 0.224
Rise in SCr level
≥1.5-fold 113 34.9% 46 55.4% 67 27.8% < 0.001
≥1.5045 mg/dL 56 17.3% 19 22.9% 37 15.4% 0.1172
≥1.5-fold or≥1.5045 mg/dL 123 38.0% 48 57.8% 75 31.1% < 0.001
eGFR (CKD-EPI)j, ml/min/1.73m2 51.4 (17.3, 91.0) 47.3 (16.7, 88.3) 52.5 (17.6, 92.5) 0.623
BUN, mg/dL 29.0 (14.0, 60.0) 41.0 (21.0, 85.0) 25.0 (13.0, 52.5) < 0.001
First tertile: < 17 110 30.8% 14 16.5% 96 35.3% 0.004
Second tertile: 17 to < 44 121 33.9% 33 38.8% 88 32.4%
Table 1Baseline demographic and clinical characteristics of adult inpatients withClostridium difficileinfections (CDI)(Continued)
Variablesa Total (N= 401) 30-Day Mortality p
-valuea
Died (N= 94) Did not die (N = 307)
BUN > 26 188 52.7% 55 64.7% 133 48.9% 0.011
BUN-to-SCr ratio 18.8 (12.2, 30.1) 26.1 (17.6, 36.8) 16.8 (11.1, 27.3) < 0.001
Index BUN-to-SCr > 20 170 47.6% 59 69.4% 111 40.8% < 0.001
Albumin, g/dL 2.50 (2.20, 2.90) 2.35 (2.00, 2.80) 2.60 (2.20, 3.00) 0.003
Albumin < 2.5 89 44.3% 33 56.9% 56 39.2% 0.022
Albumin < 3 155 77.1% 50 86.2% 105 73.4% 0.051
Serum glucose, mg/dL 162 (129, 222) 192 (151, 232) 158 (127, 208) 0.002
First tertile: < 142 107 32.7% 13 16.9% 94 37.6% 0.001
Second tertile: 142 to < 193 108 33.0% 26 33.8% 82 32.8%
Third tertile:≥193 112 34.3% 38 49.4% 74 29.6%
Abbreviations:APACHEAcute Physiology and Chronic Health Evaluation,BUNblood urea nitrogen level,CDI C. difficileinfections,CIconfidence interval,eGFR
estimated Glomerular filtration rate,HRhazard ratio,IQRinterquartile range,SCrserum creatinine,WBCwhite blood cell count
a
Continuous variables were presented as median and IQRs and analyzed using Wilcoxon rank-sum test, if not otherwise indicated. Categorical variables were presented as frequency and proportion (%) and analyzed using chi-square test, if not otherwise indicated.P-values that were < 0.05 are shown in bold.
b
Mean age and the proportion of inflammatory bowel disease were analyzed using two-sample t-test and Fisher’s exact test, respectively.
c
Diabetes mellitus was defined according to the patients’ICD-9-CM diagnosis codes and the use of glucose-lowering agents. Renal disease, inflammatory bowel disease, and malignancy were defined using the ICD-9-CM diagnosis codes.
d
Use of anti-peptic ulcer agents of proton-pump inhibitors and histamine-2 receptor antagonists within 0 to 14 days of the index CDI.
e
APACHE II score was only available for patients admitted to intensive care units (N= 211).
f
Use of anti-diarrhea medications or probiotics within 0 to 14 days of the index CDI.
g
Included 158 patients (39.4%) with positive toxin genes test and 59 patients (14.7%) with positive C. difficile toxin enzyme immunoassay test.
h
We obtained the maximum WBC, maximum index SCr, closest BUN, minimum albumin, and closest glucose values that were measured within−3 to + 3 days of the index CDI.
i
For premorbid SCr, we obtained the minimum SCr that were measured within−30 to−4 days of the index CDI.
j
eGFR was estimated by CKD-EPI equation (Levey 2009).
albumin < 2.5 g/dL, BUN-to-SCr ratio > 20, and serum glucose in tertiles, where BUN-to-SCr ratio and glucose have not been indicated in prior studies. Our risk predic-tion model and risk predicpredic-tion scoring system performed superior to current guidelines in predicting 30-day mor-tality and prolonged length of ICU stay following CDI.
Published guidelines in the US (SHEA-IDSA 2010 and 2018) [6, 7] and Europe (ECSMID 2014) [8] and recently developed severity indices, such as the Zar [26], Bauer [19], ATLAS [15], Velazquez-Gomez [14], or Gomez-Simmonds [27] scoring systems, have attempted to establish valid criteria for predicting the severity of CDI. Nonetheless, guidelines are based
on expert opinions or systematic reviews and the defini-tions of severe CDI and its treatment outcomes evaluated in other studies have varied. For example, Zar et al. assessed both cure rate and relapse [26]; Bauer et al. evalu-ated treatment failure and recurrence [19]; and ATLAS evaluated cure rate, and its findings were validated in an-other cohort for mortality and colectomy [15, 28]. In-creased levels of WBC (≥15,000 or 30,000 cells/μL) and rise in SCr (1.5-fold high than the premorbid level or ab-solute value of 1.5 mg/dL), which indicate immune reac-tion and renal funcreac-tion, are the most common markers between the aforementioned severity criteria [6,7,15,19]. Hypoalbuminemia (< 2.5 or < 3 mg/dL), a malnutrition
Table 2Discrimination performance of published guidelines for 30-day mortality among adult inpatients withC. difficileinfectionsa
Variables SHEA-IDSA (2010)b
SHEA-IDSA (2018)b
ESCMID (2014)c
Original (N= 322) Imputed (N = 401) Original (N= 374) Imputed (N= 401) Original (N= 165) Imputed (N = 401)
aHR (95% CI) p
-value
aHR (95% CI) p
-value
aHR (95% CI) p
-value
aHR (95% CI) p
-value
aHR (95% CI) p
-value
aHR (95% CI) p
-value
Age > 65 years old – – – – – – – – 1.44 (0.84, 2.47) 0.185 1.41 (0.91, 2.17) 0.124
WBC > 15,000 cells/
mm3
1.44 (0.92, 2.24) 0.110 1.43 (0.92, 2.24) 0.113 1.72 (1.13, 2.61) 0.012 1.69 (1.11, 2.56) 0.013 1.91 (1.12, 3.27) 0.018 1.51 (1.00, 2.29) 0.053
Rise in SCr≥1.5-fold 2.55 (1.64, 3.98) <
0.0001
2.58 (1.65, 4.03) <
0.0001 – – – – – – – –
SCr≥1.5045 mg/dL – – – – 1.27 (0.84, 1.93) 0.265 1.35 (0.89, 2.04) 0.157 – – – –
Rise in SCr≥1.5-fold
or≥1.5045 mg/dL – – – – – – – –
1.40 (0.77, 2.54) 0.268 2.23 (1.37, 3.61) 0.001
Albumin < 3 g/dL – – – – – – – – 1.93 (0.91, 4.08) 0.085 1.60 (0.83, 3.10) 0.159
cstatistic (95% CI) 0.644 (0.587, 0.701) 0.645 (0.588, 0.702)d
0.587 (0.533, 0.641) 0.591 (0.537, 0.644)d
0.640 (0.571, 0.709) 0.650 (0.594, 0.706)d
Abbreviations:aHRadjusted hazard ratio,CDI C. difficileinfections,CIconfidence interval,SCrserum creatinine,WBCwhite blood cell count
a
We included the variables in separate Cox proportional hazard models and evaluated the discrimination performance of these models using Harrell’scstatistic.
b
The Society of Hospital Epidemiology of America (SHEA) and the Infectious Disease Society of America (IDSA) jointly published the clinical practice guidelines for CDI in 2010 and updated in 2018 (Cohen 2010; McDonald 2018).
c
The European Society of Clinical Microbiology and Infectious Diseases (ESCMID) published the treatment guideline for CDI in 2014 (Debast 2014).
d
The discrimination performance of these models was significantly lower than that of our prediction model (Harrell’scstatistic = 0.727; 95% CI = 0.672, 0.782).
Table 3Risk prediction model for 30-day mortality among adult inpatients withC. difficileinfections and the risk points
Variables Regression coefficients (βs) Risk pointa
Age > 65 years old 0.4179 4
Malignancy 0.6656 7
WBC in tertiles, cells/mm3
First tertile: < 9440 Reference 0
Second tertile: 9440 to < 14,600 −0.2299 −2
Third tertile:≥14,600 0.0930 1
Rise in SCr≥1.5-fold 0.8212 9
Albumin < 2.5 g/dL 0.4226 5
Glucose in tertiles, mg/dL
First tertile: < 142 Reference 0
Second tertile: 142 to < 193 0.4993 5
Third tertile:≥193 0.7784 8
BUN-to-SCr ratio > 20 0.7119 8
Abbreviations:BUNblood urea nitrogen,SCrserum creatinine,WBCwhite blood cell count
a
marker, is another commonly marker for severe CDI [8, 14,26,27].
Other predictors of poor CDI outcomes that have been reported included: older age [26], systemic antibiotic use, underlying illnesses, altered mental status [14], physical findings (eg, fever, hypotension [14], tachycardia [14], abdominal pain or distention, and septic shock
[27]), pseudomembranous colitis [14, 26, 27], ICU ad-mission [14, 26], toxic megacolon, and colectomy [27]. However, ICU admission and CDI-related complications should not be used as prognostic predictors because these events are outcomes of severe CDI.
Our severity predictive model had significantly higher discrimination power than did the existing guidelines in
Table 4Risk prediction model for prolonged (> 9 days) length of ICU stay followingC. difficileinfections (CDI) among adult inpatients with CDI who survived the first 30 days following CDI (N= 307)a
Variables Crude OR
(95% CI)
P -value
Logistic regression model - Original (N= 99)
P -value
Logistic regression model - Imputed (N= 307)
P -value
Adjusted OR (95% CI) Adjusted OR (95% CI)
Age > 65 years old 1.51 (0.88, 2.57) 0.133 1.37 (0.56, 3.36) 0.492 1.28 (0.72, 2.30) 0.400
Malignancy 0.57 (0.32, 1.03) 0.061 0.60 (0.23, 1.60) 0.310 0.54 (0.29, 1.03) 0.061
WBC in tertiles, cells/mm3
1st tertile: < 9440 1.00 (Ref) 1.00 (Ref) 1.00 (Ref)
2nd tertile: 9440 to < 14,600
1.33 (0.68, 2.61) 0.412 1.17 (0.37, 3.74) 0.786 1.19 (0.57, 2.52) 0.640
3rd tertile:≥14,600 2.33 (1.21, 4.50) 0.012 1.21 (0.36, 4.01) 0.756 1.76 (0.84, 3.69) 0.132
Rise in SCr≥1.5-fold 1.48 (0.79, 2.76) 0.217 2.40 (0.92, 6.26) 0.073 1.34 (0.69, 2.59) 0.393
Albumin < 2.5 g/dL 2.22 (1.08, 4.54) 0.030 1.89 (0.72, 4.95) 0.195 1.36 (0.66, 2.82) 0.400
BUN-to-SCr ratio > 20 4.74 (2.66, 8.46) < 0.001
3.81 (1.51, 9.58) 0.005 4.01 (2.19, 7.33) <
0.001
Glucose tertiles, mg/dL
1st tertile: < 142 1.00 (Ref) 1.00 (Ref) 1.00 (Ref)
2nd tertile: 142 to < 193 1.61 (0.83, 3.12) 0.161 1.41 (0.46, 4.33) 0.545 1.28 (0.72, 2.30) 0.480
3rd tertile:≥193 1.57 (0.79, 3.11) 0.194 0.87 (0.28, 2.72) 0.812 0.54 (0.29, 1.03) 0.618
Cstatistic (95% CI) 0.741 (0.639, 0.844) 0.737 (0.671, 0.804)
Abbreviations:BUNblood urea nitrogen,CIconfidence interval,ORodds ratio,Refreference,SCrserum creatinine,WBCwhite blood cell count
a
We included variables in a logistic regression model and evaluated the discrimination performance using conventionalcstatistic.
Table 5Discrimination performance of published guidelines for prolonged (> 9 days) length of ICU stay followingC. difficile
infections (CDI) among adult inpatients with CDI who survived the first 30 days following CDI (N = 307)a
Variables SHEA-IDSA (2010)b
SHEA-IDSA (2018)b
ESCMID (2014)c
Original (N= 239) Imputed (N= 307) Original (N= 283) Imputed (N= 307) Original (N= 143) Imputed (N = 307)
aOR (95% CI) p
-value
aOR (95% CI) p
-value
aOR (95% CI) p
-value
aOR (95% CI) p
-value
aOR (95% CI) p
-value
aOR (95% CI) p
-value
Age > 65 years old – – – – – – – – 1.25 (0.60, 2.60) 0.549 1.45 (0.84, 2.51) 0.182
WBC > 15,000 cells/
mm3 1.96 (1.06, 3.64) 0.033 2.19 (1.25, 3.83) 0.006 2.26 (1.28, 3.99) 0.005 2.10 (1.20, 3.67) 0.009 1.80 (0.84, 3.85) 0.129 2.11 (1.20, 3.70) 0.010
Rise in SCr≥1.5-fold 1.31 (0.69, 2.49) 0.403 1.30 (0.70, 2.40) 0.411 – – – – – – – –
SCr≥1.5045 mg/dL – – – – 1.91 (1.10, 3.31) 0.022 1.84 (1.07, 3.16) 0.026 – – – –
Rise in SCr≥1.5-fold
or≥1.5045 mg/dL
– – – – – – – – 2.38 (1.08, 5.23) 0.031 1.74 (0.98, 3.09) 0.057
Albumin < 3 g/dL – – – – – – – – 1.74 (0.72, 4.17) 0.219 1.29 (0.58, 2.85) 0.529
Cstatistic (95% CI) 0.591 (0.513, 0.670) 0.600 (0.527, 0.673)d 0.643 (0.572, 0.714) 0.634 (0.564, 0.704)d 0.657 (0.561, 0.754) 0.645 (0.573, 0.718)d
Abbreviations:aHRadjusted hazard ratio,CDI C. difficileinfections,CIconfidence interval,SCrserum creatinine,WBCwhite blood cell count
a
We included the variables in separate logistic regression models and evaluated the discrimination performance of these models using conventionalcstatistic.
b
The Society of Hospital Epidemiology of America (SHEA) and the Infectious Disease Society of America (IDSA) jointly published the clinical practice guidelines for CDI in 2010 and updated in 2018 (Cohen 2010; McDonald 2018).
c
The European Society of Clinical Microbiology and Infectious Diseases (ESCMID) published the treatment guideline for CDI in 2014 (Debast 2014).
d
predicting 30-day mortality. Our scoring system reclassi-fied 21% (SHEA-IDSA 2010), 32% (SHEA-IDSA 2018), or 46% (ESCMID) of CDI patients into the correct risk category. Consistent with our findings, Stevens et al. showed that both the SHEA-IDSA 2010 and 2018 cri-teria had low discrimination power (c= 0.582 and 0.587) [9]. Further evaluation of these clinical guidelines in high-quality studies is required, which is also suggested by the latest SHEA-IDSA guidelines [7].
Other severity indices did not evaluate their perform-ance in predicting prolonged length of ICU stay separately from other outcomes, but they used composite measure of mortality, ICU admission, or colectomy [18,27,29]. How-ever, ICU admission may not be a reasonable outcome measure because many patients with CDI are already in the ICU at the time of CDI occurrence. In our study, we assessed the secondary outcome of prolonged length of ICU stay following CDI and used 9 days as the cut-off. The 9-day cut-off is the 75th quartile in the distribution in our study population and is also comparable to the length of ICU stay attributable to CDI reported in two prior stud-ies [30,31]. Zahar et al’s assessed the morbidity and mor-tality attributable to ICU-acquired CDI and estimated that the increase in the ICU stay due to CDI was 8.0 ± 9.3 days, in comparison to the diarrheic population [30]. Dodek et al. also investigated the attributable ICU and hospital length of stay of ICU-acquired CDI and reported that me-dian ICU days following CDI was 7 days (IQR, 3–14 days) [31]. Therefore, an ICU stay of more than 9 days is a clin-ically relevant outcome measure for patients with CDI. In addition, our risk prediction model can better identity pa-tients at high risk of prolonged ICU stay following CDI than can the guidelines.
Notably, we identified BUN-to-SCr ratio and serum glucose as strong predictors of 30-day mortality. A BUN-to-SCr ratio of > 20 indicates dehydration and an early stage of kidney injury, which reasonably reflects the severity for CDI patients. In contrast, one previous study of 184 CDI patients did not find any association between a BUN-to-SCr ratio of ≥20 and severe out-comes (defined as any event of ICU admission, colec-tomy, or death within 30 days) [29]. Moreover, no prior study has found an association between increased base-line glucose level and increased mortality among CDI patients. Our study showed that diabetes at admission was not associated with 30-day mortality, but a serum glucose level of ≥193 mg/dL was (HR = 2.18; 95% CI = 1.17, 4.05). One study including 94 CDI patients identi-fied that diabetes was associated with relapse of CDI (odds ratio [OR] = 2.7; 95% CI = 0.8–9.2) [32]. Another study including 247 CDI patients revealed that diabetes was an independent risk factor for recurrent CDI within 6 months (OR = 3.05; 95% CI = 1.84, 5.03) but that serum glucose level was not (median of 147 mg/dL for recurrent
CDI and 146 mg/dL for nonrecurrent CDI) [33]. Blood glucose can influence the host immune-inflammatory re-sponse, such as macrophages, and affect the community structure of the gut microbiome, such as changing the ra-tio of nontoxigenic to toxigenicC. difficile[34]. Whether a hyperglycemic status in itself or through modification of a patient’s intestinal microbiome facilitates the growth ofC. difficilewarrants further investigation [34]. Both BUN-to-SCr ratio and serum glucose can be clinically modified and can serve as indicators to measure treatment optimization. Future research should clarify whether modifying these pre-dictors can benefit patients with CDI.
Our study has several limitations. First, due to the retrospective design, the screening and diagnosis of CDI were not based on a standardized research protocol and certain variables of interest had missing values. However, we used extensive data—which were electronic medical records from the well-established CMUH–CRDR, expert adjudication of clinical presentation of CDI, and the Na-tional Cause of Death Dataset—, and multiple imput-ation method [21], to compensate for this limitation. Second, not all patients with CDI received molecular typing ofC. difficile, which prevented us from differenti-ating toxigenic versus nontoxigenic strains for all CDI and evaluating the prognostic value of strain virulence. Nonetheless, our proposed risk model provides simple and readily available laboratory markers to triage pa-tients with CDI and lower the action threshold to initiate optimization of fluid status and empirical antibiotic therapy.
Conclusions
Our proposed risk prediction model and scoring system performs more accurately in identifying potentially severe CDI than do existing guidelines. The newly identified clin-ical markers, namely BUN-to-SCr ratio and glucose, are readily available and also increase awareness of clinicians to optimize supportive care in patients with CDI. Future re-search should replicate our study in other populations. The infectious disease community should work toward consen-sus regarding the definition of severity and treatment re-sponse of CDI to support comparability of information and evidence-driven decision making for optimal CDI care.
Supplementary information
Supplementary informationaccompanies this paper athttps://doi.org/10. 1186/s13756-019-0642-z.
Additional file 1.Supplementary method:Clostridium difficiletesting;
Figure S1.Time frames for the definition of covarieates;Table S1.Net reclassification of risk prediction score and the published guidelines.
Abbreviations
Medical University Hospital; CRDR: Clinical Research Data Repository; eGFR: estimated Glomerular filtration rate; ESCMID: The European Society of Clinical Microbiology and Infectious Diseases; HR: Hazard ratio; ICU: Intensive care unit; IQR: Interquartile range; NRI: Net reclassification index; SCr: Serum creatinine; SHEA-IDSA: The Society for Healthcare Epidemiology of America and The Infectious Diseases Society of America; WBC: White blood cell
Acknowledgements
Not applicable.
Authors’contributions
HYC designed the study, coordinated the data preparation, supervised the data analysis, and wrote a major part of this manuscript; HCH and CWC contributed to the data preparation and the data analysis; YCY contributed to the quality check of the database; YCC reviewed the electronic medical records to abstract the data of diarrhea, ICU status, and APACHE II score; NT and HSL provided the data ofC. difficileculture and toxin tests and the clinical microbiology information; MWH contributed to the study design and critically edited the manuscript; CCK supervised the whole study and critically edited the manuscript. All authors read and approved the final manuscript.
Funding
None of the authors received any funding to conduct this study.
Availability of data and materials
The minimal datasets generated and/or analysed during the current study are available from the corresponding author on reasonable request.
Ethics approval and consent to participate
The Institutional Review Board of CMUH approved this study (105-REC3–068 & 107-REC2–016) and the need for informed consents was waived.
Consent for publication
Not applicable.
Competing interests
The authors declare that they have no competing interests.
Author details
1Big Data Center, China Medical University Hospital, Taichung 404, Taiwan. 2
Department of Medical Research, Department of Internal Medicine, China Medical University Hospital, Taichung 404, Taiwan.3Department of
Laboratory Medicine, China Medical University Hospital, Taichung 404, Taiwan.4Division of Infectious Diseases, Department of Internal Medicine,
China Medical University Hospital, Taichung 404, Taiwan.5Kidney Institute and Division of Nephrology, Department of Internal Medicine, China Medical University Hospital, Taichung 404, Taiwan.
Received: 9 May 2019 Accepted: 1 November 2019
References
1. McDonald LC, Owings M, Jernigan DB. Clostridium difficile infection in patients discharged from US short-stay hospitals, 1996-2003. Emerg Infect Dis. 2006;12(3):409–15.
2. Evans CT, Safdar N. Current trends in the epidemiology and outcomes of Clostridium difficile infection. Clin Infect Dis. 2015;60(Suppl 2):S66–71. 3. Centers for Disease Control and Prevention. Antibiotic Resistance Threats in
the United States, 2013 2013 [Available from:https://www.cdc.gov/ drugresistance/threat-report-2013/index.html.
4. Crowell KT, Julian KG, Katzman M, Berg AS, Tinsley A, Williams ED, et al. Compliance with Clostridium difficile treatment guidelines: effect on patient outcomes. Epidemiol Infect. 2017;145(11):2185–92.
5. Patel I, Wungjiranirun M, Theethira T, Villafuerte-Galvez J, Castillo N, Akbari M, et al. Lack of adherence to SHEA-IDSA treatment guidelines for Clostridium difficile infection is associated with increased mortality. J Antimicrob Chemother. 2017;72(2):574–81.
6. Cohen SH, Gerding DN, Johnson S, Kelly CP, Loo VG, McDonald LC, et al. Clinical practice guidelines for Clostridium difficile infection in adults: 2010 update by the society for healthcare epidemiology of America (SHEA) and
the infectious diseases society of America (IDSA). Infect Control Hosp Epidemiol. 2010;31(5):431–55.
7. McDonald LC, Gerding DN, Johnson S, Bakken JS, Carroll KC, Coffin SE, et al. Clinical practice guidelines for Clostridium difficile infection in adults and children: 2017 update by the Infectious Diseases Society of America (IDSA) and Society for Healthcare Epidemiology of America (SHEA). Clin Infect Dis. 2018;66(7):987–94. 8. Debast SB, Bauer MP, Kuijper EJ. European Society of Clinical M, Infectious
D. European Society of Clinical Microbiology and Infectious Diseases: update of the treatment guidance document forClostridium difficile
infection. Clin Microbiol Infect. 2014;20(Suppl 2):1–26.
9. Stevens VJ, Jones M, Nelson RE, Khader K, Samore M, Rubin M. 489. Validation of the SHEA/IDSA Severity Criteria to Predict Poor Outcomes Among Inpatients and Outpatients WithClostridium difficileInfection. Open Forum Infect Dis. 2018;5(Suppl 1):S181.
10. Welfare MR, Lalayiannis LC, Martin KE, Corbett S, Marshall B, Sarma JB. Co-morbidities as predictors of mortality in Clostridium difficile infection and derivation of the ARC predictive score. J Hosp Infect. 2011;79(4):359–63. 11. Lungulescu OA, Cao W, Gatskevich E, Tlhabano L, Stratidis JG. CSI: a severity
index for Clostridium difficile infection at the time of admission. J Hosp Infect. 2011;79(2):151–4.
12. Bhangu S, Bhangu A, Nightingale P, Michael A. Mortality and risk stratification in patients with Clostridium difficile-associated diarrhoea. Color Dis. 2010;12(3):241–6.
13. Zilberberg MD, Shorr AF, Micek ST, Doherty JA, Kollef MH. Clostridium difficile-associated disease and mortality among the elderly critically ill. Crit Care Med. 2009;37(9):2583–9.
14. Velazquez-Gomez IR-R, Rocha-Rodriguez R, Toro DH, Gutierrez-Nunez JJ, Gonzalez G, Saavedra S. A severity score index for Clostridium difficile infection. Infect Dis Clin Pract. 2008;16(6):376–8.
15. Miller MA, Louie T, Mullane K, Weiss K, Lentnek A, Golan Y, et al. Derivation and validation of a simple clinical bedside score (ATLAS) for Clostridium difficile infection which predicts response to therapy. BMC Infect Dis. 2013;13:148. 16. Hu MY, Katchar K, Kyne L, Maroo S, Tummala S, Dreisbach V, et al. Prospective
derivation and validation of a clinical prediction rule for recurrent Clostridium difficile infection. Gastroenterology. 2009;136(4):1206–14.
17. Abou Chakra CN, Pepin J, Valiquette L. Prediction tools for unfavourable outcomes in Clostridium difficile infection: a systematic review. PLoS One. 2012;7(1):e30258.
18. Gujja D, Friedenberg FK. Predictors of serious complications due to Clostridium difficile infection. Aliment Pharmacol Ther. 2009;29(6):635–42. 19. Bauer MP, Hensgens MP, Miller MA, Gerding DN, Wilcox MH, Dale AP, et al.
Renal failure and leukocytosis are predictors of a complicated course of Clostridium difficile infection if measured on day of diagnosis. Clin Infect Dis. 2012;55(Suppl 2):S149–53.
20. Levey AS, Stevens LA, Schmid CH, Zhang YL, Castro AF 3rd, Feldman HI, et al. A new equation to estimate glomerular filtration rate. Ann Intern Med. 2009;150(9):604–12.
21. Sterne JA, White IR, Carlin JB, Spratt M, Royston P, Kenward MG, et al. Multiple imputation for missing data in epidemiological and clinical research: potential and pitfalls. BMJ. 2009;338:b2393.
22. Harrell FE. The PHGLM procedure. In SUGI supplemental library guide, version 5 edition. Cary, NC: SAS Institute Inc; 1986.
23. Mehta HB, Mehta V, Girman CJ, Adhikari D, Johnson ML. Regression coefficient-based scoring system should be used to assign weights to the risk index. J Clin Epidemiol. 2016;79:22–8.
24. Alba AC, Agoritsas T, Walsh M, Hanna S, Iorio A, Devereaux PJ, et al. Discrimination and calibration of clinical prediction models: Users' guides to the medical literature. JAMA. 2017;318(14):1377–84.
25. Borren NZ, Ghadermarzi S, Hutfless S, Ananthakrishnan AN. The emergence of Clostridium difficile infection in Asia: a systematic review and meta-analysis of incidence and impact. PLoS One. 2017;12(5):e0176797. 26. Zar FA, Bakkanagari SR, Moorthi KM, Davis MB. A comparison of
vancomycin and metronidazole for the treatment of Clostridium difficile-associated diarrhea, stratified by disease severity. Clin Infect Dis. 2007;45(3):302–7.
27. Gomez-Simmonds A, Kubin CJ, Furuya EY. Comparison of 3 severity criteria for Clostridium difficile infection. Infect Control Hosp Epidemiol. 2014;35(2):196–9. 28. Hernandez-Garcia R, Garza-Gonzalez E, Miller M, Arteaga-Muller G. Galvan-de
29. Fujitani S, George WL, Murthy AR. Comparison of clinical severity score indices for Clostridium difficile infection. Infect Control Hosp Epidemiol. 2011;32(3):220–8.
30. Zahar JR, Schwebel C, Adrie C, Garrouste-Orgeas M, Francais A, Vesin A, et al. Outcome of ICU patients with Clostridium difficile infection. Crit Care. 2012;16(6):R215.
31. Dodek PM, Norena M, Ayas NT, Romney M, Wong H. Length of stay and mortality due to Clostridium difficile infection acquired in the intensive care unit. J Crit Care. 2013;28(4):335–40.
32. Dial S, Alrasadi K, Manoukian C, Huang A, Menzies D. Risk of Clostridium difficile diarrhea among hospital inpatients prescribed proton pump inhibitors: cohort and case-control studies. CMAJ. 2004;171(1):33–8. 33. Shakov R, Salazar RS, Kagunye SK, Baddoura WJ, DeBari VA. Diabetes mellitus
as a risk factor for recurrence of Clostridium difficile infection in the acute care hospital setting. Am J Infect Control. 2011;39(3):194–8.
34. Qu HQ, Jiang ZD. Clostridium difficile infection in diabetes. Diabetes Res Clin Pract. 2014;105(3):285–94.
Publisher’s Note