R E S E A R C H A R T I C L E
Open Access
Drastic effect of shearing on graphite
microtexture: attention and application to
Earth science
Yui Kouketsu
1*, Akira Miyake
2, Yohei Igami
2,3, Tomoki Taguchi
2, Hiroyuki Kagi
4and Masaki Enami
5Abstract
The microtexture of graphite exposed on the polished surface was studied using confocal laser scanning microscopy, laser Raman spectroscopy, and focused ion beam–transmission electron microscopy (FIB–TEM) to elucidate the effect on surface condition and crystallinity of graphite by polishing process. The polished surface of the graphite was divided into a flat part with no irregularities and a grooved band with a width of < 1μm and a depth of < 100 nm. Raman analyses revealed that the original structure of the graphite covered by the host mineral was a well-ordered graphite, whereas the polished graphite at the surface had a reduced crystallinity, particularly in the flat part of the sample. Based on scanning TEM observations of an ultra-thin FIB section, fractures that developed during sample preparation were concentrated in the region extending from the surface to a depth of 1μm. Furthermore, graphite sheets were peeled away by shearing, with scraped graphite sheets filling in the gap. Our results demonstrate that the original microtexture of graphite was easily deformed by shearing during polishing, and careful attention should be paid to sample preparation. In addition, we also need to pay more attention to the effects of natural shearing such as faulting on the graphite or sheet-like minerals.
Keywords:Graphite, Shearing, Microtexture, Confocal laser scanning microscope, Raman spectroscopy, FIB–TEM, Fault rock, Sheet-like mineral
Introduction
Carbon is a widely distributed element on the Earth, oc-curring from the upper atmosphere to the deep interior of the Earth. One of the forms of carbon present in rocks is carbonaceous material (CM), which is ubiquitous within sedimentary and metasedimentary rocks. Carbon has been increasingly used in Earth sciences since the Raman CM geothermometer for regional metamorphic rocks was pro-posed by Beyssac et al. (2002). More recent studies have extended the applicable range of Raman CM geotherm-ometers to contact and low-grade metamorphic rocks including diagenetic sedimentary rocks, covering a temperature range from ~ 150 to 650 °C (e.g., Aoya et al.
2010; Lahfid et al.2010; Kouketsu et al.2014; Mori et al.
2017). In addition, Raman spectroscopy is increasingly be-ing applied to studies of CM in meteorites and fault rocks
(e.g., Busemann et al.2007; Muirhead et al.2012; Furuichi et al. 2015; Hirono et al. 2015; Homma et al. 2015). Be-cause structure of CM reflects the heat effect, several studies have succeeded in quantitative determination of the petrologic types of chondrites (Quirico et al. 2003; Bonal et al. 2006). Also utilizing these properties, Buse-mann et al. (2007) and Homma et al. (2015) proposed the thermometer for meteorites. Several studies successfully detected the shear heating recorded in the CM of the fault rocks and discussed the properties of earthquake slips such as displacement rate and coefficient of friction (Mori et al.2015; Hirono et al.2015). On the other hand, Naka-mura et al. (2015) and Kouketsu et al. (2017) reported the mechanical damage on CM in the fault rocks, and they pointed out that not only the evolution of CM crystallinity by shear heating but also the destruction of crystal struc-ture by shearing should be taken into consideration in the fault rocks.
CM exposed on the surface of samples had been dam-aged by polishing, resulting in a decrease in the crystallinity
* Correspondence:[email protected]
1Graduate School of Environmental Studies, Nagoya University, Furo-cho, Chikusa-ku, Nagoya 464-8602, Japan
Full list of author information is available at the end of the article
of CM, which adversely affects the accuracy of temperature estimates (Beyssac et al. 2003; Kirilova et al. 2018). How-ever, the large grained CM in several samples is easy to be exposed on the surface of a thin section and it is difficult to find CM that is completely buried within the host min-erals. Alternatively, there are some studies carrying out the Raman spectroscopic analysis on polished CM that has been separated by acid treatment and embedded in resin (Lünsdorf2016). In such cases, it is necessary to consider the effect on the CM of polishing during sample prepar-ation, which is poorly understood.
In this study, we examined graphite exposed on the surface of a thin section during sample preparation by using confocal laser scanning microscopy (CLSM), laser Raman spectroscopy, and focused ion beam– transmis-sion electron microscopy (FIB–TEM), to investigate the effects of shearing by polishing on graphite microtex-ture. Using these data, we detail the risks of applying the Raman CM geothermometer to exposed CM and con-sider the effect of shearing of CM by faulting, which is of the same mechanism as how it operates during pol-ishing. We also consider the effect of shearing on other sheet-like minerals.
Sample
We used a graphite grain in sample S26 that was col-lected from granulite facies region of Mogok meta-morphic belt, Myanmar, which is located along the western margin of the Shan-Tai block. The sample S26 is a garnet–biotite–sillimanite gneiss, and its petrological and mineralogical characteristics were documented by Maw Maw Win et al. (2017). It is composed mainly of garnet, biotite, plagioclase, quartz, and sillimanite, with minor graphite, rutile, ilmenite, apatite, monazite, and zircon. The temperature conditions at peak meta-morphic stage estimated by garnet–biotite geotherm-ometer (Bhattacharya et al. 1992; Holdaway 2000) and Zr-in-rutile geothermometer (Tomkins et al.2007) were in excess of 800 °C (Maw Maw Win et al.2016,2017).
Analytical methods
The rock sample was cut with a diamond-tipped saw and cut out of ~ 4 cm length and 2.5 cm width shape. The one side of the rock chip was polished using a grinder with diamond discs of 20 cm diameter (#120, #220, #600, #1200, and #2000). The rotational speed was set to 100 rpm, and each polishing was kept at 3 min. The chip was attached to the stainless holder, whose weight is 455 g, with a double-sided tape. The polished rock chip was stuck to the slide glass using petropoxy and cut with a diamond-tipped saw. The thin section (~ 30μm thickness) was polished by hand using silicon car-bide and aluminum oxide (#120, #400, #600, #1200, and #3000); a final polishing step used 1μm followed by
0.25μm diamond pastes. Changes in the degree of crystallinity of graphite at each polishing step were eval-uated by Raman spectroscopy using the chip sample. The thin section was analyzed by CLSM, Raman spec-trometry to check the surface form and crystallinity of the graphite. After these analyses, an ultra-thin section was cut out using FIB and then the cross section of the graphite was observed using TEM. Following these ana-lyses, chemo-mechanical polishing of the sample using colloidal silica was also carried out for 30 h, after which the crystallinity of graphite was examined by Raman spectroscopic analysis.
The surface morphology was observed using a CLSM (LEXT OSL3100; Olympus, Tokyo, Japan) at the Geo-chemical Research Center at the University of Tokyo, Tokyo, Japan. In the confocal mode, an image is gener-ated from the reflection of light on the focal plane where the light is the most intense. The source of the light is a laser diode emitting a light beam with a wavelength (λ) of 408 nm. The spatial resolution is 120 nm in the XY direction and 70 nm in the Z direction (Kaplonek and Nadolny2012).
R1¼ðD1=GÞIntensity ð1Þ
R2¼D1=ðGþD1þD2ÞArea ð2Þ
The values of R1 and R2 become smaller with increas-ing graphite crystallinity. The value of R1 correlates with the crystal size of lateral extent of carbon sheet (Tuinstra and Koenig 1970; Ferrari and Robertson 2000). The upper limit of the temperature determined from R2 for graphite in regional metamorphic rocks is 650 °C, at which temperature the D-bands disappear and only the G-band remains.
Following the CLSM and Raman spectroscopic mea-surements, an ultra-thin section of the sample was made using the FIB system (Helios NanoLab G3 CX, Thermo Fisher Scientific) at Kyoto University, Kyoto, Japan. A predefined area (~ 30μm2) was coated with platinum (Pt) and the surroundings cut to a depth of ~ 10–15μm using a gallium (Ga) ion beam. The resulting foil was picked up using a tungsten (W) probe and mounted on a TEM grid. The extracted samples were thinned to 100–300 nm using a Ga ion beam employing a voltage of 30 kV and beam currents ranging from 0.1 to 3 nA and then using a voltage of 5 kV and a beam current of 16 pA for the final processing. The sample was studied using a TEM equipped with an energy-dispersive spec-troscopy (EDS) system operating at 200 kV at Kyoto Uni-versity (JEM-2100F, JEOL) and Nagoya UniUni-versity (JEM-2100 with a Dry SD60GV detector, JEOL). TEM images were captured using a CCD camera (Orius200D or ES500W Erlangshen, Gatan).
Results
Morphology of polished graphite
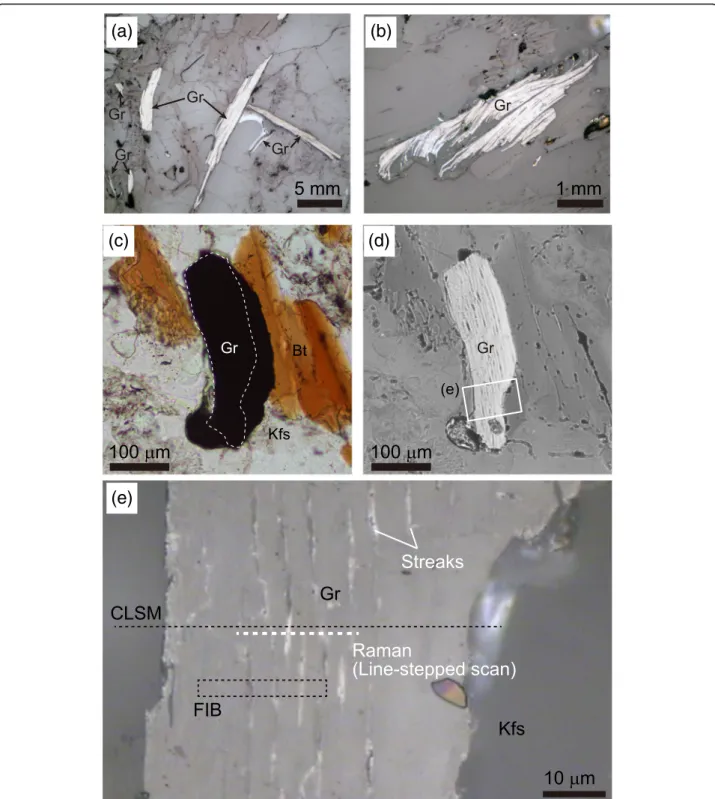
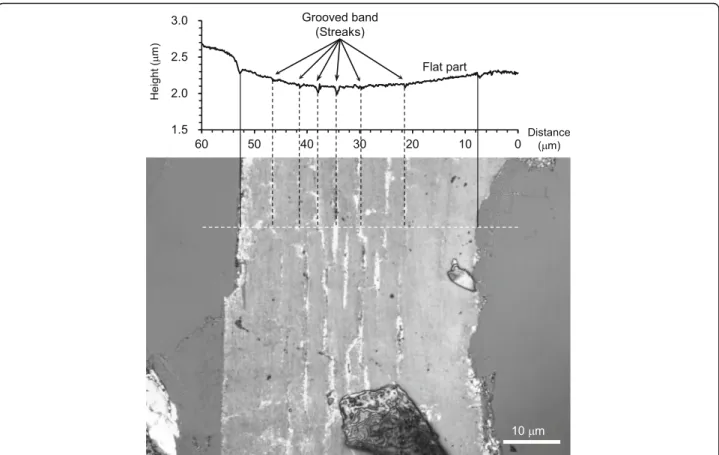
The graphite grains show elongated shape with lengths up to several millimeters (Fig.1). Due to their large grain size, almost all graphite grains are exposed on the sur-face of the thin section. Several graphite grains exposed on the surface shows unidirectional streaks parallel to the elongate direction of the graphite under a reflection microscope (Fig. 1a, b, d). CLMS analysis revealed that the surface morphology of the streak part corresponds to the groove shape (Fig. 2). The width of the groove was 1μm or less, and the maximum depth was 100 nm or less. The other part shows a flat shape without re-markable irregularities. In the following description, we subdivide the graphite surface into the grooved band and the flat part.
Crystallinity degree of graphite
Change of the graphite crystallinity by each polishing step
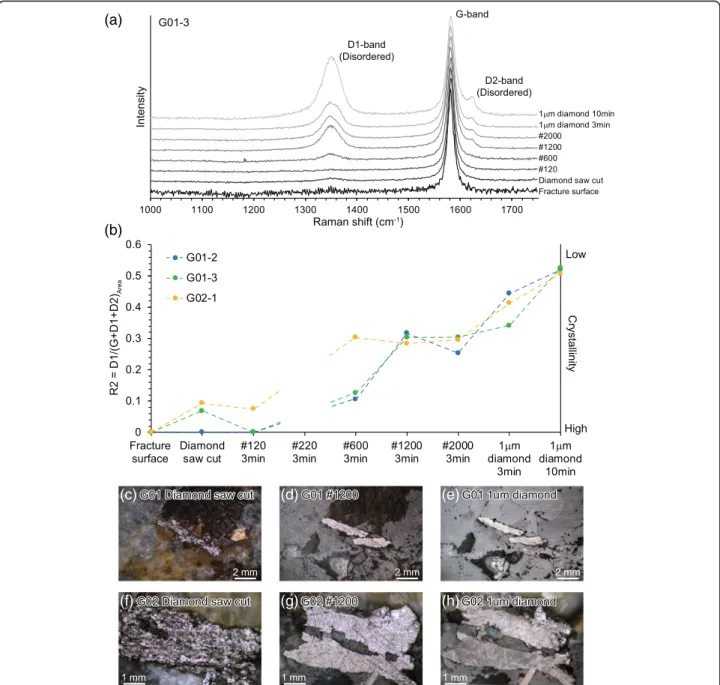
We evaluated the change of crystallinity of graphite in a rock chip at each polishing step by Raman spectroscopy. The crystallinity of the fracture surface of the graphite
exposed on the rock specimen was that of a well-ordered graphite in which only the G-band was observed without any D-bands (Fig.3a). D1-band was slightly observed at some points after cutting by a diamond-tipped saw, and the degree of crystallinity is decreased (Fig.3b). The sur-face form is rugged and mussed under the reflection microscope (Fig. 3c, f ). After the #120 polishing, the crystallinity once recovers but thereafter lowers as a whole although a slight recovery is observed in some steps (Fig. 3b). The surface form becomes nearly flat after the #1200 polishing (Fig. 3d, g). After grinding by 1μm diamond paste for 10 min, streaks began to be seen under the reflection microscope (Fig.3h).
Relation of the surface morphology and crystallinity
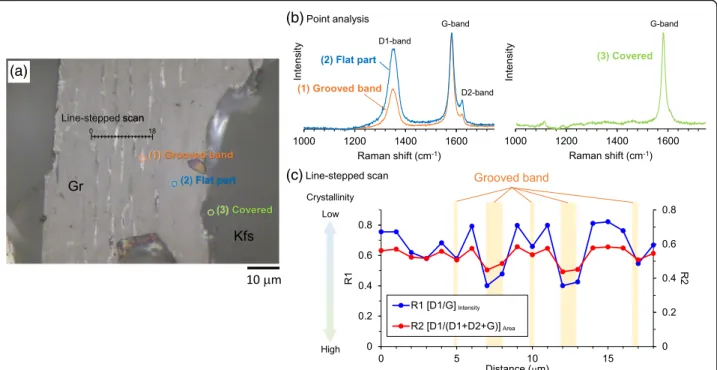
The Raman spectra of both grooved band and the flat part show G-, D1-, and D2-bands (Fig.4b). The intensity of the D-bands in the flat part was stronger than that in the grooved band, suggesting that the crystallinity in the flat part was lower than that in the grooved band (Tuin-stra and Koenig 1970; Ferrari and Robertson2000). For comparison, we measured the graphite grain that was buried within the host K-feldspar, for which only the G-band was observed (Fig.4c). Step scan measurements of 1μm interval across the boundary between the grooved band and the flat part show that the R1 and R2 values are lower in the grooved bands (0.4–0.6 and 0.4– 0.5, respectively) than in flat parts on both sides (0.6–0.8 and 0.5–0.6, respectively; Fig.4d). The R1 and R2 values of the grooved band are correlated to its width and lower in a wider grooved band. Additional chemo-mech-anical polishing using colloidal silica causes little change in the crystallinity in the flat part. On the other hand, the increases of R1 and R2 values in the grooved part suggest reduction of the crystallinity of the graphite (Fig.5).
Microtexture of polished graphite
(a)
(b)
(c)
(d)
(e)
Fig. 1Photomicrograph of the analyzed graphite.a,bGraphite grains under reflected light.cStudied graphite grain under transmitted light. The area exposed on the surface of graphite is surrounded by a white dotted line. Minerals surrounding the graphite are biotite and K-feldspar.d
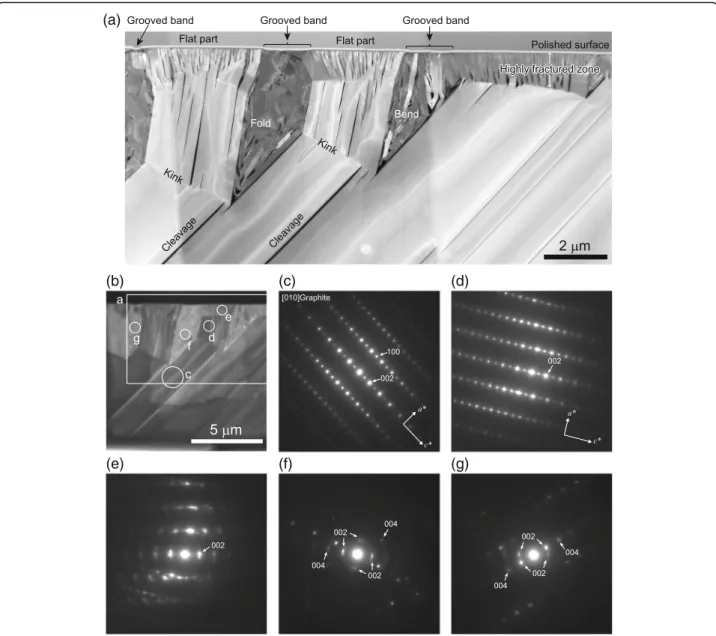
Selected area electron diffraction (SAED) analysis of the bottom part of the sample, 5μm below the surface of the flat part, shows a clear diffraction pattern and could index as graphite along the [010] zone axes (Fig. 6c). The clear spots indicate that the crystal struc-ture of graphite is well ordered. The SAED pattern in the 1.5μm below the surface of the flat part also shows clear diffraction patterns, but streaking of the diffraction spots and weak superlattice reflections along thec* dir-ection are observed, suggesting sheet-stacking errors (stacking fault; Fig.6d). In the highly fractured zone be-neath the flat part, the SAED pattern is unclear (Fig.6e), implying grain size reduction and/or disordering of crys-tal. Beneath the grooved band, the orientation of graph-ite sheets varies, although in many case the 00l spots can be identified (Fig.6f, g).
Discussions
Changes in graphite crystallinity during sample preparation
The change of Raman spectra and its R2 values indicate that the crystallinity of graphite is easily decreased at each sample preparation step from cutting by the diamond-tipped saw to polishing with fine-grained dia-mond pastes. The reflection microscopic image of the surface condition of graphite after cutting with the
diamond-tipped saw is messy, and the crystal structure may have been affected by the violent deformation with the blade rotating at a high speed. On the other hand, the crystallinity was once recovered in #120 polish step, and the surface subjected to a destructive deformation was likely removed by rough polishing. However, the subsequent polishes tend to degrade the crystallinity, and the crystal structure is disturbed by polishing with diamond or colloidal silica finally. Looking at the graph-ite cross section of the STEM image, cracks of various lengths were observed from ~ 1μm length at highly frac-ture zones to > ~ 10μm cleavage continuing to the bot-tom of the ultra-thin section. These cracks in the graphite would occur at each cutting and polishing step corresponding to the grain size of abrasive powders.
Chemo-mechanical polishing with colloidal silica re-sulted in little change to the crystallinity of the graphite in the flat part (Fig. 5). This is because the fractures reached a depth of ~ 1μm and could not be erased by the several nanometers of polishing that results from this chemo-mechanical process. Furthermore, as the crystallinity of graphite was reduced in the grooved band by the colloidal silica polishing, it is possible that vibra-tions due to chemo-mechanical polishing induced fur-ther fractures to form in the graphite sheet.
Modification process of graphite microtexture
STEM observation revealed that the damage on the crystal surface of the flat part by polishing process continues to a depth of ~ 1μm forming a highly frac-tured zone. Sheet-like graphite structure continues to a depth of more than 6μm beneath the flat part. The cleavages in graphite sheets under the flat part are de-veloped along the (001) plane, and graphite sheets are readily peeled away from that plane. Bending or folding
of graphite sheets were observed beneath the grooved band continued to a depth of ~ 5μm. This complicated microtexture is considered to be formed by the sample preparation process, not the original structure of graphite.
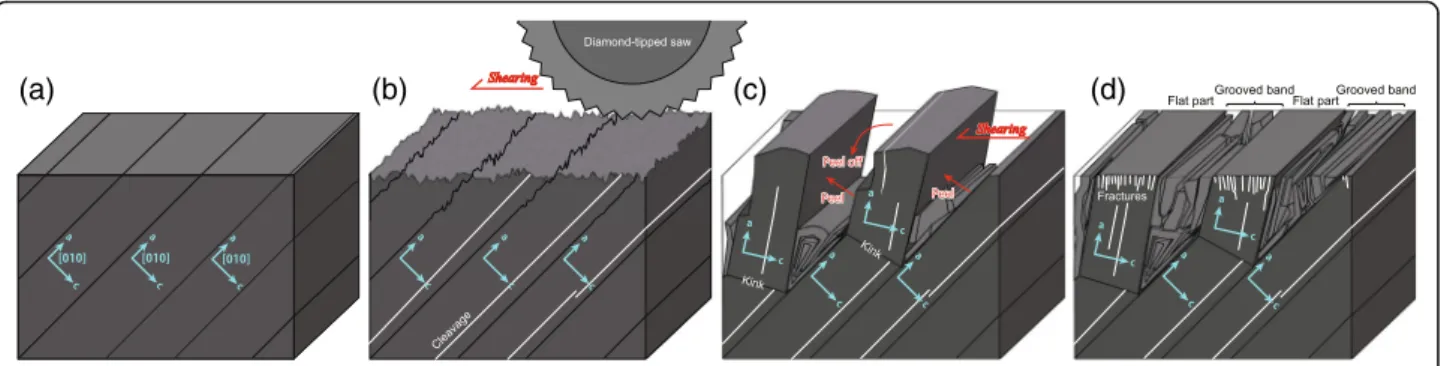
Based on the idea that the cleavages and fractures occur at each sample preparation step corresponding to the grain size of abrasive powders, Fig.6a is considered to have been formed in the following steps.
(a)
(b)
(c) (d) (e)
(f) (g) (h)
(a)
(b)
(c)
Fig. 4Raman spectroscopic analysis of graphite.aReflected light image of graphite showing the locations of point analyses and the line-stepped scans.bRaman spectra of point analyses of graphite for (1) the grooved band, (2) the flat part, and (3) the covered part.cLine-stepped scan of the graphite surface. The blue data indicate the value of R1 and the red data indicate the R2 values. The yellow shading indicates the locations of grooved bands
(1) Well-ordered graphite was crystallized within the rock under the high-temperature metamorphic con-dition (Fig.7a).
(2) The surface is disturbed after cutting by diamond-tipped saw. Cleavages developed within the graphite sheets (Fig.7b).
(3) The sheets of ordered graphite are peeled in the weakest direction due to shearing during
polishing. As a result, gaps are generated between the peeled graphite sheets, and kinks are also developed. The peeled-off graphite sheets fill the gap. (Fig. 7c).
(4) The peeled-off graphite sheets continued to fill the gap. The fractures under the flat part develop further polishing by finer grained abrasive pow-ders (Fig. 7d).
In the analyzed sample, S26 was recrystallized under the granulite facies condition of temperature over 800 °C (Maw Maw Win et al. 2016, 2017), and the Raman spectrum of the graphite before sample preparation or covered by host mineral (K-feldspar) shows only a G-band but no D-bands (Figs.3a and4b). These data in-dicate that the original structure of the graphite grain (a)
(b) (c) (d)
(e) (f) (g)
was a well-ordered crystal. Although the crystallographic axes of the graphite are rotated by shear in the flat part, the a- and c-axes rotated within the same plane. This means that the graphite sheet is easiest to peel when shearing is applied in a direction closest to the c-axis direction on the surface of the thin section. On the other hand, in the grooved band, thec-axis maintains the same in-plane direction, while the a-axis has a variable orien-tation (Fig.6f, g). Since the peeled-off graphite sheet also has a sheeted structure, the plane of the peeled graphite filling the gap may be easiest to fit along the gap plane that is sub-parallel to the original graphite plane.
The TEM and SAED analyses reveal that kink induces slip of graphite sheets and the formation of stacking faults. At the same time, defects within the graphite sheet are formed at the kink. Thus, the concentration of stacking defects increases notably above the large kink, but in-sheet ordering was almost unchanged except at the kink. In contrast, the highly fractured zone can be interpreted as a high concentration of very small kinks. Thus, in addition to the stacking faults, the in-sheet de-fects that affect the increase in D-band intensity of the Raman spectra are expected to be abundant in this zone. Analysis by CLMS and Raman spectroscopy revealed that the crystallinity of the surface in the flat part was lowest and most strongly influenced by polishing during sample preparation. In contrast, the crystallinity of the grooved band was not as intensely disturbed as the flat part. This probably means that the grooved band was less affected by the shearing during polishing because of its concave shape.
Implications
Effect of shearing on graphite for Raman CM geothermometry
Beyssac et al. (2003) reported that the R2 parameter of graphite on polished surfaces is larger than that of bur-ied graphite, especially for high-ordered graphite, and
advised not to use exposed graphite grains for Raman CM geothermometry. In this study, we also have confirmed that the crystallinity of graphite decreases with polishing. Since the Raman spectra of graphite covered by a host mineral show only a G-band (Fig.4b), R2 is zero and the temperature is calculated to be > 650 ° C, whereas an R2 value of 0.5–0.6 in the flat part corresponds to temperatures of ~ 400 °C and an R2 of 0.4–0.5 in the grooved band reflects temperatures of ~ 450 °C based on the Raman CM geothermometer of Aoya et al. (2010). Based on these results, the estimated temperature of CM exposed on the surface by polishing is not reliable. To eliminate such uncertainties when ap-plying the Raman CM geothermometer, it is necessary to carefully judge whether the graphite is buried within the host mineral by using reflected light microscopy.
Effect of shearing on graphite in fault rocks
Recent studies have tried to extract information on fault movement during earthquakes using CM grains (e.g., Kaneki and Hirono 2018). Since graphite has a very low shear strength, it is likely that the microtexture of graph-ite is readily modified by shearing associated with fault-ing. For example, Nakamura et al. (2015) reported the shear-induced amorphization of graphite in a fault zone in the Hidaka metamorphic belt. This evidence indicates shearing-related damage to graphite during fault move-ment. Kouketsu et al. (2017) also reported the signal of mechanical destruction of low-grade CM at Longmen-shan thrust belt. On the other hand, Kaneki et al. (2018) reported the enhancement of organochemical reaction related to the aromatization of low-grade CM by the physical damage caused by shearing. In that case, the maturation of low-grade CM (coalification) is promoted by shearing. Several studies reported the shear-induced graphitization of amorphous carbon at high-velocity ex-periments (1–3 m/s) at high normal stress (2–25 MPa)
(a) (b) (c) (d)
and pointed out the dynamic weakening of fault motion at a carbon-rich fault (Oohashi et al. 2011; Kuo et al. 2014).
In our sample preparation condition, the rotation vel-ocity and normal stress is roughly calculated as 1 m/s and ~ 5 kPa. This condition is comparable to fast slip and very shallow (almost surface) faulting conditions. Some previ-ous studies pointed out that the maturation of CM pro-gress by shearing in some cases under the high normal stress condition. However, the degree of graphite crystal-linity is lowered due to seismic shear at a high speed and close to the surface condition as in this study. We have to take into account that the deformation mechanism of graphite may change depending on the shearing condition such as normal stress and slip rate.
Effect of shearing on minerals
It has also been suggested that other sheet-like minerals, in addition to graphite, are deformed by polishing. Inoue and Kogure (2012) reported that crystals of phyllosili-cates, muscovite, and chlorite are also bent by polishing process (to colloidal silica finally) and did not show sharp EBSD patterns. They carried out the ion milling (ion beam edging) and obtained sharp EBSD patterns with no crystal bending. In addition to muscovite and chlorite, the EBSD patterns of low-temperature serpen-tine such as lizardite and chrysotile have not been re-ported yet (c.f. Boudier et al. 2010; Bandli and Gunter 2013). One reason for the lack of EBSD pattern of low-temperature serpentine is discussed that the EBSD pattern would not be produced in the scrolled structure of the silicate sheets in chrysotile (Bandli and Gunter 2013). On the other hand, the other reason is presumed to be the effect of damage by mechanical polishing as with the graphite of this study.
The original structure of graphite was artificially chan-ged during conventional polishing, and even during chemo-mechanical polishing using colloidal silica. To ex-pose surfaces of graphite retaining their original microtex-ture, it is necessary to improve the polishing method, for example, by using a different technique such as ion milling (e.g., Sasaki et al.2004; Inoue and Kogure2012).
Conclusions
We analyzed graphite exposed on the surface of a sam-ple by polishing using CLSM, laser Raman spectroscopy, and FIB–TEM measurements. The following results were obtained.
(1) CLSM measurement revealed that the polished graphite surface can be divided into a flat part and a grooved band (Fig.2). The flat part is a flat plane without any noticeable irregularities, whereas the
grooved band has a shape with a width of < 1μm and a depth of < 100 nm.
(2) In Raman spectroscopic analysis, both the flat and grooved bands show D-bands in addition to a G-band, whereas the graphite covered by the host mineral shows only a G-band (Fig.4). This demon-strates that the crystallinity of graphite exposed on the surface was decreased by polishing. In particu-lar, the D-band intensity in the flat part was stron-ger than that in the grooved band, and the flat part was more strongly affected by shearing than the grooved band.
(3) FIB–TEM measurement revealed that fractures are developed within the graphite sheets that are concentrated in the region from the surface to a depth of ~ 1μm (the highly fractured zone; Fig.6a). Based on the structures observed with STEM and the crystal orientations determined with TEM, we consider that the graphite sheets were peeled by shearing during polishing and that the scarped graphite sheets filled the gap produced between the peeled graphite sheets (Fig.7).
The crystal structure of the graphite was deformed during all stages of sample preparation, from cutting of the sample through the various stages of polishing, in-cluding chemo-mechanical polishing using colloidal sil-ica. These results indicate the need to consider the deformation of graphite microtexture arising from shear-ing, not only during sample preparation but also due to shearing caused by fault movement. In addition, it is ne-cessary to devise a different method of sample prepar-ation to obtain primary informprepar-ation on certain minerals, in particular for sheet minerals similar to graphite.
Additional file
Additional file 1:Figure S1.STEM–EDS mapping data. (a) STEM image of mapped area, (b) EDS spectrum of the entire mapped area. (c) to (f) shows element maps of carbon (C), silicon (Si), aluminum (Al), and oxygen (O), respectively. Only C was detected in the map area, and impurities such as Si, Al, and O were not detected. In the EDS spectrum, small peaks of Si, Fe, and Co peaks are derived from pole piece and/or TEM sample holder, Ga and Pt peaks were derived at the FIB process, and Cu peaks were derived from the sample holder. (PDF 133 kb)
Abbreviations
CLSM:Confocal laser scanning microscope; FIB: Focused ion beam; SAED: Selected area electron diffraction; TEM: Transmitted electron microscope
Acknowledgements
Funding
This work was supported by a Grant-in-Aid for Young Scientists (B) to YK from the Japan Society for the Promotion of Science (16 K17820).
Availability of data and materials
All original data are available from the corresponding author on request.
Authors’contributions
YK and ME proposed the project and conceived and designed the study. YK carried out the Raman spectroscopic analysis. AM, YI, and TT undertook the FIB–TEM analysis and analyzed the data. HK made the CLSM measurements. All authors discussed the results and interpreted the data. All authors read and approved the final manuscript.
Competing interests
The authors declare that they have no competing interests.
Publisher’s Note
Springer Nature remains neutral with regard to jurisdictional claims in published maps and institutional affiliations.
Author details
1Graduate School of Environmental Studies, Nagoya University, Furo-cho, Chikusa-ku, Nagoya 464-8602, Japan.2Department of Geology and Mineralogy, Graduate School of Science, Kyoto University, Kitashirakawa Oiwake-cho, Sakyo-ku, Kyoto 606-8502, Japan.3Advanced Measurement Technology Center, Institute of Materials and Systems for Sustainability, Nagoya University, Furo-cho, Chikusa-ku, Nagoya 464-8603, Japan.
4Geochemical Research Center, Graduate School of Science, The University of Tokyo, Hongo, Bunkyo-ku, Tokyo 113-0033, Japan.5Institute for Space-Earth Environmental Research, Nagoya University, Furo-cho, Chikusa-ku, Nagoya 464-8601, Japan.
Received: 1 October 2018 Accepted: 5 February 2019
References
Aoya M, Kouketsu Y, Endo S, Shimizu H, Mizukami T, Nakamura D, Wallis S (2010) Extending the applicability of the Raman carbonaceous-material
geothermometer using data from contact metamorphic rocks. J Metamorph Geology 28:895–914.https://doi.org/10.1111/j.1525-1314.2010.00896.x Bandli B, Gunter ME (2013) Mineral identification using electron backscatter
diffraction from unpolished specimens: applications for rapid asbestos identification. Microscope 61:37–45
Beyssac O, Goffe B, Chopin C, Rouzaud JN (2002) Raman spectra of carbonaceous material in metasediments; a new geothermometer. J Metamorph Geology 20:858–871
Beyssac O, Goffé B, Petitet J-P, Froigneux E, Moreau M, Rouzaud J-N (2003) On the characterization of disordered and heterogeneous carbonaceous materials by Raman spectroscopy. Spectrochim Acta A 59:2267–2276.https:// doi.org/10.1016/S1386-1425(03)00070-2
Bhattacharya A, Mohanty L, Maji A, Sen SK, Raith M (1992) Non-ideal mixing in the phlogopite-annite binary: constraints from experimental data on Mg−Fe partitioning and a reformulation of the biotite-garnet geothermometer. Contrib Mineral Petr 111:87–93.https://doi.org/10.1007/BF00296580 Bonal L, Quirico E, Bourot-Denise M, Montagnac G (2006) Determination of the
petrologic type of CV3 chondrites by Raman spectroscopy of included organic matter. Geochim Cosmochim Acta 70:1849–1863
Boudier F, Baronnet A, Mainprice D (2010) Serpentine mineral replacements of natural olivine and their seismic implications: oceanic lizardite versus subduction-related antigorite. J Petrol 51:495–512.https://doi.org/10.1093/ petrology/egp049
Busemann H, Alexander MO, Nittler LR (2007) Characterization of insoluble organic matter in primitive meteorites by microRaman spectroscopy. Meteorit Planet Sci 42:1387–1416.https://doi.org/10.1111/j.1945-5100.2007.tb00581.x
Ferrari AC, Robertson J (2000) Interpretation of Raman spectra of disordered and amorphous carbon. Phys Rev B 61:95–107
Furuichi H, Ujiie K, Kouketsu Y, Saito T, Tsutsumi A, Wallis S (2015) Vitrinite reflectance and Raman spectra of carbonaceous material as indicators of frictional heating on faults: constraints from friction experiments. Earth Planet Sci Lett 424:191–200.https://doi.org/10.1016/j.epsl.2015.05.037
Hirono T, Maekawa Y, Yabuta H (2015) Investigation of the records of earthquake slip in carbonaceous materials from the Taiwan Chelungpu fault by means of infrared and Raman spectroscopies. Geochem Geophy Geosy 16:1233–1253. https://doi.org/10.1002/2014GC005622
Holdaway MJ (2000) Application of new experimental and garnet Margules data to the garnet-biotite geothermometer. Am Mineral 85:881–892.https://doi. org/10.2138/am-2000-0701
Homma Y, Kouketsu Y, Kagi H, Mikouchi T, Yabuta H (2015) Raman spectroscopic thermometry of carbonaceous material in chondrites: four–band fitting analysis and expansion of lower temperature limit. J Miner Petrol Sci 110: 276–282.https://doi.org/10.2465/jmps.150713a
Inoue S, Kogure T (2012) Electron backscatter diffraction (EBSD) analyses of phyllosilicates in petrographic thin sections. Am Mineral 97:755–758.https:// doi.org/10.2138/am.2012.4061
Kaneki S, Hirono T (2018) Kinetic effect of heating rate on the thermal maturity of carbonaceous material as an indicator of frictional heat during earthquakes. Earth Planets Space 70:92.https://doi.org/10.1186/s40623-018-0868-7 Kaneki S, Ichiba T, Hirono T (2018) Mechanochemical effect on maturation of
carbonaceous material: implications for thermal maturity as a proxy for temperature in estimation of coseismic slip parameters. Geophy Research Lett 45:2248–2256.https://doi.org/10.1002/2017GL076791
Kaplonek W, Nadolny K (2012) Advanced 3D laser microscopy for measurements and analysis of vitrified bonded abrasive tools. J Eng Sci Technol 7:661–678
Kirilova M, Toy V, Rooney JS, Giorgetti C, Gordon KC, Collettini C et al (2018) Structural disorder of graphite and implications for graphite thermometry. Solid Earth 9:223–231.https://doi.org/10.5194/se-9-223-2018
Kouketsu Y, Mizukami T, Mori H, Endo S, Aoya M, Hara H, Nakamura D, Wallis S (2014) A new approach to develop the Raman carbonaceous material geothermometer for low-grade metamorphism using peak width. Island Arc 23:33–50.https://doi.org/10.1111/iar.12057
Kouketsu Y, Shimizu I, Wang Y, Yao L, Ma S, Shimamoto T (2017) Raman spectra of carbonaceous materials in a fault zone in the Longmenshan thrust belt, China; comparisons with those of sedimentary and metamorphic rocks. Tectonophysics 699:129–145.https://doi.org/10.1016/j.tecto.2017.01.015 Kuo L-W, Li H, Smith SAF, Di Toro G, Suppe J, Song S-R et al (2014) Gouge
graphitization and dynamic fault weakening during the 2008 Mw 7.9 Wenchuan earthquake. Geology 42:47–50.https://doi.org/10.1130/G34862.1 Lahfid A, Beyssac O, Deville E, Negro F, Chopin C, Goffé B (2010) Evolution of the
Raman spectrum of carbonaceous material in low-grade metasediments of the Glarus Alps (Switzerland). Terra Nova 22:354–360.https://doi.org/10.1111/ j.1365-3121.2010.00956.x
Lünsdorf NK (2016) Raman spectroscopy of dispersed vitrinite—methodical aspects and correlation with reflectance. Int J Coal Geol 153:75–86.https:// doi.org/10.1016/j.coal.2015.11.010
Maw Maw Win, Enami M, Kato T (2016) Metamorphic conditions and CHIME monazite ages of Late Eocene to Late Oligocene high-temperature Mogok metamorphic rocks in Central Myanmar. J Asian Earth Sci 117:304–316. https://doi.org/10.1016/j.jseaes.2015.11.023
Maw Maw Win, Enami M, Kato T, Ye Kyaw Thu (2017) A mechanism for Nb incorporation in rutile and application of Zr-in-rutile thermometry: a case study from granulite facies paragneisses of the Mogok metamorphic belt, Myanmar. Mineral Mag 81:1503–1521. https://doi.org/10.1180/minmag.2017.081.014 Mori H, Mori N, Wallis S, Westaway R, Annen C (2017) The importance of heating
duration for Raman CM thermometry: evidence from contact metamorphism around the Great Whin Sill intrusion, UK. J Metamorph Geology 35:165–180. https://doi.org/10.1111/jmg.12225
Mori H, Wallis S, Fujimoto K, Shigematsu N (2015) Recognition of shear heating on a long-lived major fault using Raman carbonaceous material
thermometry: implications for strength and displacement history of the MTL. SW Japan Island Arc 24:425–446 doi:wiley.com/10.1111/iar.12129
Muirhead DK, Parnell J, Taylor C, Bowden SA (2012) A kinetic model for the thermal evolution of sedimentary and meteoritic organic carbon using Raman spectroscopy. J Anal Appl Pyrol 96:153–161.https://doi.org/10.1016/j. jaap.2012.03.017
Nakamura Y, Oohashi K, Toyoshima T, Satish-Kumar M, Akai J (2015) Strain-induced amorphization of graphite in fault zones of the Hidaka metamorphic belt, Hokkaido, Japan. J Struct Geol 72:142–161.https://doi.org/10.1016/j.jsg. 2014.10.012
possible implications for fault mechanics. J Struct Geol 33:1122–1134doi.org/ 10.1016/j.jsg.2011.01.007
Quirico E, Raynal P, Bourot-Denise M (2003) Metamorphic grade of organic matter in six unequilibrated ordinary chondrites. Meteoritics Planet Sc 811: 795–811
Sasaki H, Matsuda T, Kato T, Muroga T, Iijima Y, Saitoh T et al (2004) Specimen preparation for high-resolution transmission electron microscopy using focused ion beam and Ar ion milling. J Electron Microscopy 53:497–500 Tomkins HS, Powell R, Ellis DJ (2007) The pressure dependence of the
zirconium-in-rutile thermometer. J Metamorp Geol 25:703–713.https://doi.org/10.1111/ j.1525-1314.2007.00724.x