R E S E A R C H
Open Access
DNA methylation dynamic of bone marrow
hematopoietic stem cells after allogeneic
transplantation
Stefania Trino
1, Pietro Zoppoli
1, Angelo Michele Carella
2, Ilaria Laurenzana
1, Alessandro Weisz
3, Domenico Memoli
3,
Giovanni Calice
1, Francesco La Rocca
4, Vittorio Simeon
5, Lucia Savino
2, Luigi Del Vecchio
6, Pellegrino Musto
7,
Antonella Caivano
1†and Luciana De Luca
1*†Abstract
Background:Allogeneic hematopoietic stem cell transplantation (AHSCT) is a curative therapeutic approach for different hematological malignancies (HMs), and epigenetic modifications, including DNA methylation, play a role in the reconstitution of the hematopoietic system after AHSCT. This study aimed to explore global DNA methylation dynamic of bone marrow (BM) hematopoietic stem and progenitor cells (HSPCs) from donors and their respective recipients affected by acute myeloid leukemia (AML), acute lymphoid leukemia (ALL) and Hodgkin lymphoma (HL) during the first year after transplant.
Methods:We measured DNA methylation profile by Illumina HumanMethylationEPIC in BM HSPC of 10 donors (t0) and their matched recipients at different time points after AHSCT, at day + 30 (t1), + 60 (t2), + 120 (t3), + 180 (t4), and + 365 (t5). Differential methylation analysis was performed by using R software and CRAN/Bioconductor packages. Gene set enrichment analysis was carried out on promoter area of significantly differentially methylated genes by clusterProfiler package and the mSigDB genes sets.
Results:Results show significant differences in the global methylation profile between HL and acute leukemias, and between patients with mixed and complete chimerism, with a strong methylation change, with prevailing hyper-methylation, occurring 30 days after AHSCT. Functional analysis of promoter methylation changes identified genes involved in hematopoietic cell activation, differentiation, shaping, and movement. This could be a consequence of donor cell“adaptation”in recipient BM niche. Interestingly, this epigenetic remodeling was reversible, since methylation returns similar to that of donor HSPCs after 1 year. Only for a pool of genes, mainly involved in dynamic shaping and trafficking, the DNA methylation changes acquired after 30 days were maintained for up to 1 year post-transplant. Finally, preliminary data suggest that the methylation profile could be used as predictor of relapse in ALL.
Conclusions:Overall, these data provide insights into the DNA methylation changes of HSPCs after transplantation and a new framework to investigate epigenetics of AHSCT and its outcomes.
Keywords:Allogeneic hematopoietic bone marrow stem cell transplantation, Hematopoietic stem and progenitor cells, DNA methylation, CpG sites, Hematological malignancies, Promoter methylation region
© The Author(s). 2019Open AccessThis article is distributed under the terms of the Creative Commons Attribution 4.0 International License (http://creativecommons.org/licenses/by/4.0/), which permits unrestricted use, distribution, and reproduction in any medium, provided you give appropriate credit to the original author(s) and the source, provide a link to the Creative Commons license, and indicate if changes were made. The Creative Commons Public Domain Dedication waiver (http://creativecommons.org/publicdomain/zero/1.0/) applies to the data made available in this article, unless otherwise stated.
* Correspondence:dr.luciana.deluca@gmail.com
†Antonella Caivano and Luciana De Luca contributed equally to this work.
1Laboratory of Preclinical and Translational Research, IRCCS - Referral Cancer
Background
Epigenetic regulation, including DNA methylation, his-tone modification, chromatin remodeling, and noncod-ing RNA regulation, has been reported to regulate gene expression [1,2]. One important hallmark of the epige-nome is its great plasticity in response to internal (i.e., during development and transplant) and environmental factors [3]. In fact, this process is important for normal biological functions like immune cell development and differentiation [4] and for tumor conditions [3].
DNA methylation is a reversible process of attaching methyl residues to cytosines adjacent to guanines (CpGs) [5]. CpGs are distributed throughout the whole genome, including repetitive sequences, enhancers, promoters, and gene body [6]. DNA methylation had deep effects on gene expression by influencing the accessibility of transcription factors to DNA, altering genetic stability and modifying genomic structure [7, 8]. Specifically, the methylation of promoter CpGs is associated with a stable gene silencing, and its dysregulation plays an im-portant role in oncogenesis and tumor progression [9]. On the other hand, the methylation of CpGs in gene body increased gene expression [10]. CpGs are densely clustered in regions called CpG islands in which impact on gene expression is still unclear. Overall, it seems to contribute significantly to global gene expression regula-tion specifically if CpG islands are located in promoter regions [6, 11, 12]. Nowadays, regions with relatively lower CpG density are gaining importance in DNA methylation studies. In fact, methylation status of the majority of CpG islands across a variety of tissues and cell populations is non-dynamic and less variant [13– 15]. It is now proven, on the contrary, that methylation is dynamic along the CpG shores (< 2 kb flanking CpG Islands), CpG shelves (< 2 kb flanking outwards from a CpG shore), and open sea (outside of the CpG island/ shores/shelves context). Recent works, in fact, have shown that DNA methylation of shore and shelf in inter-genic region was associated with increased gene expres-sion [14,16] and a hypo-methylation of open sea with a transcriptional silencing [17].
In normal hematopoiesis and in hematological malig-nancies (HMs), epigenetic modifications [18,19], includ-ing DNA methylation, play an important role in self-renewal of stem cells, in differentiation and in the malignancy pathogenesis [20].
In HMs, bone marrow (BM) transplantation, is an im-portant treatment choice, which allows the restoration of blood cellular components [21]. In particular, the allo-geneic hematopoietic stem cell transplantation (AHSCT) is a curative therapeutic approach for leukemia, lymph-oma, multiple myellymph-oma, and myeloproliferative disease [4,22]. This therapy consists of the intravenous infusion of hematopoietic stem and progenitor cells (HSPCs) to
reestablish marrow function in patients with damaged or defective BM [23]. The sources of HSPCs include human leukocyte antigen (HLA)-matched siblings, matched unre-lated donors, unreunre-lated umbilical cord blood (UCB), and HLA haplotype-mismatched donors (HLA-haploidentical) [24, 25]. After conditioning regimen (myeloablative, re-duced intensity conditioning, or non-myeloablative) [26, 27], HM patients received HSPCs from mobilized periph-eral blood (PB), BM, or UCB of donors.
The process through which transplanted stem cells reach the BM and begin to produce healthy blood cells is called engraftment phase and approximately occurs from 2 to 4 weeks [28,29]. The first sign of engraftment is the gradual rise of both white blood cell and platelet count that begins about 3 weeks after transplant. Red blood cells often take a little longer to begin developing [26]. Another routine diagnostic tool for the assessment of engraftment and early detection of graft failure is the analysis of chimerism in PB cells [30]. A full chimerism is achieved when more than 95% of cells derives from the donor. Instead, mixed chimerism is defined as having 5–95% recipient-derived hematopoietic cells remaining [31]. The epigenetic modifications, such as DNA methy-lation, play a critical role in self-renewal and in differen-tiation of HSPCs [4], but little is known about their changes on hematopoietic cells during transplant. In this context, this study analyzed, for the first time, the DNA methylation dynamic of HSPCs from donors and from HM patients during the time of AHSCT, from 30 days to 1 year, using a genome-wide approach.
Methods Study samples
From March 2013 to March 2015, a total of 10 donors and their respective 10 patients who received BM AHSCT were included in our study and followed up to a maximum of 55 months after transplant. BM samples were provided by the Department of Hematology and Stem Cell Transplantation Unit, IRCCS “Casa Sollievo della Sofferenza” Hospital, San Giovanni Rotondo, Italy. BM samples were sequentially collected from donors (t0) and matched recipients at different time points, at day + 30 (t1), + 60 (t2), + 120 (t3), + 180 (t4), and + 365 (t5). All participants gave written informed consent in accordance with the Declaration of Helsinki. Patient and donor characteristics are shown in Table 1. Peripheral blood was evaluated after transplantation to identify the presence of mixed or full chimerism by the analysis of genomic polymorphisms.
Human CD34+HSPCs isolation
Microbead Kit (Miltenyi Biotec, Auburn, CA). The pur-ity of isolated CD34+ cells, verified by flow cytometry, routinely ranged between 90 and 95%.
Genomic DNA isolation
DNA was extracted from CD34+ cell population by All-Prep DNA/RNA Micro Kit (Qiagen GmbH, Hilden, Germany). DNA quality was controlled by agarose gel electrophoresis and quantified by a NanoDrop ND-1000 Spectrometer (Thermo Scientific, Wilmington, DE, USA).
Bisulfite conversion and array-based DNA methylation
Genomic DNA (250 ng) was treated with sodium bi-sulfite using the Zymo EZ DNA Methylation Kit (Zymo Research, Orange, CA, USA) according to the manufacturer’s procedure, with the alternative incuba-tion condiincuba-tions recommended when using the Illu-mina Infinium Methylation Assay. The methylation assay was performed on 4μl bisulfite-converted gen-omic DNA at 50 ng/μl according to the Infinium HD Methylation Assay protocol (Illumina, CA, USA). The bisulfite-converted genomic DNA was amplified at 37 °C for 22 h, enzymatically fragmented, purified, and hybridized on an Infinium HumanMethlyationEPIC
(850k) BeadChip at 48 °C for 17 h. The BeadChip was then washed to remove any un-hybridized or non-specific hybridized DNA. Labeled single-base ex-tension was performed on primers hybridized with DNA, and the hybridized DNA was removed. The ex-tended primers were stained with multiple layers of fluorescence; the BeadChip was then coated using a proprietary solution and scanned using the Illumina HiScanSQ system (Illumina).
Microarray data analysis
Methylation signals were analyzed as described in Pis-tore et al. [32], and all other statistical analyses were per-formed using R software [33] and CRAN/Bioconductor packages.
The methylation level for each cytosine was expressed as beta value (the ratio of the fluorescence intensity of the methylated to unmethylated versions of the probes) as well asMvalues (log2 ratio of the intensities of meth-ylated probe versus unmethmeth-ylated probe). Although the beta value has a more intuitive biological interpretation, theMvalue is considered more valid statistically [34], so we used this for statistical analysis and the beta value for data description and plotting.
Overlap analysis of methylation EPIC probes with gen-omic features (such as TSS1500, TSS200, 1st Exon, 5′ UTR, Gene body, 3′UTR, and IGR) and with CpG localization (islands, Shores, Shelves, or Open Sea) was determined exploiting the annotation stored in the Illumi-na’s EPIC methylation arrays Bioconductor package [35].
Multdimensional scaling (or principle coordinate ana-lysis) and clustering analysis performed on the methyla-tion level (M value) of the most variable probes. For each sample, we also evaluated the “promoter” and “body”regions’mean methylation level. The methylation profile of CD34 gene was further evaluated.
Differential methylation analysis was performed using limma, minfi, and DMRcate packages [36–38]. Differen-tially methylated probes (DMPs) and differenDifferen-tially meth-ylated regions (DMRs) specifically annotated for gene region and CGI position and their relative distribution (as probes, genes, and regions) were analyzed. Probes and regions with absolute FC (Mvalue) greater than 1.5 (abs (log2(Mvalue) > 0.58)) with adjusted (fdr)pvalue < 0.05 were considered significant.
To better understand stable methylation modifications in the promoter area, we defined genes significantly and concordant differentially methylated in t1 versus t0 and t5 versus t0 as “stable,” while the discordant genes are labeled as “revert.” We also searched for these “stable” genes in t2 vs t0. Significant gene sets (p value < 0.05) were obtained by gene set enrichment analysis (cluster-Profiler package [39] and the mSigDB genes sets [40]).
Table 1Characteristics of patients and donors
Characteristics
Total patients,n 10
Sex, male,n(%) 3 (30%)
Age, mean (range) yr. 34 (17–57)
Diagnosis
AML,n(%) 6 (60%)
ALL,n(%) 3 (30%)
HL,n(%) 1 (10%)
Conditioning regimen
Myeloablative,n(%) 9 (90%)
Reduced Intensity Conditioning,n(%) 1 (10%)
Chimerism
Complete,n(%) 9 (90%)
Mixed,n(%) 1 (10%)
4-years survival,n(%) 8 (80%)
Donor sex, male,n(%) 6 (60%)
Donor sex, female,n(%) 4 (40%)
Donor age, mean (range) 33 (14–52)
Stem cell source (%)
BM,n(%) 10 (100%)
Donor type
Matched sibling,n(%) 4 (40%)
Matched unrelated,n(%) 3 (30%)
Results
Analysis of global DNA methylation profile in both donor and recipient HSPCs
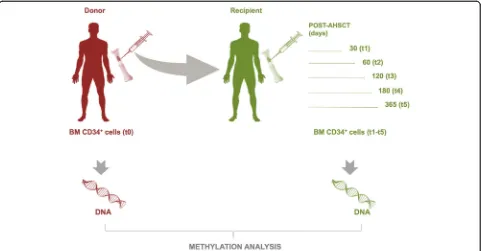
Global methylation profiles were investigated in BM HPSCs purified as CD34+ cells from 10 donors (t0) and 10 respective HM recipients [3 acute lymphoid leukemia (ALL), 6 acute myeloid leukemia (AML), and 1 Hodgkin lymphoma (HL)] in sequential time points [30 (t1), 60 (t2), 120 (t3), 180 (t4), and 365 (t5) days] after AHSCT. A schematic overview of the study design was reported in Fig. 1. We used the Illu-mina Infinium MethylationEPIC (850k) arrays con-taining over 850,000 probes which cover the broad content categories including the following: CpG is-land, North (N) and South (S) shores and shelves, open sea, non CpG methylated sites, FANTOM en-hancers, ENCODE open chromatin and enen-hancers, DNA hypersensitivity sites, and miRNA promoter re-gions. EPIC probes are located at transcription start site (TSS) 1500, TSS 200, 5′ untranslated region (UTR), first exon, gene body, 3′UTR, exon boundar-ies, and intergenic regions.
In order to identify potential confounding factors in methylation data, we performed a multidimensional scaling (MDS) on the probes with the largest standard deviations between samples [36]. As showed in Fig. 2a, MDS segregated in distinct clusters along the principal component 1: (i) male and female, (ii) all time points
after AHSCT of patient 19 (t1-t5 P19) with its donor (t0 P19) and the other HM patients with respective do-nors, and finally (iii) t4 of patient 2 (P2_4) and all time points of HM patients with respective donors. Eliminat-ing those confoundEliminat-ing factors (sex chromosomes, t0 and t1-t5 P19, and P2_4), a uniform distribution of DNA methylation was observed among all samples (Fig.2a, iv).
Unsupervised hierarchical clustering of global methyla-tion profile on the most variably probes showed that t1-t5 of most patients (P1, P4, P6, P9, P11, P16, and P18) profiled into a specific methylation cluster. Moreover, analyzing the donor (t0) distribution, we observed that four donors (P11_t0, P13_t0, P6_t0, and P18_t0) clustered together, other four (P1_t0, P4_t0, P9_t0, and P16_t0) clustered with t1-t5 of respective recipients, and just one (P2_t0) segre-gated separately (Fig.2b). To evaluate the potential global methylation change in donors and patients after AHSCT, we examined global level (Mvalue) in both grouped donors (t0) and HM patients in all time points (t1-t5) discovering a similar median of methylation in all groups with a global hyper-methylation dominance (Fig.2c). Specifically, distin-guishing the genome in promoter (TSS200, TSS1500, 5′ UTR) and body (1st exon, gene bodies, 3′UTR, exon boundaries) regions, we observed that global methylation levels of both regions were similar from t0 to t5 with a low methylation level in promoter region and, conversely, a hyper-methylation in gene body (Fig.2d).
Fig. 1Diagram of experimental design. Analysis of genome-wide DNA methylation was performed on BM CD34+cells of donors (t0) and
Differential methylation analysis between donor and recipient HSPCs
To assess potential methylation changes after AHSCT, we first clustered differentially methylated probes (DMPs) common to all comparisons between donors
recipients (Fig.3a). Moreover, the analysis of DMP num-ber identified a major difference of DMPs (n= 12,043) in t1 vs t0 with a marked reduction in the other compari-sons, reaching 2565 DMPs in t5 vs t0 (Fig. 3b). In par-ticular, we found a prevalent hyper-methylation of DMPs in each time point vs t0 (Fig.3b). Similarly to the DMPs, we reported that the DMR number (containing single or cluster of DMPs) was higher (n= 292) in t1 vs t0 with respect to other comparisons reaching only 47 DMRs in t5 vs t0 (Fig. 3c). Also for DMRs, a major hyper-methylation was found for each time point vs t0 (Fig. 3c). These data indicated that HSPCs were hyper-methylated at 30 days (t1) post-transplant and their methylation is strongly reduced up to 365 days after AHSCT (t2-t5).
To investigate the methylation changes during AHSCT, we analyzed the distribution of DMPs across CpG sites (CpG island, shelves, shores, and open sea) in promoter and body regions between donors (t0) and re-cipients (t1-t5). In particular, CpG island, shelves, shores, and open sea were more hyper- than hypo-methylated in both regions (Fig. 3d). Of note, in
the promoter region, open seas and shores resulted con-sistently more differentially methylated compared to islands and shelves in all comparisons. In the body, in-stead, only open seas were found more differentially methylated with respect to other regions (Fig.3d).
Identification of gene signature of HSPCs after transplant
To validate the methylation array data, we analyzed the global methylation level of CD34 gene in both donor (t0) and recipient HPSCs (t1-t5). In particular, two hypo-methylated regions located one in canonical CD34 promoter and another one mapping on 5′UTR of a CD34 transcript variant (ENST00000367036.7) were found in all time points. Moreover, we also observed a higher methyl-ated region in CD34 gene body (Additional file1: Figure S1). Therefore, expression of CD34 antigen was associated to its promoter hypo-methylation.
To identify genes that are modulated after AHSCT, we analyzed the DMPs localized in the promoter region, whose methylation regulated the gene expression. In particular, we compared the promoter-associated DMPs of recipients (t1-t5) with those of donors (t0). The major
differences of DMP number in promoters were observed in t1 vs t0 obtaining a list of 2263 hyper- and 709 hypo-methylated probes corresponding to 1380 and 477 genes, respectively. These last numbers were drastically reduced, with a slight perturbation during 120–180 days, reaching 422 hyper- and 163 hypo-methylated probes (277 and 127 genes, respectively) in t5 vs t0 (Fig. 4a). The gene ontology analysis of t1 vs t0 indicated that both hyper- and hypo-methylated genes were signifi-cantly involved in biological processes important for hematopoiesis such as lymphocyte activation and differ-entiation, dynamic shaping of cellular membranes (actin filament process), and cell movement (adhesion) (Fig. 4b). Moreover, pathway analysis revealed that these genes were significantly enriched in the following cat-egories: hematopoietic stem cell, lymphocyte, NK progenitors and chemokine and cytokine signaling, and interleukin (IL) 2, IL3, IL5 and Granulocyte Macrophage-Colony Stimulating Factor (GM-CSF) sig-naling (Fig. 4c). Analyzing immunologic signature data sets, we also found that some genes were involved in B lymphocyte commitment (Fig.4d).
To understand which genes identified at 30 days preserved methylation changes at long term (1 year) after transplant, we compared them with DMPs/genes in t5 vs t0. In particu-lar, we observed that the majority of these DMPs/genes
(2604 DMPs/1699 genes) were differentially methylated at t1 but not in t5 against t0, indicating that methylation profile after 1 year of transplant comes back similar to donors. We defined them as“revert genes” (Additional file2: Table S1). Interestingly, we also observed that 368 DMPs correspond-ing to 270 genes (199 hyper- and 71 hypo-methylated genes) were differentially methylated both in t1 and t5 against t0 showing a stable modification after transplant. We defined them as“stable genes”(Additional file3: Table S2). The gene ontology analysis indicated that hypo-methylated “stable genes” were involved in dynamic shaping of cellular mem-branes (such as phospholipid binding and antigen binding) (Fig.5a). Moreover, pathway analysis revealed that hypo- and hyper-methylated “stable genes” were significantly enriched in hematopoietic stem cell trafficking, such as leukocyte transendothelial migration, integrin2 pathway, and in func-tion related to the HSC regulafunc-tion and homeostasis (Fig.5b).
Finally, in order to understand if “stable genes” were the result of methylation changes which occurred at 30 days and if were preserved up to 1 year post AHSCT, we searched for“stable genes” in t2-t4. Of note, we did not observe change in methylation status of 270 stable genes passing from t1 to t2, t3, t4, and t5, except for 8 genes which “temporarily” modified their methylation pattern only in t2. In fact, their status resulted similar to t1 in all other time points (t3-t5) (data not shown).
Analysis of promoter methylation profile of ALL patients with negative clinical outcome
In our cohort of patients, one subject (P2) with ALL lapsed and died after 195 and 300 days post AHSCT, re-spectively. Therefore, we analyzed the promoter-associated DMPs of this patient vs all other patients in each time
point. In this comparison, a similar promoter methylation profile was found in t0-t3 (data not shown), whereas a strong difference was observed in ALL t4 vs t4 of all pa-tients. In particular, 195 DMPs (corresponding to 143 genes) were found in t4 of ALL patients when compared to other patients (Additional file 4: Table S4). Of note, t4 Fig. 5Functional analysis of“stable genes”.aGene ontology analysis of hypo-methylated genes relative to t5 stable genes.bPathway analysis of hyper- and hypo-methylated genes relative to t5 stable genes
methylation profile of ALL patients (P2_4) was evaluated as an outlier by MDS and for this reason it was excluded from the next analysis (Fig.1a). The immunological signature of ALL t4 vs t4 of all patients (98 hyper- and 45 hypo-methylated genes) showed an enrichment in “hsc_vs_pro_bcell_up,” “ multipotent_progenitor_vs_lym-phoid_primed_mpp_up,” and “ multipotent_progenitor_v-s_pro_bcell_up”categories (Fig.6).
Discussion
The main goal of this study was to provide a general overview of DNA methylation changes in BM CD34+ cells derived from HM patients, including ALL, AML, and HL, after AHSCT and their relative donors. Analyz-ing the global methylation profile, MDS segregated the patient P19, its respective donor and t4 of patient P2 from all other samples. Interestingly, the first separation identified a strong methylation profile variation between a patient affected by HL (P19) and those with acute leukemia. This partition is probably due to the nature of two malignancies and the different conditioning regimen (Table 1). In fact, lymphoma and acute leukemia are quite different from each other for pathogenesis and clinico-pathological properties, the former starting in the immune system and affecting the lymph nodes and lym-phocytes [41, 42] and the latter occurring when the BM produces too many abnormal progenitor white blood cells [43, 44]. In addition, HL patient received reduced intensity conditioning, while all the other patients were subjected to a myeloablative regimen (Table 1). Unex-pectedly, MDS showed that AML and ALL methylation profiles overlap even if these are two different leukemia types, i.e., myeloid [43] and lymphoid [44] respectively. Moreover, a possible explanation of P2 t4 exclusion after MDS could be the presence of a different chimerism sta-tus (10%) with respect to the other patients (90%). It was reported that patients with mixed chimerism showed a higher differential methylation than donors, with respect to patients with complete chimerism [45]. These find-ings suggested that HSPC DNA methylation pattern post-transplant could be influenced by recipient BM microenvironment or by the recurrence of patient HSPCs.
Analyzing genome-wide BM HSPC methylation with or without discrimination between gene promoters and bodies, after elimination of confounding factors, we visu-alized a similar profile between donors and recipients during transplant at all investigated time points. These data are in line with those of Rodriguez et al. [45] show-ing stable global methylation levels after HSCT over 12 months between donors and recipients. However, that work had two important differences with respect to this one, the use of PB mononuclear cells and the analysis of repetitive sequences (LINE1 and NBL2) [45].
Interestingly, in unsupervised hierarchical clustering, we observed that four donors clustered together, whereas the other five were clearly separated. This distri-bution could be not due to the different donor types.
It was reported that HSPCs from the same source, CB or mobilized PB (mPB), of different healthy subjects all grouped together and that CB and mPB groups clustered close to each other [20, 46]. A possible explanation to our donor distribution could be their age. In fact, analyz-ing their characteristics, we noted that the donor cluster age ranged from 23 to 30 years, while the age of the other case was instead > 35 years and, in one case, 14 years. Moreover, four other donors clustered with their respective recipients. This cluster could be due to the nature of CD34+ recipient cells that maintained the “methylation memory” of donor infused cells. Indeed, DNA methylation is considered a stable epigenetic mark that can be inherited through multiple cell divisions [47, 48], but during the development and cell differentiation, it is dynamic, although some methylation changes are preserved as an epigenetic memory [47,48]. Of note, the other half of patients did not cluster with their respect-ive donors probably because the HSPCs were strongly influenced by BM HM recipient microenvironment [49, 50]. To be solved, this issue will need a future investiga-tion on an increased number of subjects.
The DNA methylation profile between donors and all time points of recipients revealed a strong hyper-methylation of HSPCs after transplant. In particu-lar, we found in all cases that hyper-methylated probes are commonly associated with CpG open seas and shores in promoter regions and with CpG open seas in body regions. Our data are in agreement with those of Weidner et al. [51] who demonstrated that cultured HPCs CD34+ acquired significant promoter DNA hyper-methylation in shore regions, reflected in differen-tial gene expression and variant DNMT3A transcripts. Moreover, also the open sea hyper-methylation is in ac-cordance with the methylation data observed in other studies carried out in healthy tissues, but in contrast with its hypo-methylation found in various cancers [52– 54]. DNA methylation of CpG shores, shelves, and open sea has been shown to be related to gene expression in normal and tumor cells [52, 55, 56]. In particular, hyper-methylation of the gene bodies open sea was posi-tively linked to gene expression in different human tis-sues, cell lines, and primary cancer cells [52,53]. On the other hand, the hypo-methylation in promoter regions, specifically in open seas, shelves, and shores, was signifi-cantly associated to upregulation of the corresponding genes [52,54].
drastically changed, going from 12,043/292/1857 at 30 days to 3645/83/668 at 60 days, and this reduction was maintained for up to 1 year after transplant. It was sug-gested that CD34+ donor cells consistently modified their methylation pattern during the engraftment phase, which occurs 2 to 4 weeks after transplant. This perturb-ation could be caused by the recipient microenviron-ment, which strongly influenced the CD34+engraftment [57]. Recent studies identified the intimate association between BM perivascular endothelial cells and HSCs throughout stem cell life, identifying their important role in regulating HSC biology [49, 50]. In particular, differ-ent molecular and physical properties of microenviron-ment cells critical for HSC engraftmicroenviron-ment, maintenance, localization, and regeneration have been described [49, 50]. In addition, this perturbation was associated to a dominant hyper-methylation that was drastically reduced in time, suggesting an initial genome silencing which de-creased within 60 days and then for up to 1 year. Weid-ner et al. [51] demonstrated that DNA methylation of healthy CD34+ was hardly affected by stromal support. Moreover, microenvironment has been shown to exert profound but partially reversible changes on DNA methylation and on mRNA expression profile in patient-derived glioma stem cells [58]. Functional ana-lysis of the possible consequences of this perturbation showed its involvement in hematopoietic cell activation, differentiation, shaping, and movement. Concerning methylation restoring, it has been reported that DNA methylation is inheritable and adapts to a specific cellu-lar memory function during development or stress [48, 59], cellular conditions that applies to this case.
It is known that the immunological reconstitution of different cell subsets after AHSCT occurs at different time points: 21 days for neutrophils, 30–100 days for NK cells, 100 days for T cells, and 1–2 years for CD19+ B cells [60]. Anyway, little is known about methylation levels and gene expression in the engraftment phase. Our data showed an involvement of methylation in hematopoiesis specifically in this phase; in fact, post 30 days of HSCT, the gene ontology revealed a modulation of leukocyte activation and differentiation while pathway analysis showed the regulation of lymphocyte and NK progenitors and chemokine and cytokine signaling. In particular, cytokines like IL-3 and IL-5 and growth fac-tors including GM-CSF are involved in proliferation and differentiation of myeloid precursors [61–63]. Moreover, they also regulate HSC quiescence/self-renewal and lymphoid commitment activating signal transducer and activator of transcription 5 (STAT5) [64–66]. In conclu-sion, during the engraftment phase, the modulation of these pathways is required for HSC quiescence/expan-sion and for an efficient lympho-myeloid repopulation [67]. Moreover, an enrichment in immunological
signature identified genes involved in lymphoid commit-ment. The lymphocyte reconstitution after HSCT has an important role, not only on the prevention of serious in-fections in the early transplantation period, but also on the killing of residual leukemic cells by graft-versus-leukemia effect [68, 69]. Other studies re-ported that a higher absolute lymphocyte count on day + 30 was associated with faster hematopoietic recovery and, consequently, a more rapid neutrophil and platelet engraftment [68,70]. Of note, it is intriguing that at 30 days post-transplant in PB there are circulating leuco-cytes indicating an occurred engraftment, while in BM their progenitor cells are still subject to a strong per-turbation of methylation status.
Our analysis proposes that it could be interesting and useful to anticipate the methylation analysis of CD34 be-fore 30 days. In fact, a CD34 methylation pattern at 10– 14 days after AHSCT could point out all the changes ac-quired from the CD34 in the “full” engraftment phase. We could define an“engraftment methylation signature” of CD34 thus using it as first sign of engraftment com-pared to both white blood cell and platelet count. In-deed, it could allow an early planning of supportive therapies in transplantation.
Remarkably, at 60 days post HSCT, CD34+ cells mainly re-established the same gene methylation levels as donor HSPCs, except for a gene pool that remained differently methylated up to 365 days. These genes encoding for matri-cellular proteins, α/β integrins, and chemokines are in-volved in dynamic shaping of cellular membranes and trafficking. Chemokines are a small group of related chemoattractant peptides that play an essential role in the development and homeostatic maintenance of the immune system [71, 72]. In particular, they regulated HSC homing to their BM niches and directed immature lymphocytes to a series of maturation sites within lymphoid organs [71, 72]. Like chemokines, also theα/βintegrins, a class of het-erodimeric trans-membrane receptors, play an important role in HSC maintenance, regulating their egress from the BM niche and other functions [73]. Within the BM niche exists a tightly controlled local microenvironment that reg-ulates quiescence, proliferation, and differentiation of HSCs, in order to ensure life-long, balanced, and multilineage hematopoiesis [49,74]. Overall, our data suggest that BM recipient microenvironment regulated/modified several cel-lular responses of CD34+cells, allowing their adaptation to novel environmental stimuli.
Finally, the promoter methylation profile analysis at 180 days after transplant of ALL patient showed a strong differ-ence with respect to other patients. We observed a modula-tion of methylamodula-tion pattern regarding B and T cell populations. The immunological signature enrichment re-vealed the presence of genes, such as BRD3, PBX2, and
WNT5B, involved in HSPC proliferation, self-renewal, and differentiation, found deregulated in leukemia [75–78]. In addition, among deregulated genes, we found GLI3, a nega-tive regulator of the Hedgehog signaling pathway, which is aberrantly activated in cancer. In line with our data, GLI3 was demonstrated to be epigenetically silenced in patients with acute leukemia [79]. Interestingly, at this time point, ALL patient had 10% of chimerism and after additional 15 days relapsed. This suggests the interesting hypothesis that promoter methylation profile analysis may be useful to pre-dict relapse in these cases, although further investigation is needed to validate this possibility. In line with our hypoth-esis, a recent study investigated the prognostic relevance of CpG island methylation phenotype classification in pediatric B cell precursor (BCP)-ALL patients, showing that it is a strong candidate for improved risk stratification of re-lapsed BCP-ALL [80]. We envision that a CD34 promoter methylation pattern study could integrate the routine diag-nostic tool of chimerism analysis in assessment of engraft-ment and early detection of graft failure in AHSCT.
Conclusions
This study analyzed, for the first time, DNA methylation dynamics of BM-HSPCs after AHSCT which involved multiple adaptation steps in the new recipients. Methyla-tion consistently changed at 30 day post AHSCT and progressively returned to levels similar to those of donor HSPCs. An acquired modification of DNA methylation persisted, however, in only a pool of genes for up to 1 year. Finally, preliminary data in one ALL patients sug-gested that methylation profile analysis could provide a predictor of relapse.
Despite the relative small sample number, our data strongly suggest that DNA methylation analysis is a valid complement to studies on AHSCT based on gene ex-pression profiles, providing also useful information for further investigation to characterize the epigenetic mechanisms occurring in transplants. It can be reason-ably expected, in fact, that detailed DNA methylation analysis, as a source of novel biomarkers, will help ad-vance toward precision medicine in AHSCT and hematological malignancies.
Additional files
Additional file 1:Figure S1.DNA methylation in the genomic region mapping on CD34 gene in donors (to) and in receiving time points (t1, t2, t3, t4, t5). (DOCX 652 kb)
Additional file 2:Table S1.Hypo- and Hyper-methylated“revert genes”. (DOC 86 kb)
Additional file 3:Table S2.Hypo- and Hyper-methylated“stable genes”. (DOC 36 kb)
Additional file 4:Table S3.Hypo- and Hyper-methylated genes deriving from p2 t4 vs all other t4 patients comparisons. (DOC 33 kb)
Abbreviations
AHSCT:Allogeneic hematopoietic stem cell transplantation; ALL: Acute lymphoid leukemia; AML: Acute myeloid leukemia; BM: Bone marrow; CpGs: Cytosines adjacent to guanines; DMPs: Differentially methylated probes; DMRs: Differentially methylated regions; HL: Hodgkin lymphoma; HLA: Human leukocyte antigen; HMs: Hematological malignancies; HSPCs: Hematopoietic stem and progenitor cells; MDS: Multidimensional scaling; mPB: Mobilized peripheral blood; P: Patient; PB: Peripheral blood; TSS: Transcription start site; UCB: Umbilical cord blood; UTR: Untranslated region
Acknowledgments
The authors wish to thank and dedicate this work to Professor Luigi Del Vecchio, who recently passed away.
Funding
This research was supported by Italian ministry of Health, Current Research Funds for IRCCS [CUP E66J12000230001], the Italian Association for Cancer Research (grant IG-17426), and the Italian Ministry of Instruction and Research (Flagship Project InterOmics).
Availability of data and materials
The datasets used in this study are available from the corresponding author.
Authors’contributions
ST, AC, and LDL designed and performed the research, conducted the experiments, analyzed the data, and wrote the paper. PZ, AW, DM, GC, and VS performed bioinformatics and statistical analyses. AMC and LS were responsible for the recruitment of patients and data collection. IL, FLR, and VS conducted the experiments. AW, LDV, and PM provided a critical revision for important intellectual content. All authors read and approved the final manuscript.
Ethics approval and consent to participate
All procedures performed in this study were in accordance with the ethical standard of the institutional and national research committee and with the 1964 Helsinki Declaration and its later amendments or comparable ethical standards.
Consent for publication
Not applicable.
Competing interests
The authors declare that they have no competing interests.
Publisher’s Note
Springer Nature remains neutral with regard to jurisdictional claims in published maps and institutional affiliations.
Author details
1Laboratory of Preclinical and Translational Research, IRCCS - Referral Cancer
Center of Basilicata (CROB), 85028 Rionero in Vulture, Italy.2SSD Unità di terapia intensiva ematologica e terapie cellulari, Fondazione IRCCS-Casa Sollievo della Sofferenza, San Giovanni Rotondo, Italy.3Laboratory of Molecular Medicine and Genomics, Department of Medicine, Surgery and Dentistry Scuola Medica Salernitana, University of Salerno, Baronissi, SA, Italy. 4Laboratory of Clinical Research and Advanced Diagnostics, IRCCS - Referral
Cancer Center of Basilicata (CROB), 85028 Rionero in Vulture, Italy.5Medical Statistics Unit, University of Campania“Luigi Vanvitelli”, Naples, Italy. 6
Received: 8 March 2019 Revised: 18 April 2019 Accepted: 24 April 2019
References
1. Chomyk AM, Volsko C, Tripathi A, et al. DNA methylation in demyelinated multiple sclerosis hippocampus. Sci Rep. 2017.https://doi.org/10.1038/ s41598-017-08623-5.
2. Todoerti K, Calice G, Trino S, et al. Global methylation patterns in primary plasma cell leukemia. Leuk Res. 2018.https://doi.org/10.1016/j.leukres.2018. 09.007.
3. Flavahan WA, Gaskell E, Bernstein BE. Epigenetic plasticity and the hallmarks of cancer. Science. 2017.https://doi.org/10.1126/science.aal2380. 4. Domingo-Gonzalez R, Moore BB. Innate immunity post-hematopoietic stem
cell transplantation: focus on epigenetics. Adv Neuroimmune Biol. 2014.
https://doi.org/10.3233/NIB-140079.
5. Robertson KD. DNA methylation, methyltransferases, and cancer. Oncogene. 2001.https://doi.org/10.1038/sj.onc.1204341.
6. Jang HS, Shin WJ, Lee JE, Do JT. CpG and non-CpG methylation in epigenetic gene regulation and brain function. Genes (Basel). 2017.https:// doi.org/10.3390/genes8060148.
7. Jones PA, Liang G. Rethinking how DNA methylation patterns are maintained. Nat Rev Genet. 2009.https://doi.org/10.1038/nrg2651. 8. Herman JG, Baylin SB. Gene silencing in Cancer in association with
promoter Hypermethylation. N Engl J Med. 2003.https://doi.org/10.1056/ NEJMra023075.
9. Jones PA, Jones PA, Baylin SB, Baylin SB. The epigenomics of cancer. Cell. 2007.https://doi.org/10.1016/j.drudis.2011.09.009.
10. Yang X, Han H, DeCarvalho DD, Lay FD, Jones PA, Liang G. Gene body methylation can alter gene expression and is a therapeutic target in cancer. Cancer Cell. 2014.https://doi.org/10.1016/j.ccr.2014.07.028.
11. Moarii M, Boeva V, Vert JP, Reyal F. Changes in correlation between promoter methylation and gene expression in cancer. BMC Genomics. 2015.
https://doi.org/10.1186/s12864-015-1994-2.
12. Deaton AM, Bird A. CpG islands and the regulation of transcription. Genes Dev. 2011.https://doi.org/10.1101/gad.2037511.
13. Rollins RA, Haghighi F, Edwards JR, et al. Large-scale structure of genomic methylation patterns. Genome Res. 2006.https://doi.org/10.1101/gr.4362006. 14. Irizarry RA, Ladd-Acosta2 C, Bo W, Zhijin W, Montano C, Onyango P, Cui H,
Gabo K, Rongione M, Webster M, Ji H, James Potash SS, AP F. Genome-wide methylation analysis of human colon cancer reveals similar hypo- and hypermethylation at conserved tissue- specific CpG island shores. Nat Genet. 2009.https://doi.org/10.1038/ng.298.Genome-wide. 15. Ziller MJ, Gu H, Müller F, et al. Charting a dynamic DNA methylation
landscape of the human genome. Nature. 2013.https://doi.org/10.1038/ nature12433.
16. Edgar R, Tan PPC, Portales-Casamar E, Pavlidis P. Meta-analysis of human methylomes reveals stably methylated sequences surrounding CpG islands associated with high gene expression. Epigenetics Chromatin. 2014.https:// doi.org/10.1186/1756-8935-7-28.
17. Shen J, Wang S, Zhang YJ, et al. Exploring genome-wide DNA methylation profiles altered in hepatocellular carcinoma using Infinium
HumanMethylation 450 BeadChips. Epigenetics. 2013.https://doi.org/10. 4161/epi.23062.
18. De Luca L, Trino S, Laurenzana I, et al. Knockdown of miR-128a induces Lin28a expression and reverts myeloid differentiation blockage in acute myeloid leukemia. Cell Death Dis. 2017;8(6).https://doi.org/10.1038/cddis. 2017.253.
19. De Luca L, Trino S, Laurenzana I, et al. MiRNAs and piRNAs from bone marrow mesenchymal stem cell extracellular vesicles induce cell survival and inhibit cell differentiation of cord blood hematopoietic stem cells: a new insight in transplantation. Oncotarget. 2016;7(6).https://doi.org/10. 18632/oncotarget.6791.
20. Bocker MT, Hellwig I, Breiling A, Eckstein V, Ho AD, Lyko F. Genome-wide promoter DNA methylation dynamics of human hematopoietic progenitor cells during differentiation and aging. Blood. 2011.https://doi.org/10.1182/ blood-2011-01-331926.
21. A. Patel S, Rameshwar P. Stem cell transplantation for hematological malignancies: prospects for personalized medicine and co-therapy with mesenchymal stem cells. Curr Pharmacogenomics Person Med 2011.
https://doi.org/10.2174/187569211796957548.
22. De Luca L, Trino S, Laurenzana I, et al. Mesenchymal stem cell derived extracellular vesicles: a role in hematopoietic transplantation? Int J Mol Sci. 2017;18(5).https://doi.org/10.3390/ijms18051022.
23. Mosaad YM. Immunology of hematopoietic stem cell transplant. Immunol Investig. 2014.https://doi.org/10.3109/08820139.2014.942460. 24. Chen XH, Gao L, Zhang X, et al. HLA-haploidentical blood and bone
marrow transplantation with anti-thymocyte globulin: long-term comparison with HLA-identical sibling transplantation. Blood Cells Mol Dis. 2009.https://doi.org/10.1016/j.bcmd.2009.02.005.
25. Copelan EA. Hematopoietic stem-cell transplantation. N Engl J Med. 2006.https://doi.org/10.1177/0956797611399291.
26. Seggewiss R, Einsele H. Immune reconstitution after allogeneic transplantation and expanding options for immunomodulation: an update. Blood. 2010.https://doi.org/10.1182/blood-2009-12-234096. 27. Atilla E, Atilla PA, Demirer T. A review of myeloablative vs reduced intensity/
non-myeloablative regimens in allogeneic hematopoietic stem cell transplantations. Balkan Med J. 2017.https://doi.org/10.4274/balkanmedj. 2017.0055.
28. Afessa B, Peters SG. Major complications following hematopoietic stem cell transplantation. Semin Respir Crit Care Med. 2006. https://doi.org/10.1055/s-2006-945530.
29. Thomson BG, Robertson KA, Gowan D, et al. Analysis of engraftment, graft-versus-host disease, and immune recovery following unrelated donor cord blood transplantation. Blood. 2000;96(8):2703–11. 30. Khan F, Agarwal A, Agrawal S. Significance of chimerism in
hematopoietic stem cell transplantation: new variations on an old theme. Bone Marrow Transplant. 2004.https://doi.org/10.1038/sj.bmt. 1704525.
31. Clemente I, Goncalo A, Faria C, Dias M, Barbosa I, Mendes C. Relevance of Chimerism analysis after allogeneic stem cell transplantation. Transplant Proc. 2017.https://doi.org/10.1016/j.transproceed.2017.01.065. 32. Pistore C, Giannoni E, Colangelo T, et al. DNA methylation variations
are required for epithelial-to-mesenchymal transition induced by cancer-associated fibroblasts in prostate cancer cells. Oncogene. 2017.https:// doi.org/10.1038/onc.2017.159.
33. Team RDC, R Development Core Team R. R: a language and environment for statistical computing. R Found Stat Comput. 2016.https://doi.org/10. 1007/978-3-540-74686-7.
34. Du P, Zhang X, Huang CC, et al. Comparison of Beta-value and M-value methods for quantifying methylation levels by microarray analysis. BMC Bioinformatics. 2010.https://doi.org/10.1186/1471-2105-11-587. 35. Hansen. K. D. IlluminaHumanMethylation450kmanifest: annotation for
Illumina’s 450k methylation arrays. R. Package Version 0.4.0. 2012. 36. Ritchie ME, Phipson B, Wu D, et al. Limma powers differential
expression analyses for RNA-sequencing and microarray studies. Nucleic Acids Res. 2015.https://doi.org/10.1093/nar/gkv007.
37. Aryee MJ, Jaffe AE, Corrada-Bravo H, et al. Minfi: a flexible and comprehensive Bioconductor package for the analysis of Infinium DNA methylation microarrays. Bioinformatics. 2014.https://doi.org/10.1093/bioinformatics/ btu049.
38. Peters TJ, Buckley MJ, Statham AL, et al. De novo identification of differentially methylated regions in the human genome. Epigenetics Chromatin. 2015.https://doi.org/10.1186/1756-8935-8-6.
39. Yu G, Wang L-G, Han Y, He Q-Y. clusterProfiler: an R package for comparing biological themes among gene clusters. Omi A J Integr Biol. 2012.https:// doi.org/10.1089/omi.2011.0118.
40. Liberzon A, Birger C, Thorvaldsdóttir H, Ghandi M, Mesirov JP, Tamayo P. The molecular signatures database Hallmark gene set collection. Cell Syst. 2015.https://doi.org/10.1016/j.cels.2015.12.004.
41. Townsend W, Linch D. Hodgkin’s lymphoma in adults. Lancet. 2012.https:// doi.org/10.1016/S0140-6736(12)60035-X.
42. Küppers R, Engert A, Hansmann M-L. Hodgkin lymphoma. J Clin Invest. 2011.https://doi.org/10.1172/JCI61245.
43. Longo DL, Döhner H, Weisdorf DJ, Bloomfield CD. Acute Myeloid Leukemia. New Engl J Med. 2015.https://doi.org/10.1016/j.jbi.2012.09.002.
44. Terwilliger T, Abdul-Hay M. Acute lymphoblastic leukemia: a comprehensive review and 2017 update. Blood Cancer J. 2017.https://doi.org/10.1038/bcj. 2017.53.
45. Rodriguez RM, Suarez-Alvarez B, Salvanés R, et al. DNA methylation dynamics in blood after hematopoietic cell transplant. PLoS One. 2013.
46. Calvanese V, Fernández AF, Urdinguio RG, et al. A promoter DNA demethylation landscape of human hematopoietic differentiation. Nucleic Acids Res. 2012.https://doi.org/10.1093/nar/gkr685. 47. Kim M, Kang TW, Lee HC, et al. Identification of DNA methylation
markers for lineage commitment of in vitro hepatogenesis. Hum Mol Genet. 2011.https://doi.org/10.1093/hmg/ddr171.
48. Kim M, Costello J. DNA methylation: an epigenetic mark of cellular memory. Exp Mol Med. 2017.https://doi.org/10.1038/emm.2017.10.
49. Mendelson A, Frenette PS. Hematopoietic stem cell niche maintenance during homeostasis and regeneration. Nat Med. 2014.https://doi.org/10. 1038/nm.3647.
50. Perlin JR, Sporrij A, Zon LI. Blood on the tracks: hematopoietic stem cell-endothelial cell interactions in homing and engraftment. J Mol Med. 2017.
https://doi.org/10.1007/s00109-017-1559-8.
51. Weidner CI, Walenda T, Lin Q, et al. Hematopoietic stem and progenitor cells acquire distinct DNA-hypermethylation during in vitro culture. Sci Rep. 2013.https://doi.org/10.1038/srep03372.
52. Klett H, Balavarca Y, Toth R, et al. Robust prediction of gene regulation in colorectal cancer tissues from DNA methylation profiles. Epigenetics. 2018.
https://doi.org/10.1080/15592294.2018.1460034.
53. Varley KE, Gertz J, Bowling KM, et al. Dynamic DNA methylation across diverse human cell lines and tissues. Genome Res. 2013.https://doi.org/10. 1101/gr.147942.112.
54. Qu Y, Lennartsson A, Gaidzik VI, et al. Differential methylation in CN-AML preferentially targets non-CGI regions and is dictated by DNMT3A mutational status and associated with predominant hypomethylation of HOX genes. Epigenetics. 2014.https://doi.org/10. 4161/epi.29315.
55. Marzese DM, Hoon DS. Emerging technologies for studying DNA methylation for the molecular diagnosis of cancer. Expert Rev Mol Diagn. 2015.https://doi.org/10.1586/14737159.2015.1027194.
56. Sakaki M, Ebihara Y, Okamura K, et al. Potential roles of DNA methylation in the initiation and establishment of replicative senescence revealed by array-based methylome and transcriptome analyses. PLoS One. 2017.https://doi. org/10.1371/journal.pone.0171431.
57. Laurenzana I, Lamorte D, Trino S, et al. Extracellular vesicles: a new prospective in crosstalk between microenvironment and stem cells in hematological malignancies. Stem Cells Int. 2018;2018.https://doi.org/10. 1155/2018/9863194.
58. Baysan M, Woolard K, Bozdag S, et al. Micro-environment causes reversible changes in DNA methylation and mRNA expression profiles in patient-derived glioma stem cells. PLoS One. 2014.https://doi.org/10.1371/journal. pone.0094045.
59. Bird A. DNA methylation patterns and epigenetic memory. Genes Dev. 2002.https://doi.org/10.1101/gad.947102.
60. de Koning C, Plantinga M, Besseling P, Boelens JJ, Nierkens S. Immune reconstitution after allogeneic hematopoietic cell transplantation in children. Biol Blood Marrow Transplant. 2015.https://doi.org/10.1016/j.bbmt.2015.08.028. 61. Metcalf D, Mifsud S, Di Rago L. Stem cell factor can stimulate the formation
of eosinophils by two types of murine eosinophil progenitor cells. Stem Cells. 2002;20(5):460–9.https://doi.org/10.1634/stemcells.20-5-460. 62. Moldenhauer A, Genter G, Lun A, Bal G, Kiesewetter H, Salama A.
Hematopoietic progenitor cells and interleukin-stimulated endothelium: expansion and differentiation of myeloid precursors. BMC Immunol. 2008;9: 56.https://doi.org/10.1186/1471-2172-9-56.
63. Bonavita O, Mollica Poeta V, Massara M, Mantovani A, Bonecchi R. Regulation of hematopoiesis by the chemokine system. Cytokine. 2018;109: 76–80.https://doi.org/10.1016/j.cyto.2018.01.021.
64. Yao Z, Cui Y, Watford WT, et al. Stat5a/b are essential for normal lymphoid development and differentiation. Proc Natl Acad Sci U S A. 2006;103(4): 1000–5.https://doi.org/10.1073/pnas.0507350103.
65. Wang Z, Medrzycki M, Bunting ST, Bunting KD. Stat5-deficient hematopoiesis is permissive for Myc-induced B-cell leukemogenesis. Oncotarget. 2015;6(30):28961–72.https://doi.org/10.18632/oncotarget.5009. 66. Wang Z, Bunting KD. STAT5 in hematopoietic stem cell biology and
transplantation. JAKSTAT. 2013;2(4):e27159.https://doi.org/10.4161/jkst.27159. 67. Ward AC, Touw I, Yoshimura A. The Jak-stat pathway in normal and
perturbed hematopoiesis. Blood. 2000;95(1):19–29.
68. Han DK, Baek HJ, Kim SY, Hwang TJ, Kook H. Implication of early lymphocyte recovery after allogeneic hematopoietic stem cell transplantation in children with leukemia. Yonsei Med J. 2013.https://doi.org/10.3349/ymj.2013.54.1.62.
69. Dickinson AM, Norden J, Li S, et al. Graft-versus-leukemia effect following hematopoietic stem cell transplantation for leukemia. Front Immunol. 2017.
https://doi.org/10.3389/fimmu.2017.00496.
70. Savani BN, Mielke S, Rezvani K, et al. Absolute lymphocyte count on day 30 is a surrogate for robust hematopoietic recovery and strongly predicts outcome after T cell-depleted allogeneic stem cell transplantation. Biol Blood Marrow Transplant. 2007.https://doi.org/10.1016/j.bbmt.2007.07.005. 71. Sokol CL, Luster AD. The chemokine system in innate immunity. Cold
Spring Harb Perspect Biol. 2015;7(5):a016303.https://doi.org/10.1101/ cshperspect.a016303.
72. Anders HJ, Romagnani P, Mantovani A. Pathomechanisms: homeostatic chemokines in health, tissue regeneration, and progressive diseases. Trends Mol Med. 2014.https://doi.org/10.1016/j.molmed.2013.12.002.
73. Khurana S, Schouteden S, Manesia JK, et al. Outside-in integrin signalling regulates haematopoietic stem cell function via Periostin-Itgav axis. Nat Commun. 2016.https://doi.org/10.1038/ncomms13500.
74. Qiu J, Papatsenko D, Niu X, Schaniel C, Moore K. Divisional history and hematopoietic stem cell function during homeostasis. Stem Cell Rep. 2014.
https://doi.org/10.1016/j.stemcr.2014.01.016.
75. Nygren MK, Døsen G, Hystad ME, Stubberud H, Funderud S, Rian E. Wnt3A activates canonical Wnt signalling in acute lymphoblastic leukaemia (ALL) cells and inhibits the proliferation of B-ALL cell lines. Br J Haematol. 2007.
https://doi.org/10.1111/j.1365-2141.2006.06442.x.
76. Lu D, Zhao Y, Tawatao R, et al. Activation of the Wnt signaling pathway in chronic lymphocytic leukemia. Proc Natl Acad Sci. 2004.https://doi.org/10. 1073/pnas.0308648100.
77. Coudé M-M, Braun T, Berrou J, et al. BET inhibitor OTX015 targets BRD2 and BRD4 and decreases c-MYC in acute leukemia cells. Oncotarget. 2015.
https://doi.org/10.18632/oncotarget.4131.
78. Carretta M, Brouwers-Vos AZ, Bosman M, et al. BRD3/4 inhibition and FLT3-ligand deprivation target pathways that are essential for the survival of human MLL-AF9+ leukemic cells. PLoS One. 2017.https://doi.org/10.1371/ journal.pone.0189102.
79. Chaudhry P, Singh M, Triche TJ, Guzman M, Merchant AA. GLI3 repressor determines hedgehog pathway activation and is required for response to SMO antagonist glasdegib in AML. Blood. 2017;129(26):3465–75.https://doi. org/10.1182/blood-2016-05-718585.