R E S E A R C H
Open Access
The effect of medium supplementation and
serial passaging on the transcriptome of
human adipose-derived stromal cells
expanded in vitro
Carla Dessels
1, Melvin A. Ambele
1,2and Michael S. Pepper
1*Abstract
Background:For adipose-derived stromal cells (ASCs) to be safe for use in the clinical setting, they need to be prepared using good manufacturing practices (GMPs). Fetal bovine serum (FBS), used to expand ASCs in vitro in some human clinical trials, runs the risk of xenoimmunization and zoonotic disease transmission. To ensure that GMP standards are maintained, pooled human platelet lysate (pHPL) has been used as an alternative to FBS. ASCs proliferate more rapidly in pHPL than in FBS, with no significant change in immunophenotype and differentiation capacity. However, not much is known about how pHPL affects the transcriptome of these cells.
Methods:This study investigated the effect of pHPL and FBS on the ASC transcriptome during in vitro serial expansion from passage 0 to passage 5 (P0 to P5). RNA was isolated from ASCs at each passage and hybridized to Affymetrix HuGene 2.0 ST arrays for gene expression analysis.
Results:We observed that the transcriptome of ASCs expanded in pHPL (pHPL-ASCs) and FBS (FBS-ASCs) had the greatest change in gene expression at P2. Gene ontology revealed that genes upregulated in pHPL-ASCs were enriched for cell cycle, migration, motility, and cell-cell interaction processes, while those in FBS-ASCs were enriched for immune response processes. ASC transcriptomes were most homogenous from P2 to P5 in FBS and from P3 to P5 in pHPL. FBS- and pHPL-gene-specific signatures were observed, which could be used as markers to identify cells previously grown in either FBS or pHPL for downstream clinical/research applications. The number of genes constituting the FBS-specific effect was 3 times greater than for pHPL, suggesting that pHPL may be a milder supplement for cell expansion. A set of genes were expressed in ASCs at all passages and in both media. This suggests that a unique ASC in vitro transcriptomic profile exists that is independent of the passage number or medium used.
Conclusions:GO classification revealed that pHPL-ASCs are more involved in cell cycle processes and cellular proliferation when compared to FBS-ASCs, which are involved in more specialized or differentiation processes like cardiovascular and vascular development. This makes pHPL a potential superior supplement for expanding ASCs as they retain their proliferative capacity, remain untransformed and pHPL does not affect the genes involved in differentiation in specific developmental processes.
Keywords:Adipose-derived stromal cells, Pooled human platelet lysate, Fetal bovine serum, Transcriptome
© The Author(s). 2019Open AccessThis article is distributed under the terms of the Creative Commons Attribution 4.0
International License (http://creativecommons.org/licenses/by/4.0/), which permits unrestricted use, distribution, and
reproduction in any medium, provided you give appropriate credit to the original author(s) and the source, provide a link to the Creative Commons license, and indicate if changes were made. The Creative Commons Public Domain Dedication waiver (http://creativecommons.org/publicdomain/zero/1.0/) applies to the data made available in this article, unless otherwise stated. * Correspondence:[email protected]
1
Department of Immunology, Institute for Cellular and Molecular Medicine, SAMRC Extramural Unit for Stem Cell Research and Therapy, Faculty of Health Sciences, University of Pretoria, PO Box 2034, Pretoria 0001, South Africa
Background
Adipose-derived stromal cells (ASCs) could constitute a novel therapeutic option for the treatment of several dis-eases and are increasingly being assessed in clinical trials for this purpose [1–3]. Most clinical trials make use of ASCs that have been expanded ex vivo via several rounds of passaging in order to obtain adequate cell numbers [4, 5]. In the laboratory, ASCs are traditionally expanded in medium supplemented with fetal bovine serum (FBS); however, it has been reported that ASCs expanded in FBS cause immune reactions when given to human patients [2, 6–8]. However, for these cells to be considered safe for patient use, they need to adhere to good manufacturing processes (GMPs), in which non-de-fined and animal-related products are eliminated [2,9]. As a result, several investigators have moved away from using FBS and have instead investigated the use of human alternatives such as pooled human platelet lysate (pHPL) [10–12]. Most studies compare the criteria as set out by the Mesenchymal and Tissue Stem Cell Committee of the International Society for Cellular Therapy (ISCT) and International Federation of Adipose Therapeutics and Sciences (IFATS) when compar-ing FBS to pHPL [6,10,13–15]. These criteria include ASC adherence to plastic, immunophenotypic surface marker ex-pression and the ability to differentiate into bone, fat, and cartilage [5,13]. The use of pHPL as a medium supplement has advantages over FBS. It has thus been reported that when the cells are expanded in pHPL, their innate character-istics are unaltered and proliferation is increased during ex-pansion [10, 12, 16]. However, it is well known that experimental conditions, such as medium supplementation, can have an effect on gene expression [15,17–19]. It is there-fore important to demonstrate that the cells are safe for use in patients by measuring the effect of the medium supple-mentation at the level of gene expression. In this study, we assessed the changes in ASC gene expression that occur dur-ing serial passagdur-ing by compardur-ing cells expanded in FBS ver-sus pHPL.
Material and methods ASC isolation and expansion
Lipoaspirate samples were collected from five individual patients undergoing elective liposuction. Stromal vascu-lar fraction (SVF) was isolated from lipoaspirates using previously established protocols [5, 20]. SVF containing ASCs was seeded at a density of 5 × 10⁵cells/cm2in T80 flasks (80 cm2; NUNC™, Roskilde Site, Kamstrupvej, Denmark) and maintained inα-MEM containing 2% (v/v) penicillin [10,000 U/mL]-streptomycin [10,000 8μg/mL] (p/s; GIBCO, Life Technologies™, New York, USA) and ei-ther 10% (v/v) fetal bovine serum (FBS; GIBCO, Life Technologies™, New York, USA) or 10% pooled human platelet lysate (pHPL) supplemented with preservative-free heparin ([2 U/mL]; Biochrom, Merck Millipore, Berlin,
Germany). pHPL was manufactured as previously de-scribed in our laboratory and subjected to quality control checks [21,22]. At 80 to 90% confluence, ASCs were dis-sociated using trypLE (Life Technologies™, New York, USA) and counted. ASCs at passage zero (P0) were ex-panded by plating 5 × 10³ cells/cm2 into T80 flasks and were maintained in α-MEM containing 2% (v/v) p/s and either 10% (v/v) pHPL or 10% (v/v) FBS at 37 °C in 5% CO2. The passaging process was repeated from P0 to P5 for ASCs expanded in FBS and pHPL. ASCs were analyzed at every passage as shown on the schematic experimental design (Additional file1: Figure S1).
ASC characterization
ASCs were characterized by surface marker expression (immunophenotype) and the ability to differentiate into adipocytes. Immunophenotype was assessed on SVF and at each passage (P0 to P5) using methods previously de-scribed [22]. ASCs were induced to differentiate into adi-pocytes at P5, and adipogenesis was measured using methods previously described [17, 22]. Data and experi-mental design (Additional file1: Figure S1) can be found in Additional file1.
RNA isolation and quality
ASCs were expanded in FBS or pHPL and RNA was iso-lated at each passage. At confluence, the cells were dis-sociated using trypLE and counted. Thereafter, 1 × 10⁶ cells were centrifuged (300g) and the resultant pellet was washed using phosphate buffered saline (PBS). RNA was isolated using the RNeasy Minikit (Qiagen, Hilden, Germany) according to the manufacturer’s instructions, and quantified on a NanoDrop® ND 1000 spectropho-tometer (Thermo Fisher Scientific, Waltham, MA, USA). RNA purity was assessed at an absorbance optical dens-ity (OD) ratio of 260/280 and 260/230. RNA integrdens-ity and quality were assessed using a TapeStation® 2200 (Agilent Technologies; Santa Clara, CA, USA) together with RNA ScreenTape® and Sample Buffer kit (Agilent Technologies, Santa Clara, CA, USA) according to the manufacturer’s instructions. Sample read-out was com-pared to a TapeStation® RNA ladder. RNA that had ab-sorbance OD ratios greater than 2 and RIN values greater than 8 was used for downstream applications.
Microarray gene expression analysis
was used to synthesize second cycle single-stranded cDNA (ss-cDNA) and subsequently followed by another purification step. Purified ss-cDNA (5.5μg) was fragmen-ted, labeled, and used to prepare a hybridization cocktail. Hybridization was performed using the Affymetrix Gene-Chip® Hybridization Wash and Stain Kit according to the manufacturer’s protocol. The hybridization cocktail was hy-bridized to Affymetrix GeneChip® Human Gene 2.0 ST ar-rays. Arrays were placed in an Affymetrix GeneChip® Hybridization Oven-645 rotating at 60 rpm at 45 °C for 17 h, after which they were washed and stained in an Affyme-trix GeneChip® Fluidics Station-450Dx before being scanned in an Affymetrix GeneChip® Scanner-7G. The out-put Affymetrix CEL files, which have intensity values for all probes present on the scanned arrays, were used for further analysis. The Robust Multiarray Analysis algorithm [23] in the Affymetrix Expression Console™ was used to perform background correction, summarization, normalization, and the calculation of probe set expression values. Finally, the Affymetrix Transcription Analysis Console™ was used to calculate the fold change of each probe set or transcript cluster identifier number and mapped to the corresponding gene. Only differentially expressed genes (DEGs) that had a fold-change≥2 or≤ −2, apvalue > 0.05, and an FDR > 0.5 were used for downstream analysis. The fold-change of each gene represents the change in gene expression seen between two samples or conditions being compared and is based on the signal measured.
Functional analysis
The DEGs for the different samples were used for func-tional analysis to determine significantly enriched pathways and processes using the g:GOSt functional enrichment ana-lysis tool on the g:Profiler web server [24].
Results
ASC characterization
pHPL-ASCs had a tighter, smaller elongated shape when compared to FBS-ASCs (Additional file 1: Figure S2). The immunophenotype of FBS-ASCs and pHPL-ASCs was determined at each passage. More than 90% had the expression profile CD44+CD45−CD73+CD90+CD105+, while fewer than 2% were CD31+CD73−CD105−, and this was maintained up to P5 (Additional file 1: Figure S3). FBS-ASCs and pHPL-ASCs both underwent adipogenesis as evidenced by the accumulation of lipid droplets (Additional file1: Figure S4).
Gene expression analysis of ASCs expanded in pHPL and FBS
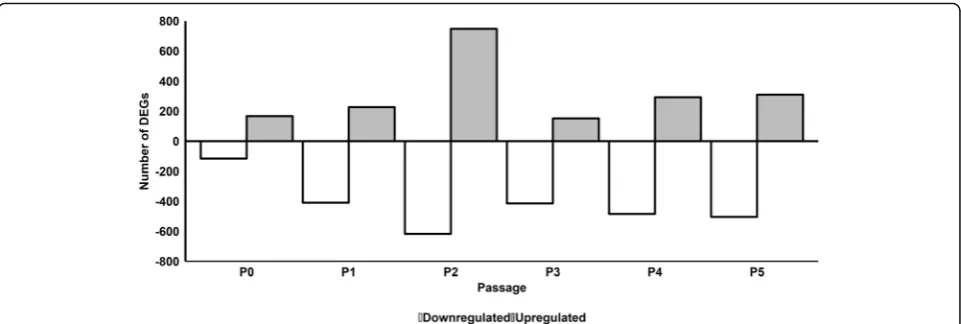
To compare at the effect of pHPL versus FBS on the transcriptome, we performed a microarray analysis of gene expression on ASCs serially expanded in pHPL or FBS from P0 to P5. We found that 185, 256, 811, 171,
319, and 349 genes were significantly upregulated while 127, 457, 707, 457, 575, and 567 genes were significantly downregulated in ASCs expanded in pHPL (pHPL-ASCs) compared to FBS (FBS-ASCs) at P0, P1, P2, P3, P4, and P5 respectively (Fig. 1; Additional file 1: Figure S5 and Additional file2).
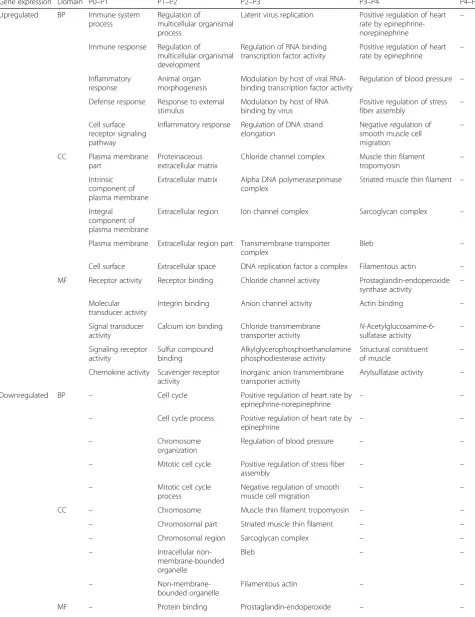
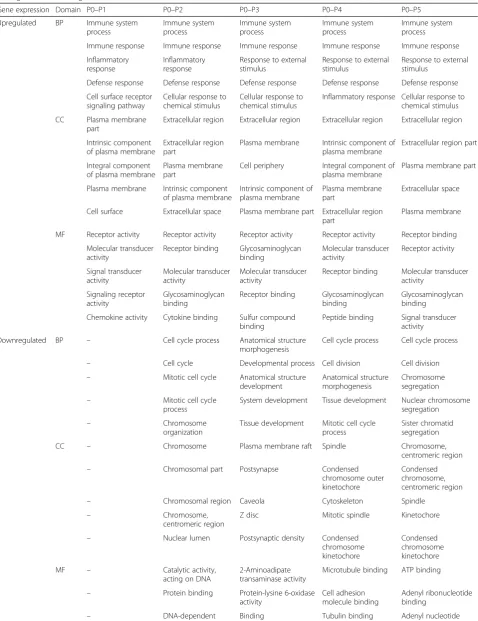
Functional analysis of the DEGs by gene ontology (GO) classification revealed that genes that were signifi-cantly upregulated at the different passages were enriched for certain biological processes (BP), cellular components (CC) and molecular functions (MF). Only the top 5 significant GO terms will be discussed here. From P0 to P5, pHPL-ASCs were enriched for GO terms such as developmental processes, cell cycle processes, cellular proliferation, and extracellular matrix and struc-ture organization. FBS-ASCs were enriched for GO terms such as cell proliferation, adhesion, extracellular matrix and structure organization, cardiovascular and vascular development, structure morphogenesis, and other devel-opmental processes (Table1; Additional file3).
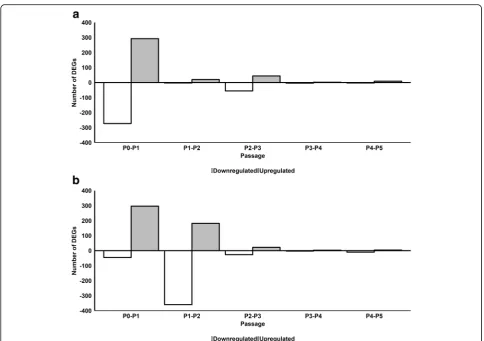
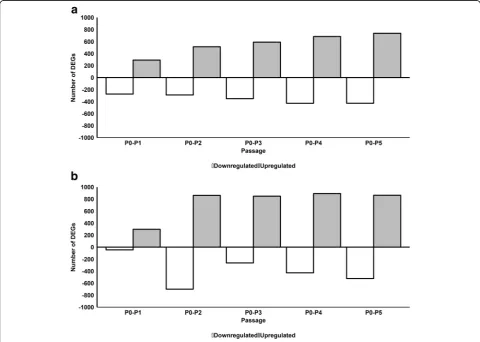
We next investigated the effect of serial passaging on gene expression in pHPL-ASCs and FBS-ASCs by com-paring gene expression at each passage to that of the previous passage (P1 vs P0, P2 vs P1, P3 vs P2, P4 vs P3, and P5 vs P4). For FBS-ASCs, 292, 20, 44, 2, and 9 genes were significantly upregulated while 273, 3, 56, 4, and 3 genes were significantly downregulated from P0 to P5, respectively (Fig. 2a and Additional file 4). For pHPL-ASCs, 297,182, 22, 3, and 4 genes were significantly up-regulated while 46, 360, 27, 3, and 4 genes were signifi-cantly downregulated from passages P0 to P5, respectively (Fig.2b and Additional file5).
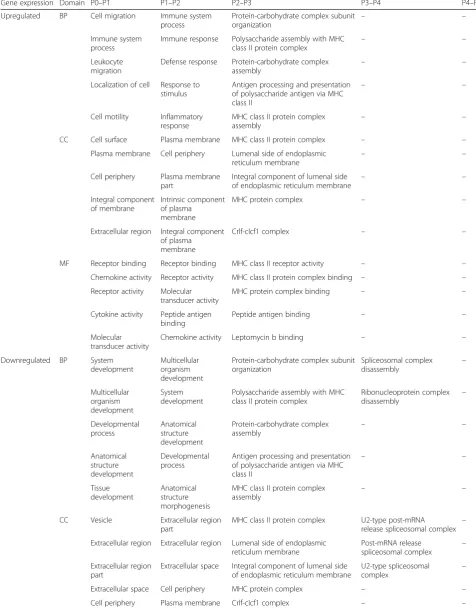
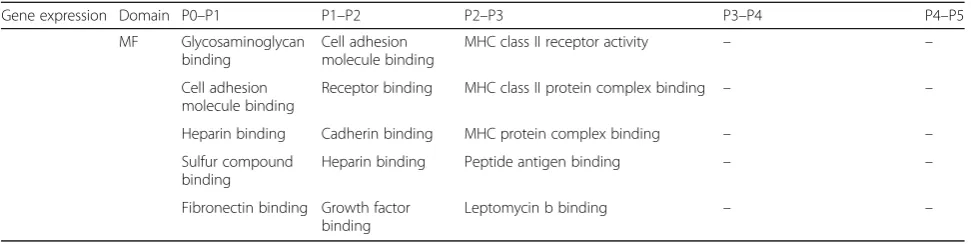
GO classification of upregulated genes in FBS-ASCs revealed they were significantly enriched for cell migra-tion and motility from P0 to P1, while those for P1 to P2 and P2 to P3 were mostly enriched for immunological responses and processes. Genes that were upregulated from P3 to P4 and P4 to P5 were not enriched for any GO terms (Table 2; Additional file 6). Genes that were downregulated from P0 to P1 and P1 to P2 were enriched for system and developmental processes, while those from P2 to P3 were enriched for immune subunit and protein assembly. In contrast, downregulated genes from P3 to P4 and P4 to P5 were not enriched for any GO terms.
significantly enriched for cell cycle processes, from P2 to P3 for cardiovascular processes, while downregulated genes from P0 to P1, P3 to P4, and P4 to P5 were not enriched for any GO term.
We next undertook to evaluate the extent to which the ASC transcriptome at each passage (P1 through to P5) differs from its original state (SVF) at P0 when ex-panded in either FBS or pHPL, and to functionally characterize such changes using GO classification. This was done by comparing gene expression at each passage (P1 to P5) to that of the“original”seeded ASCs (SVF) at P0. For FBS-ASCs, 292, 514, 591, 685, and 737 genes were significantly upregulated while 273, 288, 350, 427, and 426 genes were significantly downregulated from P1 to P5 (Fig. 3a and Additional file 8). For pHPL-ASCs, 297, 861, 848, 891, and 863 genes were significantly up-regulated while 46, 700, 262, 427, and 523 genes were significantly downregulated from passage P1 to P5 (Fig.3b and Additional file9).
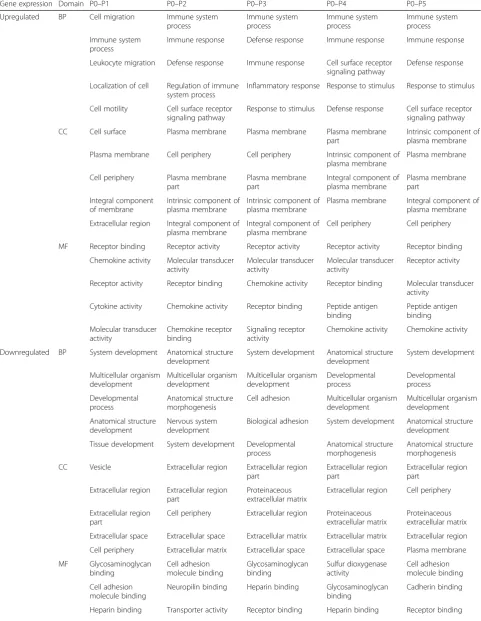
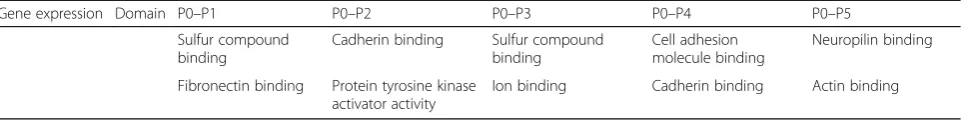
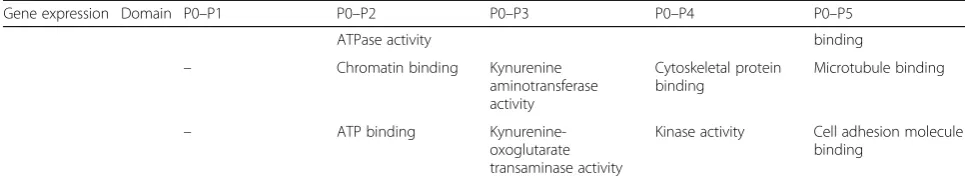
GO terms significantly enriched for in upregulated genes at each passage (P1 to P5) when compared to P0 in FBS-ASCs (Table4; Additional file10) or pHPL-ASCs (Table5; Additional file11) were specific to immune responses and processes. GO terms specific to developmental processes were enriched for in the downregulated genes in FBS-ASCs at each passage (P1 to P5) when compared to P0 (Table4; Additional file 10). For pHPL-ASCs, downregulated genes at P1 were not enriched for any GO term, while those of all the subsequent passages (P2 to P5) were enriched for cell cycle processes and developmental processes.
We observed during serial passaging that the ASC tran-scriptomic profile stabilizes (minimal change in DEGs be-tween adjacent passage numbers) from P2 for FBS (Fig.2a) and P3 for pHPL (Fig.2b). This could mean that ASC cul-tures are more homogenous from P2 to P5 and from P3 to P5 when expanded in FBS and pHPL respectively.
From the list of DEGs obtained at each passage (P1 to P5) when compared to P0 for both the FBS- and pHPL-ASCs (Additional files 8 and 9), we observed that ASCs showed gene expression signatures that were unique at each passage (P1 to P5) which was independent of the medium supplementation (FBS or pHPL) used during in vitro expansion (Additional file 12). This unique pas-sage-specific gene expression profile constitutes the DEGs that were common to both pHPL and FBS at each passage number. Equally, if the passage-specific gene ex-pression profile (DEGs common to both FBS- and pHPL-ASCs at each passage) is excluded at each passage number, the remaining DEGs represent unique FBS-ASC and pHPL-FBS-ASC passage-specific gene expression profiles (Additional file12).
TINAGL1, TMEM19, TNFRSF11B, USP53, VEPH1, WEE1, and WNT2) genes that were consistently up- or downregulated respectively at all passages (Add-itional file 13). This represents the set of genes that were differentially expressed in ASCs as a result of them being expanded in FBS irrespective of the cell passage number. This could be reflective of an FBS-specific effect on the ASC transcriptome (FBS-ASC-specific gene expression pro-file). Similarly, by looking at the unique pHPL-ASC pas-sage-specific gene expression profile at all passages (P1 to P5), there were 32 (A2M, ABLIM1, ADAMTS1, ADCYAP1R1, C10orf10, CHI3L1, EVI2B, F13A1, FAM65B, FST, GALNT12, HLA-QA1, HLA-DQA2, IL18, IL33, JAG1, MGP, MIR548I2, MT1G, MYCBP2, NTRK2, PCDHB16, PCSK1, PRELP, PRG4, RARRES1, ROR1-AS1, SFRP4, SMPDL3A, THBD, TPRG1, and ZNF727P) and 11 (CDK15, CTHRC1, EHD3, MBOAT2, MIR199A2, MIR503, MIR503HG, NT5DC2, PALLD, PPP2R3A, and RP11-08B5.2) genes that were consistently up- or downreg-ulated respectively at all passages (Additional file 13). This represents the set of genes that are differentially expressed in ASCs as a result of them being expanded in pHPL,
irrespective of the cell passage number. This could be re-flective of a pHPL-specific effect on the ASC transcriptome (pHPL-ASC-specific gene expression profile).
In total therefore, there were 118 DEGs that constituted the FBS-ASC-specific gene expression profile, which is al-most 3 times more than the 43 DEGs of the pHPL-ASC-specific gene expression profile (Additional file14). Func-tional analysis of the pHPL-ASC-specific gene expression signature by GO classification showed that neither up-nor downregulated genes were enriched for any biological process, while the FBS-ASC-specific gene expression sig-nature showed upregulated genes that were significantly enriched for cell migration and cell movement processes, while the downregulated genes were significantly enriched for the regulation of cell communication, signal transduc-tion and cell proliferatransduc-tion processes.
Table 2Top 5 enriched GO terms for significantly up- and downregulated DEGs for FBS-ASCs between subsequent passages.
Related to Fig.2a
Gene expression Domain P0–P1 P1–P2 P2–P3 P3–P4 P4–P5
Upregulated BP Cell migration Immune system
process
Protein-carbohydrate complex subunit organization
– –
Immune system process
Immune response Polysaccharide assembly with MHC
class II protein complex – –
Leukocyte migration
Defense response Protein-carbohydrate complex assembly
– –
Localization of cell Response to stimulus
Antigen processing and presentation of polysaccharide antigen via MHC class II
– –
Cell motility Inflammatory
response
MHC class II protein complex
assembly – –
CC Cell surface Plasma membrane MHC class II protein complex – –
Plasma membrane Cell periphery Lumenal side of endoplasmic reticulum membrane
– –
Cell periphery Plasma membrane
part
Integral component of lumenal side
of endoplasmic reticulum membrane – –
Integral component of membrane
Intrinsic component of plasma membrane
MHC protein complex – –
Extracellular region Integral component of plasma membrane
Crlf-clcf1 complex – –
MF Receptor binding Receptor binding MHC class II receptor activity – –
Chemokine activity Receptor activity MHC class II protein complex binding – –
Receptor activity Molecular transducer activity
MHC protein complex binding – –
Cytokine activity Peptide antigen binding
Peptide antigen binding – –
Molecular transducer activity
Chemokine activity Leptomycin b binding – –
Downregulated BP System
development
Multicellular organism development
Protein-carbohydrate complex subunit organization
Spliceosomal complex
disassembly –
Multicellular organism development
System development
Polysaccharide assembly with MHC class II protein complex
Ribonucleoprotein complex
disassembly –
Developmental process
Anatomical structure development
Protein-carbohydrate complex
assembly – –
Anatomical structure development
Developmental process
Antigen processing and presentation of polysaccharide antigen via MHC class II
– –
Tissue development
Anatomical structure morphogenesis
MHC class II protein complex
assembly – –
CC Vesicle Extracellular region
part
MHC class II protein complex U2-type post-mRNA
release spliceosomal complex –
Extracellular region Extracellular region Lumenal side of endoplasmic reticulum membrane
Post-mRNA release spliceosomal complex
–
Extracellular region part
Extracellular space Integral component of lumenal side of endoplasmic reticulum membrane
U2-type spliceosomal
complex –
Extracellular space Cell periphery MHC protein complex – –
are 69 upregulated genes (AIF1, APCDD1, APLN, APOC1, AQP9, BCL6B, C1orf162, C5AR1, CADM3, CCDC102B, CCR1, CD14, CD37, CD53, CD93, CDH5, CLEC7A, CLIC6, CPM, CSF1R, CSF2RA, CXCL16, CXCR4, CXorf36, ECSCR, ELMO1, ENPEP, FCER1G, FPR3, GMFG, GUCY1A3, HPGDS, IL18R1, ITGAM, ITGAX, KDR, KYNU, LAPTM5, LCP1, LCP2, LRRC25, LYVE1, MERTK, MGAT4A, NCF2, NCKAP1L, NOTCH3, OLFM2, PAG1, PECAM1, PILRA, PLTP, PLVAP, POM121L9P, PPBP, RAMP2, RNASE6, SCG2, SLC11A1, SLC16A10, SPARCL1, SPP1, TM4SF18, TMEM176B, TNFRSF1B, TREM1, TREM2, TYROBP, and VSIG4) and 5 downregulated genes (F2RL2, FGF5, GALNT5, RAB3B, and SLC9A7) that constitute this subset of genes that were consistently differentially expressed from P1 through to P5. This set of genes therefore represents a unique in vitro ASC transcriptome profile that was neither affected by medium supplementation nor cell passage number (Add-itional file 14). GO classification of these genes revealed that they are significantly enriched for normal cellular pro-cesses like response to stimulus and stress, defense, and in-flammatory responses and vesicle-mediated transport.
Discussion
Adipose-derived stromal cells (ASCs) are being assessed for their safety and efficacy in numerous clinical trials [6, 14, 25]. Traditionally, these cells are expanded in medium containing FBS, which is known to have several disadvantages such as the transmission of zoonotic dis-eases and the stimulation of immune reactions in pa-tients [26,27]. This has been circumvented by changing from animal products to either clinical-grade, GMP-compliant, or human alternative products [28]. One such change has been to supplement culture medium with ei-ther serum-free media or human blood components. The use of different medium supplements has been well documented and all show comparable immunophenoty-pic profiles and differentiation capacities while having marked differences in proliferation capacity [6]. The ad-vantage of pHPL over these alternatives lies largely in the ability to pool platelets from multiple donors.
Furthermore, it has been shown that ASCs expanded in pHPL retain their immunophenotypic characteristics and their ability to differentiate into bone, cartilage and fat [2, 6, 16]. One of the biggest advantages of using pHPL for ASC expansion is the marked increase in pro-liferation, which in turn makes the time required for ex-pansion to therapeutic numbers considerably shorter [12, 22]. However, not much is known about the effect of pHPL has on the transcriptome, proteome, and secre-tome of these cells, which may impact on the outcome of clinical trials. This study has made use of microarray technology to examine the effect of pHPL on the ASC transcriptome during serial expansion in vitro, by com-paring gene expression patterns in cells serially ex-panded in FBS or pHPL from P0 to P5.
Overall, the transcriptome of ASCs expanded in pHPL or FBS was most different at P2, the point at which the maximum number of genes were differentially expressed (811 and 707, respectively; Fig.1). Most genes that were upregulated in pHPL-ASC were significantly enriched for biological process such as cell cycle, cell division, and proliferation. This supports a previous study by Glo-vinski et al., in which changes in the expression of genes involved in cell proliferation and development were ob-served for ASCs expanded in pHPL [12]. This likewise confirms findings from other studies which have shown an increase in ASC proliferation in pHPL [16, 29]. For ASCs expanded in FBS, our findings are consistent with the observation that numerous genes involved in extra-cellular matrix formation are upregulated [30,31].
It is well documented that ASCs are a heterogeneous population as revealed by differences in transcriptome, proteome, and secretome between subpopulations within the ASC mixture [32–34]. The initial subset of adherent cells seeded in culture (P0) is a heterogeneous population; after passaging and prolonged expansion, the population becomes more homogenous [35]. Work performed by sev-eral groups has shown that the heterogeneity of ASCs during the expansion process remains between subpopu-lations and between individual cells within the same sub-population [32, 36, 37]. Furthermore, it has been Table 2Top 5 enriched GO terms for significantly up- and downregulated DEGs for FBS-ASCs between subsequent passages. Related to Fig.2a(Continued)
Gene expression Domain P0–P1 P1–P2 P2–P3 P3–P4 P4–P5
MF Glycosaminoglycan
binding
Cell adhesion molecule binding
MHC class II receptor activity – –
Cell adhesion molecule binding
Receptor binding MHC class II protein complex binding – –
Heparin binding Cadherin binding MHC protein complex binding – –
Sulfur compound binding
Heparin binding Peptide antigen binding – –
Fibronectin binding Growth factor binding
Table 3Top 5 enriched GO terms for significantly up- and downregulated DEGs for pHPL-ASCs between subsequent passages.
Related to Fig.2b
Gene expression Domain P0–P1 P1–P2 P2–P3 P3–P4 P4–P5
Upregulated BP Immune system
process
Regulation of multicellular organismal process
Latent virus replication Positive regulation of heart rate by epinephrine-norepinephrine
–
Immune response Regulation of multicellular organismal development
Regulation of RNA binding transcription factor activity
Positive regulation of heart rate by epinephrine
–
Inflammatory response
Animal organ morphogenesis
Modulation by host of viral RNA-binding transcription factor activity
Regulation of blood pressure –
Defense response Response to external stimulus
Modulation by host of RNA binding by virus
Positive regulation of stress
fiber assembly –
Cell surface receptor signaling pathway
Inflammatory response Regulation of DNA strand elongation
Negative regulation of smooth muscle cell migration
–
CC Plasma membrane
part
Proteinaceous extracellular matrix
Chloride channel complex Muscle thin filament tropomyosin
–
Intrinsic component of plasma membrane
Extracellular matrix Alpha DNA polymerase:primase complex
Striated muscle thin filament –
Integral component of plasma membrane
Extracellular region Ion channel complex Sarcoglycan complex –
Plasma membrane Extracellular region part Transmembrane transporter complex
Bleb –
Cell surface Extracellular space DNA replication factor a complex Filamentous actin –
MF Receptor activity Receptor binding Chloride channel activity Prostaglandin-endoperoxide
synthase activity
–
Molecular transducer activity
Integrin binding Anion channel activity Actin binding –
Signal transducer activity
Calcium ion binding Chloride transmembrane transporter activity
N -Acetylglucosamine-6-sulfatase activity
–
Signaling receptor activity
Sulfur compound binding
Alkylglycerophosphoethanolamine phosphodiesterase activity
Structural constituent
of muscle –
Chemokine activity Scavenger receptor activity
Inorganic anion transmembrane transporter activity
Arylsulfatase activity –
Downregulated BP – Cell cycle Positive regulation of heart rate by
epinephrine-norepinephrine – –
– Cell cycle process Positive regulation of heart rate by
epinephrine
– –
– Chromosome
organization
Regulation of blood pressure – –
– Mitotic cell cycle Positive regulation of stress fiber
assembly
– –
– Mitotic cell cycle
process
Negative regulation of smooth
muscle cell migration – –
CC – Chromosome Muscle thin filament tropomyosin – –
– Chromosomal part Striated muscle thin filament – –
– Chromosomal region Sarcoglycan complex – –
– Intracellular
non-membrane-bounded organelle
Bleb – –
–
Non-membrane-bounded organelle
Filamentous actin – –
established that serial passaging affects ASC gene expres-sion profiles [29]. Global gene expression profiles could therefore be used as a tool to study ASC heterogeneity at different passages. The more homogenous the cultures are at different passages, the fewer the number of DEGs will be between them.
We have investigated the effect of serial passaging on the ASC transcriptome by comparing FBS-ASC and pHPL-ASC cultures at each passage to those of the pre-vious passage. We observed that the transcriptome was
relatively stable from P2 to P5 for cells expanded in FBS and from P3 to P5 for cells expanded in pHPL as is evi-dent from the relatively low number of DEGs obtained between these passages. This suggests the ASC cultures become homogenous at the transcriptome level earlier in FBS (P2) than in pHPL (P3). Interestingly, the genes upregulated significantly in FBS-ASCs were enriched for biological processes involved in immune and inflamma-tory responses. These findings are similar to those re-ported by Kim et al., where genes involved in Table 3Top 5 enriched GO terms for significantly up- and downregulated DEGs for pHPL-ASCs between subsequent passages. Related to Fig.2b(Continued)
Gene expression Domain P0–P1 P1–P2 P2–P3 P3–P4 P4–P5
synthase activity
– Catalytic activity, acting
on DNA
Actin binding – –
– Adenyl ribonucleotide
binding N
-Acetylglucosamine-6-sulfatase
activity – –
– ATP binding Structural constituent of muscle – –
– Adenyl nucleotide
binding
Arylsulfatase activity – –
Table 4Top 5 enriched GO terms for significantly up- and downregulated DEGs for FBS-ASCs between P0 and subsequent
passages. Related to Fig.3a
Gene expression Domain P0–P1 P0–P2 P0–P3 P0–P4 P0–P5
Upregulated BP Cell migration Immune system
process
Immune system process
Immune system process
Immune system process
Immune system process
Immune response Defense response Immune response Immune response
Leukocyte migration Defense response Immune response Cell surface receptor signaling pathway
Defense response
Localization of cell Regulation of immune system process
Inflammatory response Response to stimulus Response to stimulus
Cell motility Cell surface receptor signaling pathway
Response to stimulus Defense response Cell surface receptor signaling pathway
CC Cell surface Plasma membrane Plasma membrane Plasma membrane
part
Intrinsic component of plasma membrane
Plasma membrane Cell periphery Cell periphery Intrinsic component of
plasma membrane
Plasma membrane
Cell periphery Plasma membrane
part
Plasma membrane part
Integral component of plasma membrane
Plasma membrane part
Integral component of membrane
Intrinsic component of plasma membrane
Intrinsic component of plasma membrane
Plasma membrane Integral component of plasma membrane
Extracellular region Integral component of plasma membrane
Integral component of plasma membrane
Cell periphery Cell periphery
MF Receptor binding Receptor activity Receptor activity Receptor activity Receptor binding
Chemokine activity Molecular transducer activity
Molecular transducer activity
Molecular transducer activity
Receptor activity
Receptor activity Receptor binding Chemokine activity Receptor binding Molecular transducer
activity
Cytokine activity Chemokine activity Receptor binding Peptide antigen
binding
Peptide antigen binding
Molecular transducer activity
Chemokine receptor binding
Signaling receptor activity
Chemokine activity Chemokine activity
Downregulated BP System development Anatomical structure development
System development Anatomical structure development
System development
Multicellular organism development
Multicellular organism development
Multicellular organism development
Developmental process
Developmental process
Developmental process
Anatomical structure morphogenesis
Cell adhesion Multicellular organism development
Multicellular organism development
Anatomical structure development
Nervous system development
Biological adhesion System development Anatomical structure development
Tissue development System development Developmental process
Anatomical structure morphogenesis
Anatomical structure morphogenesis
CC Vesicle Extracellular region Extracellular region
part
Extracellular region part
Extracellular region part
Extracellular region Extracellular region part
Proteinaceous extracellular matrix
Extracellular region Cell periphery
Extracellular region part
Cell periphery Extracellular region Proteinaceous
extracellular matrix
Proteinaceous extracellular matrix
Extracellular space Extracellular space Extracellular matrix Extracellular matrix Extracellular region
Cell periphery Extracellular matrix Extracellular space Extracellular space Plasma membrane
MF Glycosaminoglycan
binding
Cell adhesion molecule binding
Glycosaminoglycan binding
Sulfur dioxygenase activity
Cell adhesion molecule binding
Cell adhesion molecule binding
Neuropilin binding Heparin binding Glycosaminoglycan
binding
Cadherin binding
inflammatory and immune responses, and cell migration and homing [19], were upregulated in ASCs expanded in FBS. They further postulated that the upregulation of these genes was due to the high cell density at the time of cell harvesting and could be the reason why FBS-ex-panded ASCs might be effective in treating graft-vs-host disease and damaged tissues. On the other hand, human clinical trials that have made use of ASCs expanded in FBS have reported adverse immune responses in patients after administration [2, 6–8, 38]. This could be due to the upregulation of these inflammatory and immune re-sponse genes. Genes that were downregulated in ASCs expanded in FBS at early passages (P0 to P1) were enriched for biological processes involving tissue devel-opment. Other studies have reported similar findings [30] which may explain why differentiation into adipocytes is reduced at later passages [18,39]. Surprisingly, genes that were upregulated in pHPL-ASCs at earlier passages were also enriched for immune and inflammatory response pro-cesses. This could be due to the presence of immune cells in the early passages and may not be related to the serum used. To further explore the possible presence of immune cells in early passages (P0), we compared each passage (P1 to P5) to P0. It was observed that upregulated genes were significantly enriched for immune and inflammatory re-sponses irrespective of the supplementation used, while the downregulated genes were enriched for tissue develop-mental and cell cycle and division processes. To assess serum-specific transcriptional changes (where genes were differentially expressed based on the serum supplementa-tion used), we normalized gene expression at all other pas-sages to the passage at which the transcriptome stabilizes (P2 for FBS-ASCs and P3 for pHPL-ASCs). For FBS-ASCs, the upregulated genes were enriched for immune and in-flammatory responses; this supports the findings obtained when we compared each passage to the previous passage and each passage to P0. This may suggest that FBS-ASCs express genes that are involved in immune reactions; how-ever, the functional implications of this in clinical or in vivo settings will need to be explored further. Genes that were downregulated in FBS-ASCs were enriched for struc-ture, organ, and tissue developmental processes suggesting that ASCs have greater differentiation potential at earlier passages such as P2. For ASCs expanded in pHPL, upreg-ulated genes were enriched for DNA and RNA regulation
processes, BMP pathway signaling, and cell cycle and cell division processes. These findings suggest that prolifera-tion may not decrease with increased passaging as indi-cated by Shahdadfar et al. [15] and could provide therapeutic numbers more readily than other human al-ternatives and FBS.
ASCs showed passage and serum-specific gene expres-sion profiles. The passage-specific gene expresexpres-sion profile which is comprised of the DEGs that are common to both pHPL and FBS at each passage might reflect the in vitro serial passaging effect on the ASC transcriptome. The serum-specific gene expression signature at each passage (P1 to P5) may be reflective of the FBS or pHPL effect on the ASC transcriptome at that time period in culture (pas-sage number) during the serial expansion process.
There were 118 and 43 genes that were differentially expressed in ASCs throughout the serial expansion process in FBS and pHPL respectively. This might indi-cate an ASC transcriptome profile that is specific to the medium supplementation (FBS or pHPL) used during cell expansion, irrespective of passage number. Thus, a serum-specific signature could potentially be used to identify the medium supplement (FBS or pHPL) in which the cells were previously expanded. This in turn could inform decision making in terms of the down-stream clinical/research applications of these cells. There were fewer DEGs obtained for the pHPL-ASC-specific gene expression signature (43 genes), which is 1/3 the number of DEGS observed in FBS-ASCs (118 genes). The pHPL-ASC-specific gene expression signature was not enriched for any biological processes unlike the FBS-ASC-specific expression signature. This could mean that pHPL has no significant effect on the ASC transcriptome during in vitro serial passaging and suggests that pHPL might be a better medium supplement than FBS for in vitro cell expansion. Furthermore, downregulated genes in the FBS-ASC-specific gene expression signature were enriched for cell proliferation processes. This supports the observation that ASCs grow slower in FBS when compared to cell-expanded pHPL.
Finally, we observed that ASCs have a unique in vitro transcriptome profile, which is independent of cell pas-sage number and/or medium supplementation. This consists of a set of genes that are always expressed by ASCs in vitro at any given time in culture during the Table 4Top 5 enriched GO terms for significantly up- and downregulated DEGs for FBS-ASCs between P0 and subsequent
passages. Related to Fig.3a(Continued)
Gene expression Domain P0–P1 P0–P2 P0–P3 P0–P4 P0–P5
Sulfur compound binding
Cadherin binding Sulfur compound
binding
Cell adhesion molecule binding
Neuropilin binding
Fibronectin binding Protein tyrosine kinase activator activity
Table 5Top 5 enriched GO terms for significantly up- and downregulated DEGs for pHPL-ASCs between P0 and subsequent
passages. Related to Fig.3b
Gene expression Domain P0–P1 P0–P2 P0–P3 P0–P4 P0–P5
Upregulated BP Immune system
process
Immune system process
Immune system process
Immune system process
Immune system process
Immune response Immune response Immune response Immune response Immune response
Inflammatory response
Inflammatory response
Response to external stimulus
Response to external stimulus
Response to external stimulus
Defense response Defense response Defense response Defense response Defense response
Cell surface receptor signaling pathway
Cellular response to chemical stimulus
Cellular response to chemical stimulus
Inflammatory response Cellular response to chemical stimulus
CC Plasma membrane
part
Extracellular region Extracellular region Extracellular region Extracellular region
Intrinsic component of plasma membrane
Extracellular region part
Plasma membrane Intrinsic component of plasma membrane
Extracellular region part
Integral component of plasma membrane
Plasma membrane part
Cell periphery Integral component of
plasma membrane
Plasma membrane part
Plasma membrane Intrinsic component of plasma membrane
Intrinsic component of plasma membrane
Plasma membrane part
Extracellular space
Cell surface Extracellular space Plasma membrane part Extracellular region part
Plasma membrane
MF Receptor activity Receptor activity Receptor activity Receptor activity Receptor binding
Molecular transducer activity
Receptor binding Glycosaminoglycan binding
Molecular transducer activity
Receptor activity
Signal transducer activity
Molecular transducer activity
Molecular transducer activity
Receptor binding Molecular transducer activity
Signaling receptor activity
Glycosaminoglycan binding
Receptor binding Glycosaminoglycan
binding
Glycosaminoglycan binding
Chemokine activity Cytokine binding Sulfur compound binding
Peptide binding Signal transducer activity
Downregulated BP – Cell cycle process Anatomical structure
morphogenesis
Cell cycle process Cell cycle process
– Cell cycle Developmental process Cell division Cell division
– Mitotic cell cycle Anatomical structure
development
Anatomical structure morphogenesis
Chromosome segregation
– Mitotic cell cycle
process
System development Tissue development Nuclear chromosome segregation
– Chromosome
organization
Tissue development Mitotic cell cycle process
Sister chromatid segregation
CC – Chromosome Plasma membrane raft Spindle Chromosome,
centromeric region
– Chromosomal part Postsynapse Condensed
chromosome outer kinetochore
Condensed chromosome, centromeric region
– Chromosomal region Caveola Cytoskeleton Spindle
– Chromosome,
centromeric region
Z disc Mitotic spindle Kinetochore
– Nuclear lumen Postsynaptic density Condensed
chromosome kinetochore
Condensed chromosome kinetochore
MF – Catalytic activity,
acting on DNA
2-Aminoadipate transaminase activity
Microtubule binding ATP binding
– Protein binding Protein-lysine 6-oxidase
activity
Cell adhesion molecule binding
Adenyl ribonucleotide binding
expansion process (P1 to P5). Interestingly, some of the genes constituting this unique in vitro ASC transcrip-tome have previously been reported to be expressed by ASCs. Thus, ASCs express CXCR4 and CCR1 at both protein and mRNA levels [40]. PECAM-1 has been re-ported to be expressed by ASCs especially during early passages [41, 42]. ITGAM is another gene shown to be expressed by ASCs at low levels up to P3, and exhibits greater than 70% isoform switching between experimen-tal conditions [43]. CD53 and TREM1 have been re-ported recently as novel marker genes expressed by adipogenic progenitor preadipocyte cells and BCL6B by osteochondrogenic progenitor preadipocyte cells from mouse bone marrow [44]. Furthermore, a novel subpop-ulation of human adipose tissue-resident macrophages (ATMs) located in the interstitial spaces between adipo-cytes has been shown to express CD14, which upon cul-turing to P3 is lost, at which point the cells display an expression profile which is similar to ASCs [45]. There-fore, the expression of CD14 by ASCs in this study sug-gests the presence of a heterogeneous population of ASCs that contains this novel subpopulation of ATMs which persisted beyond P3 in culture.
The entire process of obtaining a product for clinical purposes should adhere to the GMP guidelines. The use pHPL for the expansion of ASCs in vitro is one of many steps required. In this study, we made use of defined, clinical-grade reagents and the expansion of the ASCs was performed under sterile conditions. Isolation and expansion of ASCs in a closed system to further reduce the risk of contamination would provide a robust clinical GMP-complaint process.
Conclusion
This study highlights differences in the transcriptome of ASCs expanded in pHPL versus FBS, which could be used to guide their application in the clinical setting. ASCs expanded in FBS were enriched for immune and inflammatory responses, whereas ASCs expanded in pHPL were enriched for cell cycle, proliferation, and cell division. Our findings suggest that the differentiation capacity of ASCs is likely to be greater at earlier passages and that ASCs expanded in pHPL are likely to retain
their proliferative capacity during prolonged expansion. These findings also suggest pHPL may be a superior supplement for expanding ASCs to therapeutic numbers without influencing the expression of genes involved in differentiation of specific developmental processes. Fur-thermore, we found that even though ASCs expanded in pHPL had a greater proliferation capacity, they were not enriched for genes specific to transformation. While these findings provide novel insights into potential markers for ASCs, some of the individual genes and groups of genes mentioned in this study need to be further investigated. Finally, to further compliment these findings, we believe that the proteome and the secretome of ASCs expanded in pHPL or FBS should also be studied.
Additional files
Additional file 1:ASC characterization methods and results and volcano
plots of DEGs between ASCs expanded in FBS and pHPL. ASC
morphology, immunophenotype and differentiation, results and materials and methods, and volcano plots of DEGs between ASCs expanded in FBS and pHPL. (DOCX 2659 kb)
Additional file 2:Up- and downregulated gene list for ASCs serially
expanded in FBS and pHPL. Complete list of up- and downregulated genes for ASCs serially expanded in pHPL or FBS (P0–P5). This data relates to Fig.1. (XLSX 193 kb)
Additional file 3Gene ontology terms for ASCs serially expanded in FBS
and pHPL. Complete list of enriched GO terms for ASCs serially expanded in pHPL or FBS (P0–P5). This data relates to Table1. (XLSX 1017 kb)
Additional file 4:Up- and downregulated gene list for ASCs expanded in
FBS between subsequent passages. Complete list of up- and
downregulated genes for FBS-ASCs between subsequent passages (P0 - P1, P1 - P2, P2 - P3, P3 - P4, P4 - P5). This data relates to Fig.2a. (XLSX 88 kb)
Additional file 5:Up- and downregulated gene list for ASCs expanded in
pHPL between subsequent passages. Complete list of up- and downregulated genes for pHPLASCs between subsequent passages (P0 -P1, P1 - P2, P2 - P3, P3 - P4, P4 - P5). This data relates to Fig.2b. (XLSX 58 kb)
Additional file 6Gene ontology terms for ASCs expanded in FBS
between subsequent passages. Complete list of enriched GO terms for FBSASCs between subsequent passages (P0 P1, P1 P2, P2 P3, P3 -P4, P4 - P5). This data relates to Table2. (XLSX 516 kb)
Additional file 7:Gene ontology terms for ASCs expanded in pHPL
between subsequent passages. Complete list of enriched GO terms for pHPLASCs between subsequent passages (P0 P1, P1 P2, P2 P3, P3 -P4, P4 - P5). This data relates to Table3. (XLSX 349 kb)
Additional file 8:Up- and downregulated gene list for ASCs expanded
in FBS between P0 and subsequent passages. Complete list of up- and downregulated genes for FBS-ASCs between P0 and subsequent
Table 5Top 5 enriched GO terms for significantly up- and downregulated DEGs for pHPL-ASCs between P0 and subsequent passages. Related to Fig.3b(Continued)
Gene expression Domain P0–P1 P0–P2 P0–P3 P0–P4 P0–P5
ATPase activity binding
– Chromatin binding Kynurenine
aminotransferase activity
Cytoskeletal protein binding
Microtubule binding
– ATP binding
Kynurenine-oxoglutarate transaminase activity
passages (P0 - P1, P0 - P2, P0 - P3, P0 - P4, P0 - P5). This data relates to Fig.3a. (XLSX 166 kb)
Additional file 9:Up- and downregulated gene list for ASCs expanded
in pHPL between P0 and subsequent passages. Complete list of up- and downregulated genes for pHPL-ASCs between P0 and subsequent passages (P0 - P1, P0 - P2, P0 - P3, P0 - P4, P0 - P5). This data relates to Fig.3b. (XLSX 206 kb)
Additional file 10:Gene ontology terms for ASCs expanded in FBS
between P0 and subsequent passages. Complete list of enriched GO terms for FBSASCs between P0 and subsequent passages (P0 P1, P0 -P2, P0 - P3, P0 - P4, P0 - P5). This data relates to Table4. (XLSX 1145 kb)
Additional file 11:Gene ontology terms for ASCs expanded in pHPL
between P0 and subsequent passages. Complete list of enriched GO terms for pHPLASCs between P0 and subsequent passages (P0 P1, P0 -P2, P0 - P3, P0 - P4, P0 - P5). This data relates to Table5. (XLSX 1289 kb)
Additional file 12:FBS and pHPL-ASC passage specific gene expression
profile. A complete list of genes comprising the FBS and pHPL-ASC passage specific gene expression profile. (XLSX 89 kb)
Additional file 13:FBS and pHPL-ASC medium supplementation specific
gene expression profile. A complete list of genes comprising the FBS and pHPL-ASC medium supplementation specific gene expression profile. (XLSX 67 kb)
Additional file 14:ASC gene signature irrespective of cell passage
number and/or media supplement used. A complete list of genes comprising the ASC gene signature irrespective of cell passage number and/or media supplement used. (XLSX 20 kb)
Abbreviations
ASC:Adipose-derived stromal cell; BP: Biological processes; CC: Cellular components; cRNA: Complementary RNA; DEGs: Differentially expressed genes; DNA: Deoxyribose nucleic acid; FBS: Fetal bovine serum; FS: Forward Scatter; GMP: Good manufacturing practices/processes; GO: Gene ontology; IFATS: International Federation of Adipose Therapeutics and Sciences; ISCT: Mesenchymal and Tissue Stem Cell Committee of the International Society for Cellular Therapy; MI: Molecular function; OD: Optical density; P: Passage; p/s: Penicillin/streptomycin; PBS: Phosphate buffered saline; pHPL: Pooled human platelet lysate; ss-cDNA: Single-stranded cDNA; SVF: Stromal vascular fraction;α-MEM: Modified Eagle’s medium - alpha
Acknowledgements
We would like to thank Prof. P. Coetzee (Head of Plastic Surgery, Steve Biko Academic Hospital) and Dr. D. Hoffman (private practice) for their assistance with sample collection, Stephen Marrs and the team at Heamotec (South Africa) for the consumables and donation of their equipment, and the South African National Blood Service (SANBS) for the blood products provided for the pHPL alternatives.
Authors’contributions
CD performed the in vitro experiments (isolation, expansion, and ASC characterization) and the RNA isolation. MAA performed the hybridization. CD and MAA performed the transcriptome analysis. CD, MAA, and MSP conceptualized, wrote, and edited the article. MSP obtained funding for the project. All authors read and approved the final manuscript.
Funding
This work was supported by grants from the South African Medical Research Council University Flagship Project (SAMRC-RFA-UFSP-01-2013/STEM CELLS), the SAMRC Extramural Unit for Stem Cell Research and Therapy and the Institute for Cellular and Molecular Medicine of the University of Pretoria.
Availability of data and materials
The datasets supporting the conclusions of this article are included within the article (and its additional files). The microarray data files of this study will be deposited in NCBI GEO (Gene Expression Omnibus).
Ethics approval and consent to participate
Signed informed consent was obtained prior to the procedure and approval for the study was granted by the University of Pretoria Health Sciences Research Ethics Committee (approval number 421/2013).
Consent for publication Not applicable.
Competing interests
The authors declare that they have no competing interests.
Author details 1
Department of Immunology, Institute for Cellular and Molecular Medicine, SAMRC Extramural Unit for Stem Cell Research and Therapy, Faculty of Health Sciences, University of Pretoria, PO Box 2034, Pretoria 0001, South Africa.2Department of Oral Pathology and Oral Biology, School of Dentistry, Faculty of Health Sciences, University of Pretoria, PO Box 1266, Pretoria 0001, South Africa.
Received: 15 June 2019 Revised: 31 July 2019 Accepted: 1 August 2019
References
1. Toyserkani NM, Jørgensen MG, Tabatabaeifar S, Harken Jensen C, Sheikh SP, Sørensen JA. Concise review: a safety assessment of adipose-derived cell therapy in clinical trials: a systematic review of reported adverse events. Stem Cells Transl Med. 2017;6(9):1786–94.
2. Riis S, Zachar V, Boucher S, Vemuri MC, Pennisi CP, Fink T. Critical steps in the isolation and expansion of adipose-derived stem cells for translational therapy. Expert Rev Mol Med. 2015;17:1–11 Available from:http://www. journals.cambridge.org/abstract_S1462399415000101.
3. Gimble JM, Ray SP, Zanata F, Wade J, Khoobehi K, Wu X, et al. Adipose derived cells and tissues for regenerative medicine. ACS Biomater Sci Eng. 2016;acsbiomaterials.6b00261. Available from:http://pubs.acs.org/doi/abs/1 0.1021/acsbiomaterials.6b00261
4. Dykstra JA, Facile T, Patrick RJ, Francis KR, Milanovich S, Weimer JM, et al. Concise review: fat and furious: harnessing the full potential of adipose-derived stromal vascular fraction. Stem Cells Transl Med. 2017;6:1096–108. 5. Zuk PA, Zhu M, Mizuno H, Huang J, Futrell JW, Katz AJ, et al. Multilineage cells
from human adipose tissue: implications for cell-based therapies. Tissue Eng. 2001;7:211–28 Available from:http://www.ncbi.nlm.nih.gov/pubmed/11304456. 6. Dessels C, Potgieter M, Pepper MS. Making the switch: alternatives to fetal bovine serum for adipose-derived stromal cell expansion. Front Cell Dev Biol. 2016;4:1–10 Available from:http://journal.frontiersin.org/article/10.3389/fcell.2016.00115/full. 7. Sundin M, Ringdén O, Sundberg B, Nava S, Götherström C, Le Blanc K. No
alloantibodies against mesenchymal stromal cells, but presence of anti-fetal calf serum antibodies, after transplantation in allogeneic hematopoietic stem cell recipients. Haematologica. 2007;92:1208–15.
8. Lalu MM, McIntyre L, Pugliese C, Fergusson D, Winston BW, Marshall JC, et al. Safety of cell therapy with mesenchymal stromal cells (SafeCell): a systematic review and meta-analysis of clinical trials. PLoS One. 2012;7:e47559. 9. Becherucci V, Piccini L, Casamassima S, Bisin S, Gori V, Gentile F, Ceccantini
R, De Rienzo E, Bindi B, Pavan P, et al. Human platelet lysate in
mesenchymal stromal cell expansion according to a GMP grade protocol: a cell factory experience. Stem Cell Res Ther. 2018;9(1):124.
10. Koellensperger E, Bollinger N, Dexheimer V, Gramley F, Germann G, Leimer U. Choosing the right type of serum for different applications of human adipose tissue-derived stem cells: influence on proliferation and differentiation abilities. Cytotherapy. 2014;16:789–99 [cited 2014 Oct 16] Available from:http://www.ncbi.nlm.nih.gov/pubmed/24642018. 11. Trojahn Kølle S-F, Fischer-Nielsen A, Mathiasen AB, Elberg JJ, Oliveri RS,
Glovinski PV, et al. Enrichment of autologous fat grafts with ex-vivo expanded adipose tissue-derived stem cells for graft survival: a randomised placebo-controlled trial. Lancet. 2013;382:1113–20 [cited 2014 Oct 7] Available from:http://www.ncbi.nlm.nih.gov/pubmed/24075051.
12. Glovinski PV, Herly M, Mathiasen AB, Svalgaard JD, Borup R, Talman MLM, et al. Overcoming the bottleneck of platelet lysate supply in large-scale clinical expansion of adipose-derived stem cells: a comparison of fresh versus three types of platelet lysates from outdated buffy coat-derived platelet concentrates. Cytotherapy. 2017;19:222–34 Available from:https://doi.org/1 0.1016/j.jcyt.2016.10.014.
International So. Cytotherapy. 2013;15:641–8 [cited 2013 Jun 16] Available from:http://www.ncbi.nlm.nih.gov/pubmed/23570660.
14. Riis S, Nielsen F, Pennisi C, Zachar V, Fink T. Comparative analysis of media and supplements on inititation and expansion of adipose-derived stem cells. Stem Cells Transl Med. 2016;5:314–24.
15. Shahdadfar A, Frønsdal K, Haug T, Reinholt FP, Brinchmann JE. In vitro expansion of human mesenchymal stem cells: choice of serum is a determinant of cell proliferation, differentiation, gene expression, and transcriptome stability. Stem Cells. 2005;23:1357–66 Available from:http:// www.ncbi.nlm.nih.gov/pubmed/16081661.
16. Trojahn Kølle S, Oliveri RS, Glovinski PV, Kirchhoff M, Mathiasen AB, Elberg JJ, et al. Pooled human lysate versus fetal bovine serum—investigating the proliferation rate , chromosome stability and angiogenic potential of human adipose tissueederived stem cells intended for clinical use. Cytotherapy. 2013; 15:1086–97 Available from:https://doi.org/10.1016/j.jcyt.2013.01.217. 17. Tratwal J, Follin B, Ekblond A, Kastrup J, Haack-Sørensen M.
Identification of a common reference gene pair for qPCR in human mesenchymal stromal cells from different tissue sources treated with VEGF. BMC Mol Biol. 2014;15:1–11.
18. Ambele MA, Dessels C, Durandt C, Pepper MS. Genome-wide analysis of gene expression during adipogenesis in human adipose-derived stromal cells reveals novel patterns of gene expression during adipocyte differentiation. Stem Cell Res. 2016;16:725–34 Available from: http://www. embase.com/search/results?subaction=viewrecord&from=export&id= L610015569%5Cn; http://dx.doi.org/10.1016/j.scr.2016.04.011%5Cn; http:// mun-primo.hosted.exlibrisgroup.com/openurl/01MUN/01MUN_ SERVICES?sid=EMBASE&issn=18767753&id=doi:10.1016/j.scr.2016.04. 19. Kim DS, Lee MW, Yoo KH, Lee T-H, Kim HJ, Jang IK, et al. Gene expression
profiles of human adipose tissue-derived mesenchymal stem cells are modified by cell culture density. PLoS One. 2014;9:e83363 Available from: http://www.pubmedcentral.nih.gov/articlerender.fcgi?artid=3882209&tool= pmcentrez&rendertype=abstract.
20. van Vollenstee FA, Dessels C, Kallmeyer K, de Villiers D, Potgieter M, Durandt C, et al. Isolation and characterization of adipose-derived stromal cells. In: Van Pham P, editor. Stem Cell Process. Cham: Springer International Publishing; 2016. p. 131–61. Available from:https://doi.org/10.1007/978-3-319-40073-0_7. 21. Schallmoser K, Strunk D. Generation of a pool of human platelet lysate and
efficient use in cell culture. Methods Mol Biol. 2013;946:349–62 Available from:http://link.springer.com/protocol/10.1007/978-1-62703-128-8_22. 22. Dessels C, Durandt C, Pepper MS. Comparison of human platelet lysate
alternatives using expired and freshly isolated platelet concentrates for adipose-derived stromal cell expansion. Platelets. 2018;00:1–12 Available from:https://www.tandfonline.com/doi/full/10.1080/09537104.2018.1445840. 23. Irizarry RA, Bolstad BM, Collin F, Cope LM, Hobbs B, Speed TP. Summaries of
Affymetrix GeneChip probe level data. Nucleic Acids Res. 2003;31:e15. 24. Reimand J, Arak T, Adler P, Kolberg L, Reisberg S, Peterson H, et al. G: profiler-a web server for functional interpretation of gene lists (2016 update). Nucleic Acids Res. 2016;44:W83–9.
25. Kocaoemer A, Kern S, Klüter H, Bieback K, Kluter H. Human AB serum and thrombin-activated platelet-rich plasma are suitable alternatives to fetal calf serum for the expansion of mesenchymal stem cells from adipose tissue. Stem Cells. 2007;25:1270–8 Available from:http://www.ncbi.nlm.nih.gov/pubmed/17255520. 26. Van Der Valk J, Brunner D, De Smet K, Fex Svenningsen A, Honegger P, Knudsen LE, et al. Optimization of chemically defined cell culture media--replacing fetal bovine serum in mammalian in vitro methods. Toxicol Vitr. 2010;24:1053–63 [cited 2013 may 23] Available from:http://www.ncbi.nlm.nih.gov/pubmed/20362047. 27. Fink T, Lund P, Pilgaard L, Rasmussen JG, Duroux M, Zachar V. Instability of
standard PCR reference genes in adipose-derived stem cells during propagation, differentiation and hypoxic exposure. BMC Mol Biol. 2008;9:1–9 Available from:http://www.biomedcentral.com/1471-2199/9/98.
28. Crespo-diaz R, Behfar A, Butler GW, Padley DJ, Sarr MG, Bartunek J, et al. Platelet lysate consisting of a natural repair proteome supports human mesenchymal stem cell proliferation and chromosomal stability. Cell Transplant. 2011;20:797–811.
29. Schallmoser K, Bartmann C, Rohde E, Bork S, Guelly C, Obenauf AC, et al. Replicative senescence-associated gene expression changes in mesenchymal stromal cells are similar under different culture conditions. Haematologica. 2010;95:867–74 [cited 2013 Jun 10] Available from:http:// www.pubmedcentral.nih.gov/articlerender.fcgi?artid=2878782&tool= pmcentrez&rendertype=abstract.
30. Wagner W, Wein F, Seckinger A, Frankhauser M, Wirkner U, Krause U, et al. Comparative characteristics of mesenchymal stem cells from human bone marrow, adipose tissue, and umbilical cord blood. Exp Hematol. 2005;33:1402–16. 31. Cho K-A, Park M, Kim Y-H, Woo S-Y, Ryu K-H. RNA sequencing reveals a
transcriptomic portrait of human mesenchymal stem cells from bone marrow, adipose tissue, and palatine tonsils. Sci Rep. 2017;7:17114 Available from:http://www.nature.com/articles/s41598-017-16788-2.
32. Baer PC, Geiger H. Adipose-derived mesenchymal stromal / stem cells: tissue localization, characterization, and heterogeneity. Stem Cells Int. 2012; 1–11. Available from:http://www.ncbi.nlm.nih.gov/pubmed/22577397. 33. Perrini S, Ficarella R, Picardi E, Cignarelli A, Barbaro M, Nigro P, Peschechera
A, Palumbo O, Carella M, De Fazio M, et al. Differences in gene expression and cytokine release profiles highlight the heterogeneity of distinct subsets of adipose tissue-derived stem cells in the subcutaneous and visceral adipose tissue in humans. PloS one. 2013;8(3):e57892–e57892.
34. Wagner W, Feldmann RE, Seckinger A, Maurer MH, Wein F, Blake J, et al. The heterogeneity of human mesenchymal stem cell preparations - evidence from simultaneous analysis of proteomes and transcriptomes. Exp Hematol. 2006;34:536–48.
35. Bruder SP, Jaiswal N, Haynesworth SE. Growth kinetics, self-renewal, and the osteogenic potential of purified human mesenchymal stem cells during extensive subcultivation and following cryopreservation. J Cell Biochem. 1997; 64:278–94 Available from:http://www.ncbi.nlm.nih.gov/pubmed/9027588. 36. Donnenberg AD, Meyer EM, Rubin JP, Donnenberg VS. The cell-surface proteome of cultured adipose stromal cells. Cytom Part A J Int Soc Anal Cytol Int Soc Anal Cytol. 2015;665–74. Available from:http://www.ncbi.nlm. nih.gov/pubmed/25929697.
37. Januszyk M, Rennert R, Sorkin M, Maan Z, Wong L, Whittam A, et al. Evaluating the effect of cell culture on gene expression in primary tissue samples using microfluidic-based single cell transcriptional analysis. Microarrays. 2015;4:540– 50 Available from:http://www.mdpi.com/2076-3905/4/4/540/.
38. Horwitz EM, Le Blanc K, Dominici M, Mueller I, Slaper-Cortenbach I, Marini FC, et al. Clarification of the nomenclature for MSC: the International Society for Cellular Therapy position statement. Cytotherapy. 2005;7:393–5. 39. Safwani WKZW, Makpol S, Sathapan S, Chua K. Impact of adipogenic
differentiation on stemness and osteogenic gene expression in extensive culture of human adipose-derived stem cells. Arch Med Sci. 2014;10:597– 606 Available from:http://www.pubmedcentral.nih.gov/articlerender. fcgi?artid=4107265&tool=pmcentrez&rendertype=abstract. 40. Baek SJ, Kang SK, Ra JC. In vitro migration capacity of human adipose
tissue-derived mesenchymal stem cells reflects their expression of receptors for chemokines and growth factors. Exp Mol Med. 2011;43:596–603 Available from:https://www.ncbi.nlm.nih.gov/pubmed/21847008. 41. Panina YA, Yakimov AS, Komleva YK, Morgun AV, Lopatina OL, Malinovskaya
NA, et al. Plasticity of adipose tissue-derived stem cells and regulation of angiogenesis. Front Physiol. 2018;9:1656 Available from:https://www.ncbi. nlm.nih.gov/pubmed/30534080.
42. Huang SJ, Fu RH, Shyu WC, Liu SP, Jong GP, Chiu YW, et al. Adipose-derived stem cells: isolation, characterization, and differentiation potential. Cell Transplant. 2013;22:701–9.
43. Mieczkowska A, Schumacher A, Filipowicz N, Wardowska A, Zieliński M, Madanecki P, et al. Immunophenotyping and transcriptional profiling of in vitro cultured human adipose tissue derived stem cells. Sci Rep. 2018;8: 11339 Available from:https://doi.org/10.1038/s41598-018-29477-5. 44. Ambrosi TH, Scialdone A, Graja A, Gohlke S, Jank A-M, Bocian C, et al. Adipocyte
accumulation in the bone marrow during obesity and aging impairs stem cell-based hematopoietic and bone regeneration. Cell Stem Cell. 2017;20:771–84 e6. Available from:https://www.ncbi.nlm.nih.gov/pubmed/28330582.
45. Eto H, Ishimine H, Kinoshita K, Watanabe-Susaki K, Kato H, Doi K, et al. Characterization of human adipose tissue-resident hematopoietic cell populations reveals a novel macrophage subpopulation with CD34 expression and mesenchymal multipotency. Stem Cells Dev. 2013;22:985–97 Available from:https://www.ncbi.nlm.nih.gov/pubmed/23137270.
Publisher’s Note