Increase of an introduced bird competitor in
old-growth forest associated with restoration
Leonard A. Freed1, Rebecca L. Cann2
1 Department of Biology, University of Hawaii at Manoa, 2450 Campus Road, Dean Hall 2, Honolulu, Ha-waii 96822 2 Department of Cell and Molecular Biology, University of Hawaii at Manoa, 1960 East-West Road, Honolulu, Hawaii 96822
Corresponding author:Leonard A. Freed ([email protected])
Academic editor:Daniel Sol | Received 15 February 2011 | Accepted 17 May 2012 | Published 23 May 2012 Citation: Freed LA, Cann RL (2012) Increase of an introduced bird competitor in old-growth forest associated with restoration. NeoBiota 13: 43–60. doi: 10.3897/neobiota.13.2946
Abstract
Many successful invasions involve long initial periods in which the invader exists at low densities fol-lowed by sudden population increases. The reasons for such time-lags remain poorly understood. Here
we document a sudden increase in density of the introduced Japanese white-eye (Zosterops japonicus) in
a restoration area contiguous with old-growth forest at Hakalau Forest National Wildlife Refuge on the Island of Hawaii. The refuge, with very high density of native birds, existed in a pocket of low white-eye density that persisted for at least 20 years since the late 1970s. The refuge began an extensive native trees restoration project in 1989 within a 1314 ha abandoned pasture above old-growth forest. This area was soon colonized by white-eyes and their population grew exponentially once the trees had grown tall enough to develop a canopy. This increase was in turn followed by significantly more white-eyes in the open and closed forests adjacent to the restoration area. Competition between white-eyes and native spe-cies was documented on study sites within these forests. Density data indicate that competition was more widespread, with loss of tens of thousands of native birds in the 5371 ha area surveyed. Our results are consistent with the view that ecological barriers may delay the population increase of invaders and that human-derived activities may help invaders cross these barriers by creating new ecological opportunities. Control of white-eye numbers may be essential for recovery of native species.
Keywords
Introduced bird, restoration, exponential population growth, propagule pressure, biotic resistance, com-petition, time-lag
Introduction
When introduced into novel environments, some invaders increase rapidly in the new location, while others experience time-lags of various lengths (Roughgarden 1986, Williamson 1996, Blackburn et al. 2009). The causes of the time-lags are not well un-derstood (Crooks 2005), but some explanations have been advanced (summarized by Crooks and Soule 1999). Most explanations focus on demographic factors (e.g. Allee effects; Taylor and Hastings 2005, Tobin et al. 2007), and evolutionary factors (genetic changes for adapting to the novel environment or increased competitive ability; Sakai et al. 2001, Kolbe et al. 2004, Hufbauer and Torchin 2007). Nevertheless, it is also possible that some invaders remain at low numbers due to biotic or environmental factors, like diffuse competition or unfavorable climatic conditions. These cases can be detected when the factors limiting population growth no longer exist. The goal of this study is to document an avian invasion where the population exhibited a time-lag that lasted over 20 years and then suddenly increased in numbers when environmental conditions changed due to a native trees restoration project. That invasion eventually led to increased density off-site with strong negative impacts to native bird species.
Restoration is a human-derived environmental change that is known to provide ecological opportunities in habitat for plants and animals (D’Antonio and Meyerson 2002), similar to what happens during succession (Connell and Slayter 1977). Conse-quently, restoration can also attract invasive animals. While the existence of ecological opportunities should trigger the increase of the invader population, in restoration areas time-lags may arise associated with growth of plants, analogous to animals that become more abundant in later seral stages of succession. In addition, nearby mature habitat can be affected if the propagule pressure from the restoration area is strong enough to overwhelm biotic resistance (Hollebone and Hay 2005, Lockwood et al. 2005, von Holle and Simberloff 2005).
This paper focuses on the invasion of Hakalau Forest National Wildlife Refuge (Mauna Kea, Island of Hawaii) by the Japanese white-eye (Zosterops japonicus), a pas-serine bird native to Asia. The white-eye was intentionally introduced to the Island of Oahu in 1929 to control insects (Caum 1933). It was later introduced to the Island of Hawaii in 1937 (Foster 2009), where Baldwin (1953), Dunmire (1962), and Banko and Banko (1980) documented an explosive increase in numbers and range. During the Hawaii Forest Bird Survey conducted in the late 1970s, the white-eye was the most common bird in the state and was found in every forest (Scott et al. 1986). There was no documented lag time for its increase after the introduction.
of diffuse competition (MacArthur 1972). In 1989 and following years, over 400,000
Acacia koa seedlings were planted in abandoned pasture above the old-growth forest.
Seedlings were about 4 months old and 20 cm high, but by 5 years some trees had achieved heights of 8 m (Scowcroft and Jeffrey 1999), with a canopy that sustained arthropods and provided sufficient cover for thermal protection during cold nights at upper elevation.
Our goal is to describe how the refuge restoration area brought a sudden increase in white-eye density, and to ask whether this sudden increase may explain the recent increase of the invader in adjacent open and closed forests with native birds. Docu-menting the increased density of white-eyes throughout the refuge is particularly rel-evant given the diverse evidence that the species is negatively affecting native birds (Freed et al. 2008a, 2009; Freed and Cann 2009, 2012), and the possibility that the problems extend well beyond our study areas. We deal with this by also documenting changes in density of native species throughout the refuge.
Methods
Hakalau Forest National Wildlife Refuge (Fig. 1) consists mainly of old-growth ohia-lehua/koa (Metrosideros polymorpha/Acacia koa) forest (Freed 2001). Bird surveys were conducted in the three main areas with transects indicated in Fig 2. The 3373 ha open forest area was formerly a cattle ranch so the understory is a matrix of patches of ferns and woody plants surrounded by expansive swatches of introduced pasture grasses. However, the old-growth forest remains in the form of many ohia-lehua trees, including large specimens, and large koa trees that provide nesting sites and forag-ing substrates for all species of native and introduced birds (Freed 2001, Freed et al. 2008a). Ohia-lehua comprise over 90% of the forest canopy (Freed et al. 2008a), and arthropods have been collected and analyzed from twigs and foliage (Freed et al. 2007). Below the open forest is the 1998 ha closed forest area with similar canopy trees and bird species, but with more native understory plants. Above part of the open forest area is the 1314 ha restoration area that had been extensively cleared for pasture more than 100 years ago (Tomonari-Tuggle 1996).
Figure 1. Maps of distribution and abundance of the endangered Hawaii akepa (Loxops coccineus coc-cineus) (left) and introduced Japanese white-eye (right) in the windward Hawaii study area from the Hawaii Forest Bird Survey conducted in the late 1970s (Scott et al. 1986). Darker colors indicate higher density. The pocket of low white-eye density contains the southern portion of Hakalau Forest National Wildlife Refuge. That pocket contains most of the Mauna Kea population of the akepa and other native
birds. The small high density area of akepa A (401–800 birds/km2) almost perfectly matches a very low
density of white-eyes 11–50 and 51–100 birds/km2). The habitat around the area is identical old-growth
forest, so habitat selection is not involved. The area to the north where the akepa is vanishingly rare
B (1–10 birds/km2) corresponds to an area with very high white-eye density (400–800, 801–1600 birds/
km2). The isolated akepa populations to the south C on Mauna Loa (101–200 birds/km2), are in areas
with low density of white-eyes (11–50, 51–100 birds/km2). These data contrast with Mountainspring and
Scott (1985), who documented a positive relationship between white-eye and akepa densities. The dark rectangular section of high white-eye density in the lower right contains Hawaii Volcanoes National Park, from which the akepa and many other native birds disappeared during the years 1940–1970 when the white-eye increased explosively (Dunmire 1962, Baldwin 1953, Banko and Banko 1980). Avian malaria may also have played a role (van Riper et al 1986). Modified from Scott et al. (1986), with permission from the Cooper Ornithological Society.
the models (Burnham and Anderson 2002). S-Plus 8.2 (TIBCO Software) was used for all statistical analyses.
For the open forest area, we also used a randomization test for a stepwise increase during 1988–1999 and 2000–2007. The time periods were based on mist-netting that indicated a stepwise increase beginning in 2000 (Freed et al. 2008a). For this test we eliminated the extreme outlier in 1987 (Fig. 3), justified because this was the first year that surveys were conducted on the refuge, and the outlier value was not corroborated by mist-netting in the open forest site (Freed et al. 2008a). We ran 10,000 permuta-tions and used a two-sided test.
We determined the order of increase between areas in two ways. For the resto-ration area and the open forest area, we compared slopes of regressions of density on year for 1988–2000. This time period was selected because it occurred before the stepwise increase from mist-netting. A significant slope in the restoration area but not in the open forest area would establish order. For the open forest area and closed forest area, we compared sequential differences in density from 1999 to 2000 and to 2001 in relation to the standard errors of the estimates. We deter-mined if the differences between years were greater than two standard errors of
Figure 2. Portion of Hakalau Forest National Wildlife Refuge that was surveyed, relative to aerial
pho-tograph A and configuration of restoration, open forest, and closed forest areas B based on Camp et al.
those differences, indicating growth, or no growth if the differences were less than two standard errors.
We use functional data analysis (Ramsey and Silverman 1997, Murtaugh 2007) to document change in numbers of native birds between 2000 and 2007, using survey data from Camp et al. (2009). This type of analysis uses a function of the data, rather than all of the raw data, for statistical analysis that is readily interpretable. For example, growth of individuals can be analyzed through repeated measures analysis of variance, regression of size over time, or estimation of parameters of growth models like the von Bertalanffy. An even simpler function of growth data is the change between an early point and a later point in time. The change can be evaluated by the difference in values and variation associated with each value. We apply this simple function to survey data, using values from the beginning and end of a time interval, to determine if a significant change in numbers had occurred during that interval.
This function tests the same hypothesis as regression, change over time, and it is particularly relevant for documenting the consequences of an environmental change. Unlike regression, the functional data analysis is not constrained by constant change per unit time, or by the location of the intercept relative to the data. There is no theory in population dynamics that predicts constant rate of change. The analysis can also es-timate the magnitude of change using basic mathematical properties of mean and vari-ance of sums and differences of random variables (DeGroot and Schervish 2002), and can calculate 95% confidence intervals of the differences in values at each end of the time interval. We use this approach to compare the number of species with significant changes compared with the two from piecewise regression (Freed and Cann 2010).
The two endpoints we compare are densities in 2000 and 2007. The year 2000 is the first year of an environmental change (Freed et al. 2008a; Freed and Cann 2009, 2012). The year 2007 is the last year of available data. To guard against anomalously large or small values at endpoints, we average the endpoints with values from sur-rounding years, using years 1999, 2000, and 2001 to calculate the mean density of the initial endpoint, years 2006 and 2007 for the mean density at the end of the series. Each density value has a variance, which integrates spatial variability, uncertainty of de-tection, detections at station center, and model fit from Program Distance (Buckland et al. 1993). Camp et al. (2009) reported the square root of that variance as standard error, which is really the standard deviation, so we square that value to calculate the variance of each point and then use properties of variance of sum of random variables to calculate the variance at each end of the time series. Then the difference in mean density was calculated along with variance of the difference. For each species, we cal-culated 95% confidence intervals from variance of the difference in density to assess significance of change in density.
We illustrate with this method the decline in the open forest area of the iiwi (
Ves-tiaria coccinea), currently a species of concern in the process of being listed as
were 0.0641, 0.890, and 0.722 for years 1999–2001 and 0.0766 and 0.0634 for years 2006–2007. Squaring these gives the variances.Then, the sum of variances for each set of years is calculated using the following property of variance of the sum of independ-ent random variables: Var(a1X1 + ... + anXn) = a12Var(X
1) + ... + an2Var(Xn), where the ai are coefficients. The mean is the sum of random variables with the ai equal to 1/n, where n is the sample size. For the iiwi, the means are the sum of independent random variables X1/3 + X2/3 + X3/3 for 1999–2001 and X1/2 + X2/2 for 2006–2007. Therefore the variance of the mean random variables are (0.0041 + 0.7921 + 0.5213)/9 = 0.1464 for 2000 and (0.0059 + 0.0040)/4 = 0.0002 for 2007. Then, the difference between the means, 20.14 - 11.85 = 8.29 becomes a new random variable representing the decline. The variance of the difference between independent random variables is the same as the variance of the sum. Thus the variance of the difference is 0.1464 + 0.0002 = 0.1466. Taking the square root gives the standard error of the difference as 0.3829. Twice the standard error on either side of the 8.29 birds/ha difference between 2000 and 2007 gives the 95% confidence interval of (7.52, 9.06). Because the confidence interval does not include 0, we can conclude that a significant decline has occurred in the open forest area. The extent of the decline can be estimated by multiplying the 8.29 birds/ha change by the 3373 ha area.
We use this same methodology to document the white-eye increase in the closed forest area. For the open forest area, we use the difference in means established by the randomization test, and then calculate the variances associated with the standard de-viations from all years during 1988–1999 and 2000–2007. Then the 95% confidence interval was calculated as specified for 2000 and 2007.
For community-wide changes in each survey area, we took covariance among spe-cies into account. We used the variance of densities of all 8 native spespe-cies during 2000– 2007 plus the covariance of densities from all pairs of native species those same years, according to the standard statistical formula Var(X+Y) = Var(X) + Var(Y) + 2Cov(X,Y), extended to 8 species. From this total, the 95% confidence interval of variances of the difference in density in the community was calculated.
Results
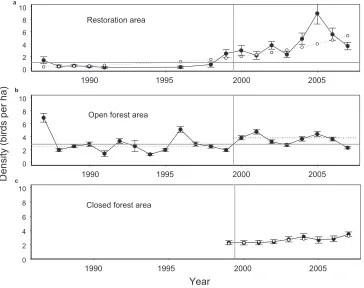
Restoration area. White-eyes increased in the restoration area, especially from 1999 to
Open forest area. White-eyes also increased in the open forest area where they pre-viously existed at lower density (Fig. 3b). Linear regression did not reveal the increase (slope = 0.01 ± 0.05, R2 = 0.004, p = 0.78). However, residuals had significant lack of fit, indicated by 2/13 positive residuals during 1987–1999 and 6/8 positive residuals during 2000–2007 (test of proportions, p = 0.023). The exponential regression model had adequate fit (runs of maximum length 3) but was not significant (parameter = 0.01 ± 0.02, R2 = 0.035, p = 0.49). Nevertheless, the randomization test clearly indicated a higher mean density during years 2000–2007 (critical value for 0.975 quantile = 0.97, observed difference = 1.05), consistent with a stepwise increase that could not be mod-eled with linear or exponential regression.
Closed forest area. White-eye density also increased in the closed forest area, where
the birds had previously existed at low density (Fig. 3c). Both linear and exponential models were supported (linear: slope = 0.13 ± 0.03, R2 = 0.74, p = 0.003; exponential: parameter = 0.05 ± 0.01, R2 = 0.77, p = 0.002), had adequate fit by runs of signed residuals, and were indistinguishable (ΔAICc exponential = 0, linear = 0.16).
0 2 4 6 8 10
1990 1995 2000 2005
a
b
0 2 4 6 8 10
1990 1995 2000 2005
0 2 4 6 8 10
1990 1995 2000 2005
Year
Density (birds per ha) c
Restoration area
Open forest area
Closed forest area
Figure 3. Long-term patterns of Japanese white-eye density with standard error in: a restoration area
b open forest area, and c closed forest area. Fitted values from the best model (deviation) are shown
Order of increase among areas. During years 1988–2000, density increased in the restoration area (slope = 0.6, se = 0.06, p = 0.04), but not the open forest area (slope = 0.08, se = 0.08, p = 0.33). Thus the increase began in the restoration area before the open forest area. Changes in density during the years 1999–2001 were significant in the open forest area (1.90 ± 0.79, 2.82 ± 0.85), but not in the closed forest area (0.01 ± 0.42, 0.03 ± 0.85). The overall order of increase was from the restoration to the open forest to the closed forest area (Fig. 3).
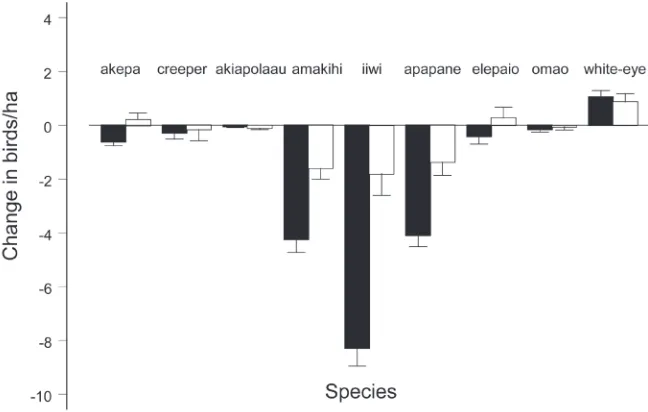
Changes in native birds in the forested areas. Figure 4 shows significant declines in native
birds the same years that the white-eye was increasing in both the open and closed forest areas. The declines in the closed forest area were smaller than those estimated in the open forest area (Fig. 4, paired t = 2.15, df =7, p = 0.034). However, the high correlation between changes in density in the two forest areas (cor = 0.93, p = 0.0003), including white-eyes, indicates that the pattern of changes among native species and white-eyes was similar in the open and closed forest areas. Table 1 shows that tens of thousands of native birds perished even under the most optimistic scenario. Based on mean 2000 densities times 3373 ha, there were approximately 166,927 native birds in the open forest area. The loss of 61,289 birds represents a 37% decline, ranging from 51 to 22%. The closed forest area had 86,653 birds with a loss of 9091, representing a 10% decline. The white-eye was the only bird that significantly increased in each area (Fig. 4, Table 1).
Figure 4. Change in densities with standard error of native birds and Japanese white-eyes in the open for-est area (black bars) and closed forfor-est area (white bars), between 2000 and 2007. Native passerine species present throughout the closed forest area and the southern section of the open forest area were Hawaiian
honeycreepers: Hawaii akepa (Loxops coccineus coccineus), Hawaii creeper (Oreomystis mana), akiapolaau
(Hemignathus munroi), Hawaii amakihi (Hemignathus virens virens), iiwi (Vestiaria coccinea), and apapane (Himatione sanguinea); Monarchine flycatcher: Hawaii elepaio (Chasiempis sandwichensis ridgwayi); and
Discussion
Land that became Hakalau Forest National Wildlife Refuge existed for years in a pocket of low white-eye density, especially in the southern end with the intact bird community (Scott et al. 1986). There are several reasons why the invader remained at such low densities. Because white-eyes exhibit substantial overlap in the foraging niche with all native species, invader numbers may have remained low due to biotic resist-ance. Alternatively, conditions in the forested areas may have been sub-optimal for the invader. Calculation of the deterministic rate of population growth was 0.97 with an assumption of breeding success of 0.6 (Freed et al. 2008a), indicating that limited immigration might have been necessary to maintain numbers. Nevertheless, when the pasture land above the forest became a restoration area, the white-eye colonized that area and eventually grew exponentially in it. The bird then increased in density in the contiguous open forest area followed by the more distant closed forest area. Substantial
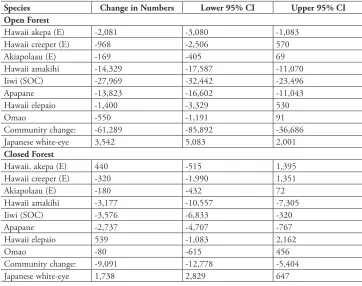
table 1. Changes in numbers between 1999–2001 and 2006–2007 in open and closed forest (Fig. 1), based on changes in density multiplied by area (ha). Endangered species (E), species of concern (SOC). Confidence intervals for species are based on two standard errors of changes in density. Confidence inter-vals for community change are based on two standard errors of the sum of variances and twice the sum of covariances of all native species densities from 2000 through 2007.
Species Change in Numbers Lower 95% CI Upper 95% CI
Open Forest
Hawaii akepa (E) -2,081 -3,080 -1,083
Hawaii creeper (E) -968 -2,506 570
Akiapolaau (E) -169 -405 69
Hawaii amakihi -14,329 -17,587 -11,070
Iiwi (SOC) -27,969 -32,442 -23,496
Apapane -13,823 -16,602 -11,043
Hawaii elepaio -1,400 -3,329 530
Omao -550 -1,191 91
Community change: -61,289 -85,892 -36,686
Japanese white-eye 3,542 5,083 2,001
Closed Forest
Hawaii. akepa (E) 440 -515 1,395
Hawaii creeper (E) -320 -1,990 1,351
Akiapolaau (E) -180 -432 72
Hawaii amakihi -3,177 -10,557 -7,305
Iiwi (SOC) -3,576 -6,833 -320
Apapane -2,737 -4,707 -767
Hawaii elepaio 539 -1,083 2,162
Omao -80 -615 456
Community change: -9,091 -12,778 -5,404
decline in native birds in the open forest area and lesser declines in the closed forest area followed. There are many issues concerning numbers and impacts.
Increase of white-eye numbers. The restoration is a clear example of a human activity
that increases ecological opportunities for an introduced species that otherwise should have remained at low numbers. The restoration also offered opportunities for three native species (Camp et al. 2010). The Hawaii amakihi (Hemignathus virens virens), the most generalized native bird, was growing exponentially at comparable densities with the white-eye. The iiwi and apapane (Himatione sanguinea) populations were growing linearly and had much lower densities than the white-eye and amakihi during 2004–2007 (Camp et al. 2010). But unlike the white-eye, these three native species were significantly declining throughout the old-growth forest after 2000 (Fig. 4).
The increase of white-eyes in the open forest area seems to be due more to immi-gration from the restoration area than to in situ reproduction. This is because juvenile survival dropped from 0.27 to 0 for all years during the increase (Freed et al. 2008a). The order of increase excludes the closed forest area as the source of necessary prop-agules. Given no other land use change near the refuge, it is most likely that white-eyes came from the restoration area. The exponentially growing population may have exceeded carrying capacity each year after 1999, set in part by native species whose populations were also increasing in the restoration area. The excess white-eyes over car-rying capacity may have immigrated into the old-growth forest below.
However, the 0 juvenile survival of white-eyes was not associated with lower mass (Freed et al. 2008a), and is thus contrary to the general pattern in birds of lower mass resulting in lower juvenile survival (Medeiros and Freed 2009). Juveniles produced in the open forest area may have dispersed along a path of least resistance toward the lower density closed forest area. The increase in that area otherwise contradicts the as-sumption that the white-eye prefers open habitats in Hawaii (Scott et al. 1986) and in the Bonin Islands (Kawagami and Higuchi 2003), although preference for one habitat does not preclude preference for other habitats. The exponential increase in the closed forest at Hakalau either confirms the renowned ability of the entire family Zosteropi-dae for range and niche expansion (Scott et al 2003, Moyle et al. 2009), or simply resulted from dispersal of juveniles from the open forest or restoration areas.
while the endangered Hawaii akepa was declining in the southern-most transects 1–4 (Fig. 2), where akepa density was highest (Fig. 1), but this pattern disappeared when densities of the two species from the entire open forest area were analyzed (Freed et al. 2008a). These diverse data imply that most of the white-eye increase was in the south-ern portion of the open forest area, with an extent of increase much higher than the overall 1.05 bird/ha. It is critically important that future analysis of survey data treat the southern portion of the open forest area separately.
Impacts of white-eyes on native species. Competition between species is indicated by
change in condition, survival, and/or numbers of one species as the other increases or decreases in numbers (Keddy 2001). There is some evidence that changes in native spe-cies were caused by competition with white-eyes. Mountainspring and Scott (1985) documented competition between white-eyes and several species of native birds from survey data collected during the late 1970s from the Hawaiian Forest Bird Survey (Scott et al. 1986). They detected negative correlation in density between white-eyes and native species, with adjustment for differences in habitat between study areas. Freed et al. (2008a) showed that the white-eye was replacing the akepa in the open forest study sites, but not in the closed forest site with lower white-eye captures in mist-nets (Freed and Cann 2009). Figure 1 shows more spatial evidence of negative correlation between akepa and white-eye densities.
The piecewise regression used by Freed and Cann (2010) showed declines in all native species in the open forest area during 2000–2007, two of which were significant (akepa and iiwi). Here we add two more species (amakihi, apapane) with significant declines during the white-eye increase (Fig. 4). White-eyes spend as much time in ohia-lehua foliage as the amakihi and apapane (Freed et al. 2008a).
In previous studies, we identified changes in condition of native birds in our open forest sites that could be produced only by a factor that influenced foraging substrates used by each native species. Changes included lower mass, lower fat, shorter legs, and shorter bills (Freed et al. 2008a,b; Freed and Cann 2009), which generated lower ju-venile and adult survival. In addition, we identified changes in timing, duration, and symmetry of molt of all native species, with increasingly lower survival during the winter months of 2000–2004 (Freed and Cann 2012). These changes in molt have been experi-mentally induced by severe food limitation in other birds (Murphy et al. 1988, Swaddle and Witter 1994). It is difficult to imagine an alternative factor that reduced arthropods from the foliage and branches of ohia-lehua trees, and hidden in lichen-covered branch-es of koa trebranch-es, all foraging substratbranch-es used by white-eybranch-es (Freed et al. 2008a).
None of the skeletal changes in native birds in the open forest sites were observed in the closed forest site during 2004–2005, where white-eye capture rates were only 20% of open forest rates (Freed and Cann 2009). During 2005, prevalence of non-normal molt was lowest in the closed forest site, but became highest in 2006 (Freed and Cann 2012). This reversal was associated with increased density of white-eyes in the closed for-est area and decreased density in the open forfor-est area between 2005 and 2006 (Fig. 3).
Avian malaria kills native birds, but it is too cool at upper elevations for avian malaria to be endemic (Freed et al. 2005). Introduced yellow-jacket wasps (Paravespula
pen-sylvanica) compete for food with native birds (Gambino et al. 1987), but these were
controlled after 2000 (Freed and Cann 2009). Parasitoid wasps, escaped from biological control, could reduce native arthropods, but these were more prevalent at lower than at upper elevations (Peck et al. 2008). We documented an explosive increase in chewing lice (from a different introduced bird), which can increase food requirements to replace heat lost from degraded plumage (Freed et al. 2008b). However, signs of food limitation began in 2000 and worsened in 2002 (Freed et al. 2008a, Freed and Cann 2012), before lice became widespread in the community in 2003 (Freed et al. 2008b). Mean monthly air temperatures did not change between 1993–1999 and 2000–2006, indicating that climate change was not responsible for reduced productivity of arthropods (Freed and Cann 2012). If any of these alternatives had caused food limitation and lower survival in all native species, then they should have caused comparable food limitation and de-clines in white-eyes given the similarity in foraging substrates. In particular, the dynam-ic of molt and white-eyes between study sites and areas during 2005 and 2006 suggests that a third factor was not involved. Such factors, that favor one species over another to resemble competition, are frequent alternatives to competition (Keddy 2001).
Our data also presage connections between biotic resistance, diffuse competition, and a reversal of diffuse competition through propagule pressure. Biotic resistance rel-evant to this system is diffuse competition, which arises when multiple native species overlap different parts of the niche of a potential invader (MacArthur 1972). For an invader at low density, such competition in a tightly interacting native community can prevent increases in density (Case 1990). The overlap of multiple foraging sub-strates with each native species likely provided the diffuse competition that kept the white-eye at low density in the old-growth forest. However, when the population in-creased, based on the opportunities offered in the restoration area, this competition was overwhelmed by propagule pressure, as documented for other systems (von Holle and Simberloff 2005, Hollebone and Hay 2005, Colautti et al. 2006, Lockwood et al. 2005, Simberloff 2009). A removal experiment that reduces the density of white-eyes may help determine if limiting propagule pressure enables diffuse competition to be restored.
Conclusion
the increase in old-growth forest, while ecological opportunism was the basis for the increase in the restoration area. These are usually considered as alternatives for invasion success (Sax et al. 2007, Sol et al. 2012).
The U.S. Fish and Wildlife Service, in formulating its final comprehensive conserva-tion plan in late 2010 (http://www.fws.gov/hakalauforest/planning.html), emphasized habitat restoration efforts on the refuge. Evidence presented here indicates that this plan will provide more ecological opportunities for white-eyes, and this will likely further increase the negative impacts on native birds in the forest below. The plan assumes that avian malaria is the greatest long-term problem for the birds (Benning et al. 2002, At-kinson and LaPointe 2009), and we have shown that epizootics occur in the open forest area (Freed et al. 2005). However, white-eye competition could be a more serious and immediate problem for Hawaiian forest birds, especially if the impacts are in the most intact native communities, as found by Herbold and Moyle (1986) for introduced fish.
A white-eye removal experiment must be performed to determine conclusively if competition is the cause of current food limitation in native birds and extensive declines. An experiment in New Zealand identified positive responses from multiple native species when an introduced bird was controlled (Tindall et al. 2007). Native Hawaiian birds have become so food-limited that they can neither breed successfully nor molt efficiently, and will certainly not be able to mount the expected energetically expensive immune response to malaria (Freed et al. 2005). The outcome of the experi-ment should serve to inform the future of manageexperi-ment of Hawaiian forest birds at Hakalau and perhaps at other forested locations in Hawaii with native birds.
Acknowledgements
We gratefully respect the dedication of many students, volunteers, and interns who as-sisted with the field research. T. Smith, D. Sol, and anonymous reviewers gave useful comments on the manuscript. We were supported over the years by grants from the John D. and Catherine T. MacArthur Foundation (World Environment and Resources Program), National Science Foundation, Environmental Protection Agency (Science to Achieve Results, R82-9093), and Australian Research Council Discovery-Project Grant DP451402 to LAF (Partner Investigator; H. McCallum, Chief Investigator).
References
Atkinson CT, LaPointe DA (2009) Introduced avian diseases, climate change, and the future of Hawaiian honeycreepers. Journal of Avian Medicine and Surgery 23: 53–63.
Bakker JD, Wilson SD (2004) Using ecological restoration to constrain biological invasion. Journal of Applied Ecology 41: 1058–1064.
Banko PC, Banko WE (1980) Historical trends of passerine populations in Hawaii Volcanoes National Park and vicinity. . Second conference on scientific research in national parks 8: 108–125.
Benning TL, LaPointe D, Atkinson CT, Vitousek PM (2002) Interactions of climate change with biological invasions and land use in the Hawaiian Islands: Modeling the fate of en-demic birds using a geographic information system. Proceedings of the National Academy of Science USA 99: 14246–14249.
Blackburn TM, Lockwood JL, Cassey P (2009) Avian invasions: the ecology and evolution of exotic birds. Oxford University Press, Oxford, 305 pp.
Buckland ST, Anderson DR, Burnham KP, Laake JL (1993) Distance sampling: estimating abundance of biological populations. Chapman and Hall, London, 446 pp.
Burnham KP, Anderson DR (2002) Model selection and multimodal inference, 2nd ed. Spring-er-Verlag, New York, 488 pp.
Camp RJ, Pratt TK, Gorresen PM, Jeffrey JJ, Woodworth BL (2009) Passerine bird trends at Hakalau Forest National Wildlife Refuge, Hawai’i. Hawaii Cooperative Studies Unit Tech-nical Report HCSU-011, University of Hawaii at Hilo.
Camp RJ, Pratt TK, Gorresen PM, Jeffrey JJ, Woodworth BL (2010) Population trends of forest birds at Hakalau Forest National Wildlife Refuge, Hawaii. Condor 112: 196–212. Case TJ (1990) Invasion resistance arises in strongly interacting species-rich model
competi-tion communities. Proceedings of the Nacompeti-tional Academy of Science USA 87: 9610–9614. Caum EL (1933) The exotic birds of Hawaii. Occasional Papers of the BP Bishop Museum
10: 1–55.
Colautti RI, Grigorovich IA, MacIsaac HJ (2006) Propagule pressure: a null model for biologi-cal invasions. Biologibiologi-cal Invasions 8: 1023–1037.
Connell JH, Slatyer RO (1977) Mechanisms of succession in natural communities and their role in community stability and organization. American Naturalist 111: 1119–1144. Crooks JA (2005) Lag times and exotic species: the ecology and management of biological
inva-sions in slow-motion. Ecoscience 12: 316–329.
Crooks JA, Soule ME (1999) Lag times in population explosions of invasive species: causes and implications. In: Sandlund OT, Schei PJ, Viken AV (Eds) Invasive Species and Biodiversity Management. Klywer Academic Publishers, Dordrecht, 103–125.
D’Antonio C, Meyerson LA (2002) Exotic plant species as problems and solutions in ecological restoration: a synthesis. Restoration Ecology 10: 703–713.
DeGroot MH, Schervish MJ (2002) Probability and statistics, 3rd ed. Addison-Wesley, Boston, 816 pp.
Dunmire WW (1962) Bird populations in Hawaii Volcanoes National Park. Elepaio 22: 65–70. Foster JT (2009) The history and impact of introduced birds. In: Pratt TK, Atkinson CT,
Banko PC, Jacobi JD, Woodworth BL (Eds) Conservation Biology of Hawaiian Forest Birds. Yale University Press, New Haven, 312–330.
Freed LA (2001) Significance of old-growth forest to the Hawaii akepa. Studies in Avian Biology 22: 173–184.
Freed LA, Cann RL (2010) Misleading trend analysis and decline of Hawaiian forest birds. Condor 112: 213–221.
Freed LA, Cann RL (2012) Changes in timing, duration and symmetry of molt are associated with extensive decline of Hawaiian forest birds. PLOS One 7: e29834.
Freed LA, Cann RL, Bodner GR (2008a) Incipient extinction of a major population of the Hawaii akepa owing to introduced species. Evolutionary Ecology Research 10: 931–965. Freed LA, Cann RL, Diller KL (2009) Sexual dimorphism and the evolution of seasonal vara-tion in sex allocavara-tion in the Hawaii akepa. Evoluvara-tionary Ecology Research 11: 731–757. Freed LA, Cann RL, Goff ML, Kuntz WA, Bodner GR (2005) Increase in avian malaria at
up-per elevation in Hawaii. Condor 107: 753–764.
Freed LA, Fretz JS, Medeiros MC (2007) Adaptation in the Hawaii akepa to breed and moult during a seasonal food decline. Evolutionary Ecology Research 9: 157–167.
Freed LA, Medeiros MC, Bodner GR (2008b) Explosive increase in ectoparasites in Hawaiian forest birds. Journal of Parasitology 94: 1009–1021.
Fretz JS (2002) Scales of food availability for an endangered insectivore, the Hawaii Akepa. Auk 119: 166–174.
Gambino P, Medeiros AC, Loope LL (1987) Introduced vespids Paravespula pensylvanica prey on Maui’s endemic arthropod aauna. Journal of Tropical Biology 3: 169–170.
Hart PJ (2001) Demographic comparisons between high and low density populations of Ha-waii Akepa. Studies in Avian Biology 22: 185–193.
Herbold B, Moyle PB (1986) Introduced species and vacant niches. American Naturalist 128: 751–760.
Hollebone AL, Hay ME (2007) Propagule pressure of an invasive crab overwhelms native biotic resistance. Marine Ecology Progress Series 342: 191–196.
Hufbauer RA, Torchin ME (2007) Integrating ecological and evolutionary theory of biological invasions. In: Nentwig W (Ed) Biological Invasions. Springer, Berlin, 79–96.
Kawagami K, Higuchi H (2003) Interspecific interactions between the native and introduced white-eyes in the Bonin Islands. Ibis 145: 583–592.
Keddy PA (2001) Competition (2nd Edition). Kluwer Academic Publishers, Dordrecht, 552 pp. Kolbe JJ, Glor RE, Schettino LR, Lara AC, Larson A, Losos JB (2004) Genetic variation
in-creases during biological invasion by a Cuban lizard. Nature 431: 177–181.
Lockwood JL, Cassey P, Blackburn TM (2005) The role of propagule pressure in explaining species invasions. Trends in Ecology and Evolution 20: 223–228.
MacArthur RH (1972) Geographical Ecology: Patterns in the Distribution of Species. Harper & Row, Publishers, New York, 269 pp.
Medeiros MC, Freed LA (2009) A fledgling-mass threshold greatly affects juvenile survival in the Hawaii akepa. Auk 126: 319–325.
Mountainspring S, Scott JM (1985) Interspecific competition among Hawaiian forest birds. Ecological Monographs 55: 219–239.
Murphy ME, King JR, Lu J (1988) Malnutrition during the postuptial molt of white-crowned sparrows: feather growth and quality. Canadian Journal of Zoology 66: 1403–1413. Murtaugh PA (2007) Simplicity and complexity in ecological data analysis. Ecology 88: 56–62. Peck RW, Banko PC, Schwarzfeld M, Euaparadorn M, Brinck KW (2008) Alien dominance of
the parasitoid wasp community along an elevational gradient on Hawai’i Island. Biological Invasions 10: 1441–1455.
Pianka ER (1974) Niche overlap and diffuse competition. Proceedings of the National Acad-emy of Science USA 71: 2141–2145.
Ramsey JO, Silverman BW (1997) Functional data analysis. Springer-Verlag, New York, 310 pp.
Roughgarden J (1986) Predicting invasions and rates of spread. In: Mooney HA, Drake JA (Eds) Ecology of Biological Invasions of North America and Hawaii. Springer-Verlag, New York, 179–188.
Sakai AK, Allendorf FW, Holt JS, Lodge DM, Molofsky J, With KA, Baughman S, Cabin RJ, Cohen JE, Ellstrand NC, MaCauley DE, O’Neil P, Parker IM, Thompson JN, Weller SG (2001) The population biology of invasive species. Annual Review of Ecology and System-atics 32: 305–335.
Sax DF, Stachowicz JJ, Brown JH, Bruno JF, Dawson MN, Gaines SD, Grosberg RK, Hastings A, Holt RD, Mayfield MM, O’Connor MI, Rice WR (2007) Ecological and evolutionary insights from species invasions. Trends in Ecology & Evolution 22: 465–471.
Scott JM, Mountainspring S, Ramsey FL, Kepler CB (1986) Forest bird communities of the Ha-waiian Islands: their dynamics, ecology, and conservation. Studies in Avian Biology 9: 1–431. Scott SN, Clegg SMB, S. P. , Kikkawa J, Owens IPF (2003) Morphological shifts in island-dwell-ing birds: the roles of generalist foragisland-dwell-ing and niche expansion. Evolution 57: 2147–2156. Scowcroft PG, Jeffrey J (1999) Potential significance of frost, topographic relief, and Acacia koa
stands to restoration of mesic Hawaiian forests on abandoned rangeland. Forest Ecology and Management 114: 447–458.
Simberloff D (2009) The role of propagule pressure in biological invasions. Annual Review of Ecology and Systematics 40: 81–102.
Sol D, Bartomeus I, Griffin AS (2012) The paradox of invasion in birds: competitive superiority or ecological opportunism? Oecologia 169: 553-564.
Swaddle JP, Witter MS (1994) Food, feathers and fluctuating asymmetries. Proceedings of the Royal Society B: 255: 147–152.
Taylor CM, Hastings A (2005) Allee effects in biological invasions. Ecology Letters 8: 895–908. Tindall SD, Ralph CJ, Clout MN (2007) Changes in bird abundance following common myna
control on a New Zealand island. Pacific Conservation Biology 13: 202–212.
Tobin PC, Whitmire SL, Johnson DM, Bjornstad ON, Liebhold AM (2007) Invasion speed is affected by geographical variation in the strength of allee effects. Ecology Letters 10: 36–43. Tomonari-Toggle MJF (1996) Bird catchers and bullock hunters in the upland Mauna Kea
van Riper III C, van Riper SG, Goff ML, Laird M (1986) The epizootiology and ecological significance of malaria in Hawaiian land birds. Ecological Monographs 56: 327–344. von Holle B, Siimberloff D (2005) Ecological resistance to biological invasion overwhelmed by
propagule pressure. Ecology 86: 3212–3218.