27 F. Parvaz / JHMTR 4 (2017) 73-8
Journal of Heat and Mass Transfer Research 5 (2018) 27-38
Semnan University
Journal of Heat and Mass Transfer Research
Journal homepage: http://jhmtr.journals.semnan.ac.ir
Computational fluid dynamics simulation of the flow patterns and
performance of conventional and dual-cone gas-particle cyclones
Seyed Masoud Vahedi, Farzad Parvaz*, Roohollah Rafee, Mohsen Khandan Bakavoli
Department of Mechanical Engineering, Semnan University, P.O. Box 35131-191, Semnan, Iran
PAPER INFO
History:
Submitted 2017-07-12 Revised 2017-09-15 Accepted 2017-09-18
Keywords :
Eulerian–Lagrangian; Reynolds Stress Model; Turbulent Flow; Gas-Particle Flow.
A B S T R A C T
One of the main concerns of researchers is the separation of suspended particles in a fluid. Accordingly, the current study numerically investigated the effects of a conical section on the flow pattern of a Stairmand cyclone by simulating single-cone and dual-cone cyclones. A turbulence model was used to analyze incompressible gas-particle flow in the cyclone models, and the Eulerian–Lagrangian approach was employed to examine particle movement. Despite the simplicity of cyclone geometry, internal two-phase flow in such devices is very complicated and anisotropic. This flow was therefore analyzed using a Reynolds stress model. The numerical results were then compared with those of experimental studies. To track calcium carbonate particles, drag and gravity forces were considered in the Lagrangian model. The findings indicated that adding a second conical section at the bottom of the cyclones increases tangential velocity and expands the Rankine vortex region. Moreover, an increasing trend of descending flow occurs. Increasing the number of conical sections elevates pressure drop at all velocities. Finally, the dual-cone cyclone has higher efficiency than the typical cyclone because the smaller end of the former limits particle motion and increases collection performance.
© 2018 Published by Semnan University Press. All rights reserved.
DOI: 10.22075/jhmtr.2017.1503.11001.
Introduction
Cyclones are devices used for the separation of droplets or particles from gas. Two-phase flow is directed toward a cyclone, where particles are collected at its bottom as gas exits from its upper outlet [1]. This separation happens because of centrifugal and gravitational acceleration forces [2]. Nowadays, these industrial devices are extensively used in food and petroleum industries. The use of cyclones rapidly increased because of their simplicity, low operational costs, and ease of installation. In the past, gravitational separators were utilized to separate oil or water droplets and particles from gas. The problem with these separators is that they involve high industrial costs; by contrast, cyclones improve separation at reduced expenses [1].
In a Stairmand cyclone, two vortex flows are
generated. The outer vortex is a descending vortex that tends toward the cyclone wall and assumes a conical shape, whereas the inner vortex is an ascending vortex that exits the cyclone through the device’s vortex finder. These vortexes, which depend on geometrical parameters, affect cyclone efficiency. Cyclone efficiency is defined as the ratio of the outlet mass to the inlet mass of particles. A deep understanding of flow behavior and the effects of geometrical parameters is needed to accurately estimate cyclone performance [2]. Many researchers have predicted the efficiency of cyclones using different mathematical models and then compared the findings to experimental results [1, 2]. Several researchers, however, neglected surface friction in their analysis of cyclone hydrodynamics [3–5]. Surface friction is due to surface roughness, which can originate from the erosion, collision, and rebounding of particles above the surface of a
cyclone. Surface roughness can therefore
Corresponding Author : Farzad Parvaz, Department of Mechanical Engineering, Semnan University, Semnan, Iran
remarkably influence cyclone performance. This issue was first presented by Barth [6], who calculated the tangential velocity of the gas phase inside vortex flow. He computed pressure drop and cyclone efficiency via the tangential velocity of a Rankine vortex flow. Barth’s model was extended by Muschelknautz and Krambrock [7] by modifying the friction coefficient and probing into the effects of friction increase on a cyclone wall. The authors also calculated pressure drop by using the friction coefficient and tangential velocity formula. Their model more accurately predicts cyclone efficiency than does Barth’s model. Meissner and Loffler [8] derived an empirical expression of tangential velocity, with consideration for wall friction. The model established by the authors includes two additional friction factors. Karagoz and Avci [9] also proposed a model for predicting pressure drop and cyclone efficiency. In the model, the wall friction coefficient is a function of Reynolds number and surface roughness.
Accurate measurement instruments and modern experimental techniques are necessary to explore
complicated flows. Recent advances in
computational fluid dynamics (CFD) have generated impressive alternatives to current analytical models and reliable tools for preventing expensive and time-consuming experiments. Numerical techniques such as CFD are widely used to approximate the efficiency and pressure drop in cyclones and the
effects of geometrical factors on cyclone
performance [10, 11]. Kaya et al. [12] used CFD to study the flow field and efficiency of cyclones with one inlet and two inlet channels. Their results satisfactorily corresponded with experimental data. Wang et al. [13] investigated the effects of particles size and gas velocity on the internal flow field and efficiency of a Lapple cyclone and discovered that cyclone performance is improved by increasing particle size and volumetric flow rate. A comparative study of numerical results and experimental data in literature was conducted by Shi and Bayless [14]. They used three different boundary conditions of bottom trap, cone and bottom trap, and tangential lift-off for calculating cyclone efficiency. The third boundary condition shows more accurate predictions, however, it is more complex and needs more care. Raoufi et al. [15] and Kepa [16] investigated the gas flow field inside a cyclone separator at different vortex finder geometries. Their results revealed that different geometries account for significant effects on the performance of gas-particle cyclones. Four vortex finders with different cylindrical shapes and six vortex finders of various conical shapes were used by Raoufi et al. [15]. They found that the shape of a vortex finder exerts a major effect on the flow pattern and separation efficiency of a cyclone. Elsayed and Lacor [17] numerically studied the effects of inlet channel dimensions on the
performance of five different cyclones. They concluded that maximum tangential velocity and pressure drop decrease with increasing inlet dimensions. Increasing inlet dimensions also reduces cut-off size, thereby augmenting cyclone efficiency. One-inlet channel and two-inlet channel configurations of a Stairmand cyclone were explored by Zhao et al. [18], who demonstrated that the installation of two inlet channels in a cyclone generates a more symmetrical flow pattern and improves efficiency to levels higher than that exhibited by a cyclone with a single-inlet channel. Chuah et al. [19] and Xiang et al. [20] analyzed the effects of changes in the conical dimensions of an aerocyclone. They showed that a decrease in cone tip diameter increases the maximum tangential and axial velocities and pressure drop in the cyclone. Kaya and Karagoz [21] and Qian et al. [22] delved into the effects of a prolonged vertical tube on the particle collection of a cyclone, and Yoshida et al. [23] examined various shapes of cone apices located at the entrance of a dustbin. The researchers determined that low apex cone angles increase the efficiency of a cyclone. They also mounted an apex cone at the bottom of the conical collector and found improvements in cyclone performance at low tangential velocities.
The current research was a numerical study intended to evaluate the effects of inlet velocity and particle diameter on the efficiency levels and flow patterns of single-cone and dual-cone Stairmand cyclones used for the separation of calcium carbonate particles. Axial and tangential velocity distributions in nine distinct sections of the cyclones were investigated non-dimensionally. A Reynolds stress model was employed to simulate turbulent flow, and the Eulerian–Lagrangian statistical approach was used to track particles and predict cyclone performance.
2.
Conceptual model
A Stairmand cyclone consists of four parts, namely, an inlet channel, a central cylinder, a vortex finder, and a conical section (Figure 1). The dimensions of the cyclone are listed in Table 1. As previously stated, single-cone and dual-cone configurations were simulated. A mixture of fluid and suspended calcium carbonate particles (Table 2) was blown tangentially through the inlet channel toward the cyclones.
F. Parvaz / JHMTR 5 (2018) 27-38 29
cyclone core. The secondary vortex, created mostly in the conical section, guides particles to the vortex finder tube.
Fig. 1. Schematic of the two models.
Table 1. Geometrical properties of the investigated cyclones.
Parameters Dimensional values (m)
Non-dimensional values
D 0.205 1
a 0.105 0.5
b 0.041 0.2
Dx 0.105 0.5
S 0.105 0.5
Bc 0.076875 0.375
h 0.3075 1.5
Ht 0.82 4
Le 0.1025 0.5
Li 0.1025 0.5
LD 0.41 2
Table 2. Physical properties of air and calcium carbonate particles [24, 25].
Materials Density
[kgm–3]
Dynamic viscosity [Pa.s]
Air 1.225 0.00017694
Calcium carbonate 2740
-3.
Governing equations
3.1 Continuum phase equations
The maximum fluid velocity in the cyclone inlet is 19.5 ms–1.Thus, the Mach number is equal to 0.06, and flow can be considered incompressible. The continuity equation and Reynolds-averaged Navier– Stokes equation for incompressible, unsteady, and isothermal flow are as follows [25–27]:
(1) 𝜕𝑢̅𝑖̇
𝜕𝑥𝑖= 0
(2) 𝜕𝑢̅𝑖̇
𝜕𝑡 + 𝑢̅𝑗̇ 𝜕𝑢̅𝑖̇ 𝜕𝑥𝑗= −
1 𝜌
𝜕𝑝̅ 𝜕𝑥𝑖+ 𝜈
𝜕2𝑢 𝑖̇ ̅ 𝜕𝑥𝑗𝜕𝑥𝑗−
𝜕 𝜕𝑥𝑗𝑅𝑖𝑗
where 𝜌, 𝑢̅𝑖̇, 𝜈, and 𝑅𝑖𝑗 (= 𝑢̅̅̅̅̅́ 𝑢𝑖̇ 𝑗̇́) are the density, velocity, kinematic viscosity, and Reynolds stress tensor, respectively.
3.2 Turbulence modeling
A Reynolds Stress Model (RSM) was employed because of the high curvature streamline of the swirling flow inside the cyclones. The RSM equation can be written as [27]
(3) 𝜕
𝜕𝑡(𝜌𝑢̅̅̅̅̅) + 𝑢́ 𝑢𝑖̇ 𝑗̇́ ̅̅̅𝑘 𝜕
𝜕𝑥𝑘(𝜌𝑢̅̅̅̅̅)𝑖̇́ 𝑢𝑗̇́
= 𝐷𝑖𝑗+ 𝑃𝑖𝑗+ 𝜃𝑖𝑗− 𝜀𝑖𝑗
The first term at the right-hand side of the equations above refers to turbulent diffusion, which can be expressed as follows [27]:
(4) 𝐷𝑇,𝑖𝑗 =
𝜕 𝜕𝑥𝑘(
𝜇 𝜎𝑘
𝜕𝑢̅̅̅̅̅𝑖̇́ 𝑢𝑗̇́ 𝜕𝑥𝑘 )
(5) 𝑃𝑖𝑗 = −𝜌 (𝑢̅̅̅̅̅̅ 𝜕𝑢́ 𝑢𝑖̇ 𝑘́ 𝑗̇
̅ 𝜕𝑥𝑘+ 𝑢𝑗̇́ 𝑢𝑘́
̅̅̅̅̅̅ 𝜕𝑢̅𝑖̇ 𝜕𝑥𝑘)
The term 𝜃𝑖𝑗 pertains to pressure strain [27]:
(6) 𝜃𝑖𝑗 = 𝑝 (
𝜕𝑢𝑖̇́ 𝜕𝑥𝑗̇+
𝜕𝑢𝑗̇́ 𝜕𝑥𝑖̇) ̅̅̅̅̅̅̅̅̅̅̅̅̅̅̅̅
The term 𝜀𝑖𝑗 shows dissipation [27]:
(7) 𝜀𝑖𝑗 = 2𝜇
𝜕𝑢𝑖̇́ 𝜕𝑥𝑘
𝜕𝑢𝑗̇́ 𝜕𝑥𝑘 ̅̅̅̅̅̅̅̅̅̅
3.3 Discrete phase
The governing equation for particle motion is expressed as Eq. (8). In this study, the interaction between particles was disregarded because of the dilute flow in the cyclones. Given the absence of diffusion, the motion equation describes each particle’s motion by considering hydrodynamic drag force [28].
(8) 𝜌𝑝
𝑑𝑢⃗⃗⃗⃗ 𝑝
𝑑𝑡 =
3 4
𝜌
𝑑𝑝𝐶𝐷|𝑢⃗ − 𝑢⃗ 𝑝|(𝑢⃗ − 𝑢⃗ 𝑝)
The drag coefficient is expressed as [21, 25, 29]
(9) 𝐶𝐷= 𝑎0+
𝑎1 𝑅𝑒𝑝+
𝑎2 𝑅𝑒𝑝2
The equation above is used for spherical particles, for which constants are calculated on the basis of different relations at different ranges of Reynolds numbers [21].
3.4 Boundary conditions
As shown in Figure 1, the computational domain boundaries were divided into four conditions. The first was assigned to the inlet, where air is blown into the cyclone through the inlet channel at a constant
velocity of 19.5 ms–1. The second boundary
condition was assigned to the cyclone outlet, where flow exits the cyclones through the vortex finders
1Semi-implicit method for pressure linked equations
located at the top of the cyclones. To examine cyclone performance, the bottom of the cyclones was regarded as a trap. The no-slip boundary condition, forth boundary condition, was assigned to the walls.
4.
Solver settings
The simulations described here were run using
ANSYS Fluent 16 (Fluent, Inc.). An efficient and
robust algorithm was employed to capture steep
pressure gradients, strong swirling flow, and high
anisotropy. The SIMPLE 1 algorithm was for
pressure–velocity coupling. For the discretization of
momentum equations, the QUICK2 scheme was
employed. The solver settings for the CFD modeling were set to second-order upwind scheme both for
dissipation rate and for turbulent kinetic energy; also first-order upwind scheme was used for the Reynolds stress equation. Note that the first-order scheme was chosen because it enables improved convergence and avoids numerical instabilities. The convergence criteria for all the equations was set to
10–4. A standard wall function was used to model
fluid flow in the near-wall region. The
aforementioned settings have been widely used by many researchers, who reported very encouraging
results [30]. Particles were tracked by setting
900,000 integral steps with a length scale of 0.005
m. To take turbulent dispersion and the characteristic
lifetime of an eddy into account, the discrete random walk model and a random eddy lifetime model were adopted, respectively [30, 31].
In accordance with the literature, turbulence intensity and turbulence characteristic length were set at 5% and 0.07 times the inlet width, respectively [30, 31]. Normal components of Reynolds stress
tensors were defined by 2k 3⁄ , where the kinetic
energy was defined as k = 3 2(IU⁄ in)2, and the
shear stress components were all set to zero [32]. Calcium carbonate was the working powder used in the discrete phase modeling (DPM). Dust loading
was considered as 0.005 kg powder per unit volume
of air, with the mean powder diameter equaling
5.97 μm and the geometric standard deviation being 2.08. For an exponential relationship between the particle diameter and the mass fraction of particles
with diameters greater than 𝑑, 𝑅(𝑑) was assumed in
the Rosin–Rammler distribution function [29, 32]:
𝑅(𝑑) = exp [− (𝑑⁄ )𝑑̅ 𝑛] (10)
where 𝑑̅ and n reflect the characteristic diameter and
distribution parameter, respectively. Particle sizes were in the range 0.3 to 6.8 µm. Solid particles were injected using the face normal condition, with
F. Parvaz / JHMTR 5 (2018) 27-38 29
velocity equaling that of flowing fluid at the cyclone inlet. At the cyclone bottom, DPM settings were defined as a trap. The particles that reach the cyclone walls collide with the walls and rebound. For the low dust loading condition, a reasonable assumption is that the collision of discrete phase particles with cyclone walls is perfectly elastic; hence, the coefficients of restitution in the tangential and wall normal directions were taken as unity [29, 32].
At the core regions of the cyclones, flow is non- stationary and swirls over time. This swirling motion continues until it reaches the steady state. This period of time is known as residence time, given as follows [25, 31]:
(11) 𝑡𝑟𝑒𝑠=
∀ 𝑄
Residence time depends on cyclone dimensions and gas volumetric flow rate. Increasing the volumetric flow rate and decreasing the dimensions of a cyclone decreases and increases resident time, respectively. The time step for the simulations was 0.0001 s [22, 25].
5.
Grid independence test and validation
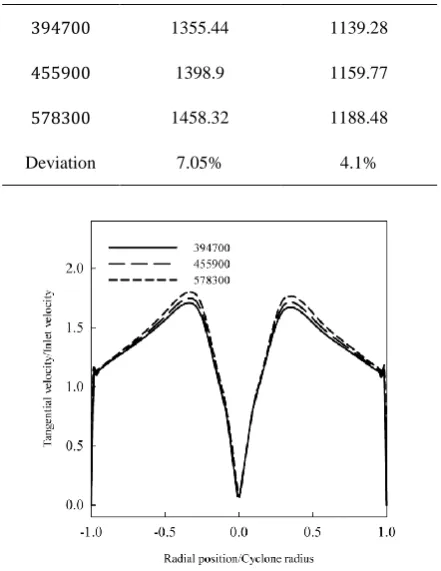
Hexagonal cells produced via Gambit are presented in Figure 2. To evaluate the independence of the numerical solution from grid structure, the number of cells was increased until the difference between the evaluated indicators became negligible. Total pressure drop and static pressure drop were employed to evaluate mesh independence. Details regarding the grid independence test are provided in Table 3, and the results on tangential velocity at different mesh sizes are illustrated in Figure 3.
After the mesh independence test, the problem was validated. The validation of the continuum phase and the tangential velocity profile was compared with the experimental data of Hoekstra [24] (Figure 4).
Fig. 2. Schematic of generated grids.
Table 3. Results of grid independence test on the conventional cyclone configuration.
Total pressure drop Static pressure drop
Number of cells
1139.28 1355.44
394700
1159.77 1398.9
455900
1188.48 1458.32
578300
4.1% 7.05%
Deviation
Fig. 3. Results for three mesh sizes.
The relationship between inlet velocity and pressure drop is depicted in Figure 5, on whose basis the simulation results of the current work and the experimental findings of Hoekstra were analyzed. The results on the dispersed phase were then compared with the experimental data derived by Zhao [26] (Figure 6).
6.
Results
6.1. Tangential velocity
One of the main parameters of the cyclone models is tangential velocity, which consists of two regions, namely, the forced and free vortex regions (Figure 7). These regions create a Rankine vortex. All elements of a fluid revolve at a velocity of Ω as rigid bodies in the forced vortex region. Such flow is described in the following equation:
(12) 𝑣𝜃= 𝑟𝛺
For the free vortex region, the following correlation can be used to describe tangential velocity:
Fig. 4. Comparison of (a) tangential velocity and (b) axial velocity profiles in the current numerical simulation and
the work of Hoekstra [24] on section Z=0.75 D.
Fig. 5. Comparison of pressure drop in the current numerical simulation and the work of Hoekstra [24].
Table 4. Nine sections for investigating velocity.
S9 S8 S7 S6 S5 S4 S3 S2 S1 Section
2.75 2.5 2.25 2 1.75 1.5 1.25 1 0.75
𝑧 𝐷𝑎 ⁄
a: Measured from the top inlet section
Fig. 6. Comparison of current numerical simulation and the work of Zhao [26] on the dispersed phase.
(13) 𝑣𝜃=𝐶𝑟
Regarding the previous studies, the tangential velocity profile examined in the entire Rankine vortex region [3, 4, 6, 12, 22]. The radial distribution of tangential velocity was investigated in nine
sections (Table 4) of the cyclone models. Figure
9 indicates that the tangential velocity has a V-shape profile in the single-cone cyclone. It reaches its maximum far from the core region of the cyclone at the vortex finder boundary, after which it decreases as it moves toward the wall because of increased dissipation. Adding another cone to the gas-particle cyclone generates a maximum tangential velocity that is 1.5 times greater than that of a conventional cyclone. The Rankine vortex region is also limited by the smaller separation space of the dual-cone cyclone.
F. Parvaz / JHMTR 4 (2017) 27-38 33
Fig. 7. Two regions of tangential velocity, which create the Rankine vortex [33].
a
Turbulent kinetic energy [j/kg]
b
Turbulent kinetic energy [j/kg]
Fig. 8. Turbulent kinetic energy contour plots for the (a) conventional cyclone and (b) dual-cone cyclone.
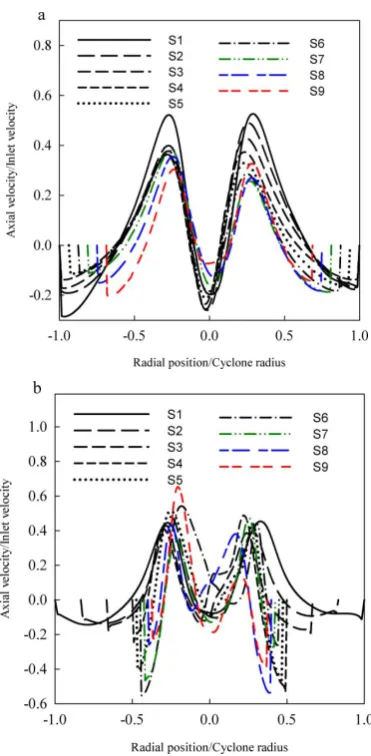
6.2Axial velocity
Axial velocity causes axial flow, which dips in the middle of the vortex finder. Although swirl
decreases in the conical section, this core flow dominates all over the separation components. This central flow also reduces swirl in the conical part of the cyclone. The axial velocity profile is unchanged inside the cyclone core region beneath the vortex finder. In the radial direction, when the core region peak is created, two extra peaks are generated, and axial velocity declines tending toward the wall. Note that negative values of axial velocity correspond to downstream flow, whereas positive values are related to upstream flow. The axial velocity profiles, as shown in Figure 10, are inverted W profiles in all the nine sections.
Figure 10 likewise shows that adding an extra conical section causes no recognizable difference in axial velocity in the upstream region of the dual-cone cyclone in comparison with the axial velocity in the conventional cyclone. When the separation region space decreases because of the addition of a second cone, however, the axial velocity in the dual-cone cyclone is higher than that in the conventional one. This higher velocity plays an important role in the separation and collection of particles.
6.3Pressure drop
Cyclone pressure drop is essentially a
consequence of the vortex energy, solid loading, and gas-wall friction at the inlet, outlet, and walls of a cyclone. The walls provide the highest contribution to pressure drop, which cannot be reduced because doing so may affect separation efficiency.
Decreasing pressure drop is inadvisable because it imposes a negative effect on cyclone performance. This challenge prompted researchers to illuminate
geometrical optimization for pressure drop
reduction. Figure 11 shows that a higher gas inlet velocity increases pressure drop. Incorporating a second cone into the cyclone thus produces a smaller separation section, thereby reducing axial flow and increasing pressure drop. Vortex movement and its radial pressure gradient are non-negligible when pressure drop is taken into account. The pressure drop for one-directional flow over a smooth and clean wall of a cyclone is the result of three losses, namely, inlet losses, losses due to the fluid friction of two vortexes inside the separation space, and outlet tube losses. Among these, inlet losses provide minor contributions to pressure drop, whereas outlet tube losses provide major contributions. Overall, cyclone pressure drop increases with rising friction coefficient, cyclone length, and solid particle concentration.
Fig. 9. Radial distribution of tangential velocity profiles in sections S1–S9 in the (a) conventional cyclone and (b)
dual-cone cyclone.
Fig. 10. Radial distribution of axial velocity profiles in sections S1–S9 in the (a) conventional cyclone and (b)
dual-cone cyclone.
6.4Efficiency
One of the principal parameters that remarkably distinguishes cyclones from one another is efficiency. This parameter is defined as the ratio of the mass flow rate of captured particles to the total inlet mass flow rate.
(14) 𝜂 = 𝑚𝑡𝑟𝑎𝑝
𝑚𝑡𝑜𝑡𝑎𝑙
The total efficiency levels of the conventional and dual-cone cyclones at different velocities are presented in Figure 13. An increase in inlet velocity increases the total efficiency of both cyclones. Given that tangential velocity increases because of rising inlet velocity, efficiency also improves. Each cyclone efficiency level corresponds to a different particle size (Figure 14). The efficiency of the dual-cone cyclone is greater than that of the typical
cyclone. The larger the particles, the higher the efficiency in the two cyclones. The higher efficiency of the dual-cone cyclone is attributed to its higher tangential velocity, which produces stronger centrifugal force and causes large particles to rebound opposite the wall. Axial velocity, which moves the particles in cyclones downward, is also higher in the dual-cone cyclone. Hence, more particles are separated at the bottom of the cyclone, thereby increasing efficiency.
F. Parvaz / JHMTR 5 (2018) 27-38 29
Fig. 11. Comparison of pressure drop in the conventional and dual-cone cyclones at three inlet velocities.
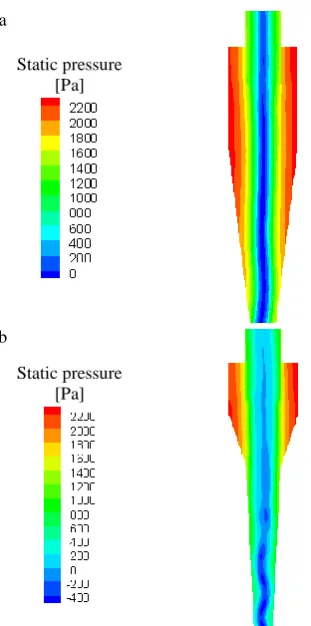
a
Static pressure [Pa]
b
Static pressure [Pa]
Fig. 12. Contour plots for pressure drop in the (a) conventional and (b) dual-cone cyclones.
Fig. 13. Comparison of total efficiency of the conventional and dual-cone cyclones at different inlet
velocities.
Fig. 14. Comparison of collection efficiency of the conventional and dual-cone cyclones at different particle
sizes.
The radial pressure gradient drives the natural instability of vortex flow. Consequently, separation efficiency can be disrupted if near-wall flow deviates from ideal surfaces, such as weld seams, measurement probes, riveted unions, and the like. These features present considerable difficulties in the prediction of cyclone performance via complicated calculations. The key feature for explaining cyclone performance is the fact that the instability of a double vortex structure affects the flow parameters of a cyclone.
a
b
c
d
Fig. 15. Particle tracking in the dual-cone cyclone at particle diameters of (a) 1 μm, (b) 2 μm, (c) 4 μm, and
(d) 8 μm.
a
b
c
d
Fig. 16. Particle tracking in the single-cone cyclone at particle diameters of (a) 1 μm, (b) 2 μm, (c) 4 μm, and
F. Parvaz / JHMTR 5 (2018) 27-38 29
7.
Conclusion
This research probed into industrial gas-particle cyclones of different shapes. A Reynolds stress model was employed to simulate turbulent flow in the continuum phase, and the Eulerian–Lagrangian approach was applied for particle tracking and cyclone performance investigation. The numerical results are summarized as follows:
The tangential velocity and Rankine vortex
region decrease when the space for separation decreases.
The axial velocity of the dual-cone cyclone
is higher than that of the conventional cyclone.
Increasing inlet gas velocity leads to a higher pressure drop in both cyclones, but this drop is more significant in the dual-cone cyclone because of its smaller separation component. Less static pressure is also seen in the core flow of the dual-cone cyclone.
The efficiency of the conventional cyclone
is lower than that of the dual-cone cyclone given the latter’s smaller outlet section and smaller space for particle movement.
Pressure drop increases with the addition of
conical sections.
Nomenclature
𝐶𝐷 Drag coefficient
𝐷 Cyclone diameter
𝐹𝐷 Friction factor (kgm s−2)
𝑔 Gravitational acceleration (m s−2)
𝐾 Turbulent kinetic energy (kgm2 s−2)
𝑝̅ Mean pressure (Pa)
𝑃 Stress generation (kgm−1 s−2)
𝑄 Volumetric flow rate (m3 s−1)
𝑅𝑖𝑗 Reynolds stress tensor
S𝑖 Section of study (m)
𝑡𝑟𝑒𝑠 Particle residence time (s)
𝑢 x-component of velocity (m s−1)
𝑢′ Fluctuating component of velocity (m s−1)
𝑢̅ Mean velocity (m s−1)
𝑣 y-component of velocity (m s−1)
𝑉 Cyclone volume (m3)
𝑤 z-component of velocity (m s−1)
𝑥𝑖 Location (m)
Greek Symbols
𝜈 Kinematic viscosity (m2 s−1)
𝑣𝑡 Turbulent viscosity (m2 s−1)
𝜌 Density (kg m−3)
𝜀 Turbulent dissipation
𝜇 Dynamic viscosity (Pa s)
Subscripts
𝑝 Particle
𝑡 Turbulence
References
[1] C.B. Shephered, C.E. Lapple, Flow pattern and pressure drop in cyclone dust collectors, Industrial & Engineering Chemistry, 31(8), 972-984, (1939).
[2] W. Barth, L. Leineweber, Evaluation of design of cyclone separators, Staub Reinhalt. Luft, 24, 41-55, (1964).
[3] H. Mothes, F. Löffler, Prediction of particle removal in cyclone separators, International Journal of Chemical Engineering, 28(2), 231-240, (1988).
[4] D.L. Iozia, D. Leith, The logistic function and cyclone fractional efficiency, Aerosol Science and Technology, 12(3), 598-606, (1990). [5] A. Avci, I. Karagoz, Effects of flow and
geometrical parameters on the collection efficiency in cyclone separators, Journal of Aerosol Science, 34(7), 937-955, (2003). [6] W. Barth, Berechnung und auslegung von
zyklonabscheidern auf grund neuerer
untersuchungen, Brennstoff-Wärme-Kraft, 8(1), 1-9, (1956).
[7] E. Muschelknautz, W. Krambrock,
Aerodynamische Beiwerte des
Zyklonabscheiders aufgrund neuer und
verbesserter Messungen, Chemie Ingenieur Technik, 42(5), 247-255, (1970).
strömungsfeldes im zyklonabscheider, Chemie Ingenieur Technik, 50(6), 451-471, (1978). [9] I. Karagoz, A. Avci, Modelling of the pressure
drop in tangential inlet cyclone separators. Aerosol Science and Technology, 39(9), 857-865, (2005).
[10] A.C. Hoffmann, M. De Groot, W. Peng, H.W.A. Dries, J. Kater, Advantages and risks in increasing cyclone separator length, AIChE journal, 47(11), 2452-2460, (2001).
[11] Y. Zhu, K.W. Lee, Experimental study on small cyclones operating at high flowrates. Journal of Aerosol Science, 30(10), 1303-1315, (1999). [12] F. Kaya, I. Karagoz, A. Avci, Effects of surface
roughness on the performance of tangential inlet cyclone separators. Aerosol science and technology, 45(8), 988-995, (2011).
[13] B. Wang, D.L. Xu, K.W. Chu, A.B. Yu, Numerical study of gas–solid flow in a cyclone separator. Applied Mathematical Modelling, 30(11), 1326-1342, (2006).
[14] L. Shi, D.J. Bayless, Comparison of boundary
conditions for predicting the collection
efficiency of cyclones. Powder Technology, 173(1), 29-37, (2007).
[15] A. Raoufi, M. Shams, M. Farzaneh, R.
Ebrahimi, Numerical simulation and
optimization of fluid flow in cyclone vortex finder. Chemical Engineering and Processing: Process Intensification, 47(1), 128-137, (2008). [16] A. Kępa, Division of outlet flow in a cyclone
vortex finder—The CFD calculations.
Separation and Purification Technology, 75(2), 127-131, (2010).
[17] K. Elsayed, C. Lacor, The effect of cyclone inlet dimensions on the flow pattern and performance, Applied Mathematical Modelling, 35(4), 1952– 1968, (2011).
[18] B. Zhao, Y. Su, J. Zhang, Simulation of Gas Flow Pattern and Separation Efficiency in Cyclone with Conventional Single and Spiral
Double Inlet Configuration, Chemical
Engineering Research and Design, 84(12), 1158– 1165, (2006).
[19] T. G. Chuah, J. Gimbun, T. S. Y. Choong, A CFD study of the effect of cone dimensions on
sampling aerocyclones performance and
hydrodynamics, Powder Technology, 162, 126– 132, (2006).
[20] R. Xiang, S. H. Park, K. W. Lee, Effects of cone dimension on cyclone performance, Journal of Aerosol Science, 32(4), 549–561, (2001).
[21] F. Kaya, I. Karagoz, Numerical
investigation of performance characteristics of a cyclone prolonged with a dipleg, Chemical Engineering Journal, 151(1), 39–45, (2009). [22] F. Qian, J. Zhang, M. Zhang, Effects of the
prolonged vertical tube on the separation performance of a cyclone, Journal of hazardous materials, 136, 822–829, (2006).
[23] H. Yoshida, Y. Nishimura, K. Fukui, T. Yamamoto, Effect of apex cone shape on fine particle classification of gas-cyclone, Powder Technology, 204(1), 54–62, (2010).
[24] A.J. Hoekstra, Gas flow field and collection efficiency of cyclone separators, Ph.D. thesis, Technical University Delft, Netherland, (2000). [25] F. Parvaz, S.H. Hosseini, G. Ahmadi, Kh.
Elsayed, Impacts of the Vortex Finder
Eccentricity on the Flow Pattern and
Performance of a Gas Cyclone, Separation and Purification Technology, 187, 1-13, (2017). [26] B. Zhao, Development of a new method for
evaluating cyclone efficiency, Chemical
Engineering and Processing: Process
Intensification, 44, 447–451 (2005).
[27] J. Gimbun, CFD simulation of aerocyclone hydrodynamics and performance at extreme
temperature, Engineering Applications of
Computational Fluid Mechanics, 2(1), 22-29 (2008).
[28] Y. Su, A.Zheng, B. Zhao, Numerical simulation of effect of inlet configuration on square cyclone separator performance, Powder technology, 210(3), 293-303 (2011).
[29] N. Fathizadeh, A. Mohebbi, S. Soltaninejad, M. Iranmanesh, Design and simulation of high pressure cyclones for a gas city gate station using semi-empirical models, genetic algorithm and computational fluid dynamics. Journal of Natural Gas Science and Engineering, 26, 313-329 (2015).
[30] L.S. Brar, R.P. Sharma, K. Elsayed, The effect of the cyclone length on the performance of Stairmand high-efficiency cyclone, Powder Technology, 286, 668-677 (2015).
[31] X. Gao, J. Chen, J. Feng, X. Peng, Numerical investigation of the effects of the central channel on the flow field in an oil–gas cyclone separator, Computers & Fluids, 92, 45-55 (2014).
[32] Ansys FLUENT 16 user guide. , Fluent Inc., 2006.
![Table 2. Physical properties of air and calcium carbonate particles [24, 25].](https://thumb-us.123doks.com/thumbv2/123dok_us/42015.2005046/3.595.69.280.559.770/table-physical-properties-air-calcium-carbonate-particles.webp)
![Fig. 4. Comparison of (a) tangential velocity and (b) axial velocity profiles in the current numerical simulation and the work of Hoekstra [24] on section Z=0.75 D](https://thumb-us.123doks.com/thumbv2/123dok_us/42015.2005046/6.595.70.260.514.701/comparison-tangential-velocity-velocity-profiles-numerical-simulation-hoekstra.webp)
![Fig. 7. Two regions of tangential velocity, which create the Rankine vortex [33].](https://thumb-us.123doks.com/thumbv2/123dok_us/42015.2005046/7.595.69.265.182.656/fig-regions-tangential-velocity-create-rankine-vortex.webp)