AUT J. Elec. Eng., 51(1) (2019) 39-44 DOI: 10.22060/eej.2019.14147.5209
Investigation of Always Present and Spectrum Sensing Based Incumbent Emulators
A. A. Sharifi
Department of Electrical Engineering, University of Bonab, Bonab, Iran
ABSTRACT: Cognitive radio (CR) technology has been suggested for the effective use of spectral
resources. Spectrum sensing is one of the main operations of CR users to identify the vacant frequency bands. Cooperative spectrum sensing (CSS) is used to increase the performance of CR networks by providing spatial diversity. The accuracy of spectrum sensing is the most important challenge in the CSS process since the sensing performance is vulnerable to security attacks. Primary user emulation attack (PUEA) is one of the most important attacks, where a malicious attacker sends the signal similar to the signal of the legitimate primary user (PU) and deceives the CR sensors to avoid them from accessing the spectrum holes. In this paper, we investigate two different strategies for the attacker. Always present (AP) and spectrum sensing (SS) based strategies. In the AP scenario, the PUEA, without performing spectrum sensing, continuously sends its fake signals. In SS based PUEA, the attacker senses the spectrum to identify the spectrum holes and then only sends its signals in idle frequency bands. Assuming the attack strategy, we estimate normalized attack power factor (NAPF) to obtain an optimal value of the energy detection threshold. The parameter NAPF is the ratio of the average emitted power of the attacker to the average power of the PU transmitter. The obtained results verify the superiority of the proposed energy detection approach compared to the existing conventional methods.
Review History:
Received: 1 March 2018 Revised: 9 November 2018 Accepted: 11 March 2019 Available Online: 11 March 2019
Keywords: CR, PUEA NAPF AP SS
1- Introduction
Cognitive radio (CR) network is a new technology in wireless communications, trying to resolve the spectrum scarcity [1]. In a CR network, two different types of users are present; primary users (PUs) and secondary users. The former is called licensed users and the latter, which is also referred to as the CR users, is called unlicensed users [2]. The CR users frequently monitor the frequency spectrum and identify the presence of licensed PU signals. This producer is named spectrum sensing. If the CR users are convinced by the absence of the PU signals, they can opportunistically use the vacant frequency bands for communications; otherwise, the CR users detect the presence of the PU signals, they immediately switch to another available spectrum band by performing spectrum handoff. In this way, the CR users are forced to use the spectrum holes without interfering with the PU signals [2]. Due to noise, multipath fading, shadowing, and hidden station problems, the local spectrum sensing of each sensor is not reliable [3]. Cooperative spectrum sensing (CSS) has been reported to address these issues, where some CR users collaborate with each other to sense the PU channels [4]. Although the CR network performance is improved by the CSS process, it is vulnerable to security threats [5]. One of the most common threats is primary user emulation attack (PUEA), where a malicious user tries to deceive the CR users by imitating the PU signal characteristics to prevent the CR sensors from accessing the idle frequency bands or convincing the CR users to leave the spectrum [5]. Several defense strategies have been reported recently [6-15]. In [6], the location information of the licensed PU transmitter
In this paper, we investigate a CSS process in the presence of a PUEA. Each CR user independently senses the frequency band and then sends its sensing measurement to the FC. The measurement is the received energy of the CR user from the PU signal or the PUEA. The FC makes the global decision about the status of the PU transmitter by using an optimal threshold selection approach in equal gain combining (EGC) scheme. We have considered two different scenarios: Always present (AP) and spectrum sensing (SS) based emulators. In the AP attack, the emulator permanently sends fake signals in the radio environment. In SS based PUEA, the attacker senses its environment and searches the vacant frequency bands to transmit its fake signals. Assuming the attack strategy, we estimate normalized attack power factor (NAPF) to obtain an optimal value of the energy detection threshold. The parameter NAPF is defined as the ratio of the average emitted power of the attacker to the average power of the PU transmitter. Computer simulation results confirmed the superiority of the proposed method.
The rest of the paper is presented as follows: In section two, the system model, and the CSS process are described. Section three explains the estimation of the attack power factor. In section four, numerical results are provided. Finally, section five concludes the paper.
2- system model and cooperative spectrum sensing
In this part, we explain the suggested system model and briefly review the energy detection scheme for cooperative sensing. In the presented system model, we consider a wireless CR network with N number of CR users and a malicious PUEA. A malicious PUEA emulates the features of the PU signal to deceive the CR sensors to convince that the PU transmission is in progress. The proposed system model is shown in Fig. 1
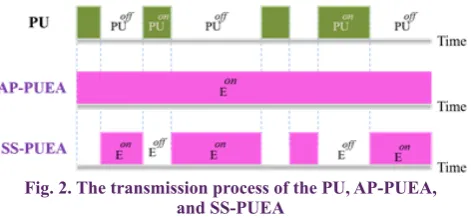
In the proposed network model, a malicious PUEA is relatively located near the PU transmitter to sense the primary spectrum; consequently, the spectrum sensing error either caused by multipath fading or shadowing is ignored for the attacker. We also assume that the emulator is able to change its transmission power level. As mentioned before, two different strategies are investigated for the PUEA; AP and SS-based strategies. In AP attack, the malicious PUEA continuously sends its fake signals in the channel. In SS-based PUEA, the attacker performs spectrum sensing to identify vacant frequency bands and then only sends its signals in unoccupied frequency bands. The transmission process of the legitimate PU, AP-PUEA, and SS-PUEA are presented in Fig. 2.
The presence and absence of PU signal are respectively denoted by PUon and PUoff. Similarly, Eon and Eoff specify the presence and absence of the malicious PUEA signal, respectively.
We adopt that each sensor uses an energy detector for its local spectrum sensing. Spectrum sensing is a binary hypothesis between H0 and H1 which includes the hypotheses of the absence and presence of the PU signal, respectively. In the presence of the PUEA, two different AP and SS-based attack strategies can occur. In AP-PUEA scenario, the hypotheses can be written as:
0 1
: PUEA Noise, : PU + PUEA Noise, H
H
+
+
In SS-PUEA, we have
0 1
: PUEA+ Noise, : PU + Noise. H
H
If the local sensing time is partitioned into M sampling instants, the signal yj(m) received by the j’th CR user at
sampling instants m=1, 2, … , M, in two different scenarios AP-Attack and SS-Attack can be respectively shown as equations (1) and (2) [16].
0 1
( ) ( ) ( ), ,
( ) ( ) ( ) ( ) ( ), .
j
j j
e e e j
j
p p p e e e j
x m h m n m H
y (m)
x m h m x m h m n m H
γ
γ γ
+
=
+ +
(1)
In SS-PUEA strategy,
0 1
( ) ( ) ( ), ,
( )
( ) ( ) ( ), ,
j
j
e e e j
j
p p p j
x m h m n m H
y m
x m h m n m H
γ γ
+
=
+
(2)
where nj(m) is the additive noise at the jth CR user with zero
mean and unit variance. Two parameters hpj(m) and hej(m), respectively denote the channel coefficients of the PU and the PUEA to the j’th CR user. We also consider block fading channels with constant channel coefficients in each sensing interval. Thus, m can be omitted from hpj(m) and hej(m). Two parameters γpx mp( ) and γex me( ) are the PU and PUEA
transmitted signals, respectively. γp and γe are the power
coefficients and xp and xe are assumed to be independent and
identical distributed Gaussian variables with zero means and unit variances. The parameter NAPF (ρ) is also defined as
the ratio of the average emitted power by the PUEA to the average transmitted power of the PU, that it isρ γ γ= e / .p
Obviously, a greater NAPF (ρ) indicates a more powerful PUEA.
Each CR sensor receives the signal from the M sensing instants. Then, the jth sensor calculates its energy Ej as:
2
1 .
M
j j
m E = y (m)
=
∑
(3) Based on equations (1) or (2), Ej is the central Chi-square distributed random variable with 2M degrees of freedom. With regard to the central limit theorem, for a sufficiently largeFig. 1. Network layout
number of samples (i.e., M>10), Ej approximately follows a normal distribution. Each CR reports its measured energy to the FC and the FC combines all of the received energies to perform the global decision on spectrum occupancy. The decision statistic is as follows:
1
1 N .
N j
j
= E
N =
Λ
∑
(4) The global decision is made at the FC by comparing ΛN to adecision threshold T. If ΛN is greater than T, the PU signals’
presence is concluded; otherwise, null hypothesis H0 is concluded. The global detection and false alarm probabilities can be defined as:
1 0 ( ), ( ), d N fa N
Q p T H
Q p T H
= Λ >
= Λ > (5) where the hypothesis H1 can be either H1 or H1 hypothesis.
The global error probability Qe at the FC is written as follows:
0 1
( ) (1 ) ( ).
e fa d
Q =Q p H + −Q p H (6) In (4), the decision statistics ΛN is also a normal distributed
random variable. In AP-PUEA scenario, we have
(
)
(
)
2
0 0 0
2
1 1 1
, , ,
~ ˆ
, , , ˆ ˆ N N H N H µ σ µ σ Λ (7)
and in SS-PUEA strategy
(
)
(
)
2
0 0 0
2
1 1 1
, , , ~ , , , N N H N H µ σ µ σ Λ (8) where, 0
2 2 2
0 1 2 2 1 1 2 2 1
( 1) ( 1) ,
2 ( 1) 2 ( 1) ,
( 1) ,
2 ( 1) ,
( 1) ,
2 ( 1)
e p e p p p p p p p M M M M M M M M
µ γ ργ
σ γ ργ
µ γ ργ
σ γ ργ
µ γ σ γ = + = + = + = + = + + = + + = + = +
3- the proposed method
Our objective is to resolve two different issues. At first, assuming the attack strategy (AP or SS), the parameter NAPF (attack strength) is estimated to obtain mean and variance of the Gaussian random variable ΛN. Then, the optimal value of threshold Topt is calculated to minimize the global error
probability. In the primary stages of the cooperative sensing, the calculated energies of all CR sensors are sent to the FC and the FC calculates the mean value of received energies to achieve the NAPF (ρ).
The mathematical expectation of ΛN is calculated as follows:
0 1 1
0 1 1
( ) ( ) ( ) ( ) ( )
( ) ( ).
N N o N
o
H p H H p H
p H p H
µ µ
Ε Λ = Ε Λ + Ε Λ
= + (10)
for AP -PUEA,
1
1
( ) ( 1) ( ) ( 1) ( )
( 1) ( ) ( 1) ( )
N e o p e
p o p p
M p H M p H
M p H M p H
γ γ γ
ργ γ ργ
Ε Λ = + + + +
= + + + + (11)
Considering the above equations, the values of unknown NAPF ρ is estimated as
( N) .
p
M
ψ ρ
γ
∧ Ε Λ −
= (12)
where,
M
(
1 pp H(1) .)
ψ = +γ
Similarly, for SS -PUEA,
1 1 1
( ) ( 1) ( ) ( 1) ( ),
( 1) ( ) ( 1) ( ),
( ) ( ).
N e o p
p o p
p o p
M p H M p H
M p H M p H
M p H M M p H
γ γ
ργ γ
ργ γ
Ε Λ = + + +
= + + + = + + (13) thus, 0 ( ) , ( ) N p
M p H
ψ ρ
γ
Ε Λ −
= (14)
where,
M
(
1 pp H( ) .1)
ψ = +γ
Regarding the proposed system model and considering the attack scenario, two attack strategies AP-PUEA and SS-PUEA do not occur simultaneously in the CR network. Thus,
1 0 1 0
( ) ( ) 1,
( ) ( ) 1.
p H p H p H p H
+ =
+ =
After the estimation of the parameter ρ, the FC obtains optimal threshold value Topt for minimizing the total error
probability. The optimal threshold Topt, to attain the minimal global error probability Qe, is calculated as follows [17]:
2 2
2 2
0 1 1 0
1 0 2 2 1 0 0 ( ), e opt Q λ
µ σ µ σ ϕ
λ σ σ
σ σ ∂ = ⇒ ∂ − + = ≠ − (15) where 2 2 2
0 1 1 0
2 2 2 2 2 2 1 0
1 0 1 0 0 1 0 1
0 1
( )
( ) 2 ln( ) .
( )
p H p H
ϕ µ σ µ σ
σ
σ σ µ σ µ σ σ σ
σ = − + − − + (16)
It should be noted that µ1 corresponds to µ1 or µ1 and σ1
corresponds to σ1 or σ1.
4- numerical results
We consider a CR network with N=12 cooperative sensors. Each CR sensor executes spectrum sensing with an energy detection method by M=30 samples. The prior probabilities p(H0) and p(H1) are respectively assumed to be equal to 0.8
and 0.2.
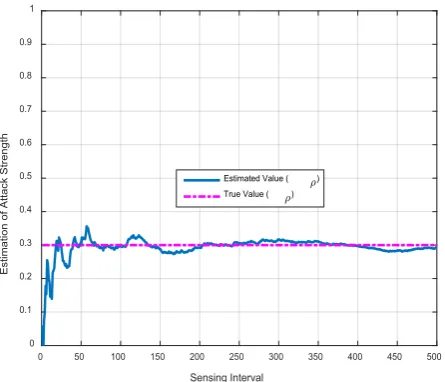
Figures 3 and 4 show the convergence of NAPF for two values 0.3 and 0.7 in AP-PUEA and SS-PUEA scenarios, respectively. The estimated values for attack factor ρ
Fig. 5 displays the global detection probability versus the global false alarm probability in two attack scenarios AP and SS for ρ=0.3, 0.7. The average SNR between PU and CR users is set as -10dB. As shown in the figure, for a constant value of Qfa, the AP-PUEA has a higher detection probability than that of the SS-PUEA. The reason is that in AP strategy the fake signal occurs in both idle and busy frequency bands. Thus, it would be an assistance signal for CR user energy detection to detect PU signals. More clearly, the simultaneous presence of the fake signals with the PU signals causes a more powerful signal to be received by the CR users, and hence the detection probability Qdis increased.
Fig. 6 indicates the global detection and false alarm probabilities versus NAPF. Obviously, for a larger value of ρ(ρ~1), two hypotheses H0 and H1 cannot be easily distinguished. In other words, two conditional probabilities
0
( N )
p Λ H and p(ΛH1) are almost identical and the global
false alarm probability is remarkably increased. As explained before, the AP-PUEA causes a high detection probability compared with SS-PUEA.
In Fig. 7, the effect of received SNR from PU is studied in three different states; No-attack, AP-PUEA, and SS-PUEA. Two normalized attack factors ρ=0.3 and ρ=0.7 are considered. It can be observed that the global error probability is increased by increasing the SNR, especially for larger values of ρ. The reason is that without any defense strategy the presence of PUEA signals is not considered and the optimal value of the threshold is obtained based on noise variance. When SNR increases (noise power reduces in simulation) the global false alarm increases and consequently, total error probability under PUEA is increased in higher SNRs.
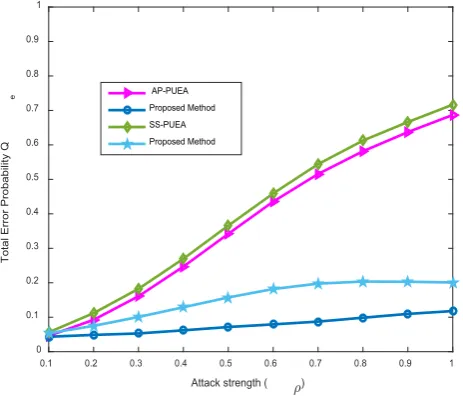
Fig. 8 demonstrates the global error probability versus NAPF for AP and SS scenarios with SNR=-5dB. As shown in the figure, in the AP and SS attacks, the global error probability is increased by increasing the NAPF and the error probability of SS-PUEA is almost higher than that of AP-PUEA. As mentioned before, for a constant value of normalized attack parameter, the AP and SS attacks have identical false alarm rate, whereas; SS-PUEA has a lower detection probability than that of AP-PUEA. By contrast, by the proposed method, increasing NAPF leads to a small change in the rate of total error probability.
0 50 100 150 200 250 300 350 400 450 500
Sensing Interval
0 0.1 0.2 0.3 0.4 0.5 0.6 0.7 0.8 0.9 1
Estimation of Attack Strength
Estimated Value ( ) True Value ( )
Fig. 3. The convergence of normalized attack power factor (NAPF) in AP-PUEA (ρ=0.3)
0.1 0.2 0.3 0.4 0.5 0.6 0.7 0.8 0.9 1
Attack strength
0 0.1 0.2 0.3 0.4 0.5 0.6 0.7 0.8 0.9 1
Q
d
& Q
fa
Qd for AP-PUEA Qd for SS-PUEA Q
f a for AP-PUEA
Q
f a for SS-PUEA
Qd
Qf a AP-PUEA
SS-PUEA
AP-PUEA
SS-PUEA
Fig. 6. The total detection and false alarm probabilities versus NAPF (attack strength) in SNR=-5dB
0 0.1 0.2 0.3 0.4 0.5 0.6 0.7 0.8 0.9 1
Total False Alarm Probability (Q f a)
0 0.1 0.2 0.3 0.4 0.5 0.6 0.7 0.8 0.9 1
Total Dection Probability (Q
d
)
AP-PUEA ( =0.3) SS-PUEA ( =0.3) AP-PUEA ( =0.7) SS-PUEA ( =0.7)
SS-PUEA AP-PUEA
Fig. 5. The global detection probability versus the false alarm probability in SNR=-10dB
0 50 100 150 200 250 300 350 400 450 500
Sensing Interval
0 0.1 0.2 0.3 0.4 0.5 0.6 0.7 0.8 0.9 1
Estimation of Attack Strength
Estimated Value ( ) True Value ( )
5- conclusion
Primary user emulation attack (PUEA) was studied in cognitive radio (CR) networks. Assuming the attack strategy, the received reports of the CR users were used to estimate normalized attack power factor (NAPF) to obtain an optimum value of threshold that minimizes the global error probability. The parameter NAPF was defined as the ratio of average emitted power of the malicious PUEA to the average power of the legitimate PU. Two different attack strategies were investigated for the PUEA; Always present (AP) and spectrum sensing (SS) based attacks. It was concluded that without any defense strategy, the SS based emulator is a little more harmful than AP-PUEA. In addition, from the attacker’s point of view, the AP strategy cannot be a practical choice due to more power consumption. Numerical results validated the efficiency of the proposed approach compared with the conventional method.
References
[1] S. Haykin, “Cognitive radio: brain-empowered wireless communications,” IEEE Journal on Selected Areas in Communications, 23(2) (2005) 201-220.
[2] Akyildiz IF, Lee WY, Vuran MC, Mohanty S, “NeXt generation/dynamic spectrum access cognitive radio wireless networks: A survey,” Computer Networks,
50(13) (2006) 2127-2159.
[3] Mishra SM, Sahai A, Brodersen RW, “Cooperative sensing among cognitive radios,” In Proceedings of the IEEE International Conference on Communications,
(2006) 1658-1663.
[4] I. F. Akyildiz, B. F. Lo, R. Balakrishnan, “Cooperative spectrum sensing in cognitive radio networks: A survey,”
Physical Communication, 4(1) (2011) 40-62.
[5] R. Chen, J. m. Park, Y. T. Hou and J. H. Reed,“Toward secure distributed spectrum sensing in cognitive radio networks,” IEEE Communications Magazine, 46(4) (2008) 50-55.
[6] Chen R, Park JM, Reed JH, “Defense against primary user emulation attacks in cognitive radio networks,”
IEEE Journal of Selected Area in Communications, 26(1) (2008) 25-37.
[7] Anand S, Jin Z, Subbalakshmi K, “An analytical model for primary user emulation attacks in cognitive radio networks,” In Proceeding IEEE International Dynamic Spectrum Access Networks, (2008) 1-6.
[8] A. A. Sharifi, M. Sharifi, M. J. Musevi Niya. “Collaborative spectrum sensing under primary user emulation attack in cognitive radio networks,” IETE Journal of Research, 62(2) (2016) 205-211.
[9] A. A. Sharifi, M. J. Musevi Niya. “Robust cooperative spectrum sensing under primary user emulation attack in cognitive radio networks,” Journal of Computing and Security, 2(2) (2015) 109-117.
[10] Haghighat M, Sadough SMS, “Cooperative spectrum sensing for cognitive radio networks in the presence of smart malicious users,” International Journal of Electronics and Communications (AEU), 68(6) (2014) 520-527.
[11] A. A. Sharifi, M. Sharifi, M. J. M. Niya, “Secure cooperative spectrum sensing under primary user emulation attack in cognitive radio networks: Attack-aware threshold selection approach,” International Journal of Electronics and Communications (AEU), 70(1) (2016) 95-104.
[12] Chen. C, Cheng. H, Yao. Y-D, “Cooperative spectrum
sensing in cognitive radio networks in the presence of the primary user emulation attack,” IEEE Transactions on Wireless Communications, 10(7) (2011) 2135-2141.
[13] A. Ahmadfard, A. Jamshidi, A. Keshavarz-Haddad, “Game theoretic approach to optimize the throughput of cognitive radio networks in physical layer attacks,”
Journal of Intelligent & Fuzzy Systems, 28(3) (2015) 1281-1290.
[14] Ghaznavi. M, Jamshidi. A, “Defence against primary user emulation attack using statistical properties of the cognitive radio received power,” IET Communications, 11 (2017) 1535-1542.
0.1 0.2 0.3 0.4 0.5 0.6 0.7 0.8 0.9 1
Attack strength ( )
0 0.1 0.2 0.3 0.4 0.5 0.6 0.7 0.8 0.9 1
Total Error Probability Q
e AP-PUEA
Proposed Method SS-PUEA Proposed Method
Fig. 8. The total error probability versus NAPF (ρ) in SNR=-5dB
-10 -9 -8 -7 -6 -5 -4 -3 -2 -1 0
The Average SNR (dB)
0 0.1 0.2 0.3 0.4 0.5 0.6 0.7 0.8 0.9 1
Total Error Probability Q
e
No Attack ( =0) AP-PUEA ( =0.3) SS-PUEA ( =0.3) AP-PUEA ( =0.7) SS-PUEA ( =0.7)
=0.3 =0.7
[15] S. Shrivastava, A. Rajesh, P. K. Bora, “Defense against primary user emulation attacks from the secondary user throughput perspective,” International Journal of Electronics and Communications (AEU), (2018) 131-143.
[16] J. Ma, G. Zhao, Y. Li, “Soft combination and detection for cooperative spectrum sensing in cognitive
radio networks,” IEEE Transactions on Wireless Communications, 7(11) (2008) 4502-4507.
[17] M. Sharifi, A. A. Sharifi, M. J. M. Niya, “A new weighted energy detection scheme for centralized cognitive radio networks,” 7th international symposium on telecommunications, 2014.
Please cite this article using:
A. A. Sharifi, Investigation of Always Present and Spectrum Sensing Based Incumbent Emulators , AUT J.
Elec. Eng., 51(1) (2019) 39-44.