509
Int. J. Data Envelopment Analysis (ISSN 2345-458X)
Vol.2, No.4, Year 2014 Article ID IJDEA-00243, 18 pagesResearch Article
Presenting a New Model for Bank’s Supply Chain
Performance Evaluating with DEA Solution
Approach
R.Shahverdi*
Department of mathematics, Qaemshahr Branch, Islamic Azad University, Qaemshahr, Iran.
Received 7 September 2014, Revised 20 November 2014, Accepted 25 December 2014
Abstract
Data Envelopment Analysis (DEA) is a method for measuring the efficiency of peer decision making units (DMUs) with multiple inputs and outputs. The traditional DEA treats decision making units under evaluation as black boxes and calculates their efficiencies with first inputs and last outputs. This carries the notion of missing some intermediate measures in the process of changing the inputs to outputs of DMU and as a result the effect of these measures in the process of performance evaluation is not considered. Recently, some models are created in DEA which can evaluate the system in multi stages and consider the relations between the systems. The objective of this paper is to investigate efficiency decomposition in a three-stage process that has a two independent parallel stages linking with a one final stage. This three stage processes calculate the efficiency of organization with considering intermediate constraints. Finally, we illustrate the proposed method with numerical example.
Keyword: Data Envelopment Analysis (DEA), efficiency, Intermediate measure, Multi stage.
1. Introduction
Nowadays, the performance evaluation discussion of organizational units and consequently its impression on the overall performance of the institution is very challenging and important. In fact, to achieve its goal, including customer satisfaction and maximizing profits, the organizations should assess
* Corresponding author: [email protected]
the performance of their unites based on appropriate criteria. Namely before the beginning of the improving process, they must have clear picture of their structure because getting accurate and actual results of operation can provide relevant context to decide. DEA is a nonparametric method that includes techniques for evaluating an organization’s efficiency or productivity and using it can create
the possibility for its management which in order to reach ideals, the right attitude on the performance of collection can adjusts collection’s system processes and units, applying to useful one, also, can be as a pattern for all unites. Thus, the basic and classic models of data envelopment analysis came to the existence to calculate the efficiency of decision making unites considering the inputs and outputs. In recent years, due to more complexity of systems and increasing the size of organizations processes, the efficiency of these classical models declined and required a more detailed analysis of the decision making unites. Perhaps the more important reason for the decline in the effectiveness of these methods for larger systems is that the classical models do not consider internal processes of systems and they are to be accounted as a “Black box”, whereas in the multi-stage data envelopment analysis which are a
special case of that of network†, relevance and linkage between internal processes is considered for determining the efficiency of the system.
Now, due to the fact that this study’s structure of proposed supply chain consists of 3 sub DMUs and more than one stages, we decided, for this complicated structure performance assessment that can concurrently take the impact of these intermediate indexes into account, use multi-stage data envelopment analysis which is a special state of network data envelopment analysis.
2. Multi-stage Data Envelopment Analysis
In the performance assessment process, using DEA, new comments became propounded and systematic one has changed. The processes have been broken to allow the impact of intermediate indicators on institution’s performance to be studied. As to this study, the applied DEA models can be
divided into two categories:
A) Close system
These are the process in which output intermediate variables enter into the next stage without any change, in the other words; output intermediate variables in any stage are the sole inputs for the next. The simplest example of the system can be observed in fig.1. In this figure, a consecutive system has shown that the whole process consists of two connected series sub-systems. As is evident from the fig.1, all outputs of the first subsystem enter into the second as input.
Fig.1: a sample of a close system
In this line, as an example, seiford and Zhu [11] used the structure of a two-stage network model to measure the profitability and supply ability of American banks. In the proposed model, the profitability toward entry personnel, assets, factory owner shares and output profit and revenue is considered in the first step. In the second phase, also, by the use of the inputs come from the first phase i.e. profit and income than outputs of market value, return of capital and earning per share are evaluated. Zhu [15] continued the same routine again and using data envelopment analysis to appraise the economic efficiency of over 500 the world’s top companies. Somewhere or other Chilingerian and Sherman [3] offered a two-stage process, using DEA to study clinicians’ attention rate.
By dividing the processes and the systems into subsystems, it’s easier to identify inefficient sources that
can be applied to remove inefficiencies. This concept of a two-step analysis has been applied in the other researches such as performance assessment of mental health care, education, information technology, purchasing and supply management and suchlike [2,8,9,11]. In all above-mentioned cases, three levels of independent performance for the first stage, second stage and whole process achieve and DEA model that calculate the values of efficiency doesn’t reflect the relationship between the parts and the whole system. Chiang Kao, Shiuh- Nenwang [7], different from previous studies that had an independent look on the whole process and sub-processes, with the use of the chain relationship between subsystems showed that there is a relationship between efficiency in the whole collection and sub-systems . The efficiency is calculated, using DEA is more significant than that is done independently. Kao and Hwang [7] have applied this model for insurance companies in Taiwan and compared the results with the independent approach.
B) Open system
The process in which the output intermediate variables in one stage is as a part of the input in the next, that is, except to the first phase, the other phases have another inputs in addition to intermediate variables. Furthermore, all output values of a special phase are not essentially as inputs for others and a part of that can be expelled from the system. See fig.2 as an example. In this process, a part of the first subsystem outputs is emitted from the system or in somewhere else, a part of the second inputs enter into the system from outside and it means that the system works as an open system.
Stage
1
Fig.2: a sample of an open system
There are many examples in industries in which a part of outputs in a special phase may be available for consumers as products or services and the rest of them are imported to next phase in the process for fulfillment. The models used in this area are mostly in the network DEA mold. In these systems, each phase act as an open system and is receptive of input from outside and it possibility interacts with the last system in addition to outside ones. Goolani and Hackman [6] proposed an efficiency assessment model for systems, composing of two associated sub-system. Each of the sub-systems uses separate resources and produces outputs. E.g. these resources can be as labor or capital. The proposed network DEA model by Goolani and Hackman [6] enables to calculate the total cumulative efficiency coupled with the efficiency value of each system [9]. Castelli et al discussed over two-stage and two-layer DMUs [1]. Far and Whittaker with a network approach and Far, Grospof, Tone and Tsutsui with the approach of covariate based network DEA, are another samples [4,5,12,13].
3. Chen and Zhu DEA model
Consider the following BBC model, offering by Banker et al:
𝜃∗= 𝑚𝑖𝑛 𝜃
𝑠. 𝑡. ∑ 𝜋𝑗𝑥𝑖𝑗 ≤ 𝜃𝑥𝑖𝑜 , 𝑖 = 1,2, … , 𝑚 𝑛
𝑗=1
∑ 𝜋𝑗𝑦𝑟𝑗 ≥ 𝑦𝑟𝑜 , 𝑟 = 1,2, … , 𝑠 𝑛
𝑗=1
∑ 𝜋𝑗
𝑛
𝑗=1
= 1
𝜋𝑗 ≥ 0 , 𝑗 = 1,2, … , 𝑛
In the above model, xio is ai-th input and yro is r-th output of j-th DMU under estimation. If θ*=1, the
j-th observation locates on j-the efficiency boundary. Oj-therwise, if θ*<1, then the j-th DMU is inefficient.
Since the target of model (1) is to diminish the inputs and keep the outputs unchanged in a special level, it’s so-called input-oriented model.
Stage
1
Similarly, output-oriented model can also be found. The aim in this model is to increase outputs and to keep inputs fixed in the same level.
∅∗= 𝑚𝑎𝑥 ∅
𝑠. 𝑡. ∑ 𝜋𝑗𝑥𝑖𝑗 ≤ 𝑥𝑖𝑜 , 𝑖 = 1,2, … , 𝑚 𝑛
𝑗=1
∑ 𝜋𝑗𝑦𝑟𝑗 ≥ 𝜙𝑦𝑟𝑜 , 𝑟 = 1,2 … , 𝑠 𝑛
𝑗=1
∑ π𝑗
n
𝑗=1
= 1
𝜋𝑗≥ 0 , 𝑗 = 1,2, … , 𝑛
Both model (1) and (2) consequence the same efficiency boundary since θ*=1 if and only if φ*=1.
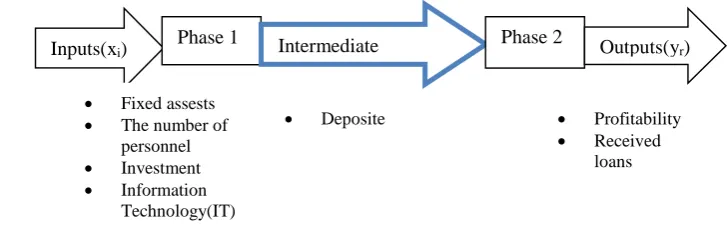
Figure 3 shows a general two-step process that employs the first phase’s inputs (i = 1,2,3, … , m)xito generate the outputs of (d = 1,2,3, … D)zd. These zd are used as inputs of the second phase to produce the outputs of(r = 1,2,3, … , s)yr.
Fig.3 : intermediate indexes.
According to supply chain structure of Wang et al in the above figure, fixed assets, the number of employees, investment, and information technology were considered as input of the first stage [14]. In the second phase, also, they estimate the performance of banks, using the profitability and loan’s deductions in them as outputs.
In order to solve these kinds of problems and intermediate indexes to be accounted, Chen and Zhu [2] developed model (1) as follows:
Deposite Profitability
Received
loans
Inputs(xi) Phase 1 Intermediate indexes
Phase 2 Outputs(yr)
Fixed assests
The number of
personnel
Investment
Information
𝑀𝑖𝑛 𝑤1𝛼 – 𝑤2𝛽
(First phase)
𝑠. 𝑡. ∑ 𝜆𝑗𝑥𝑖𝑗 ≤ 𝛼𝑥𝑖𝑜 , 𝑖 = 1,2, … , 𝑚 𝑛
𝑗=1
∑ 𝜆𝑗𝑧𝑑𝑗 ≥ 𝑧̃𝑑𝑜 , 𝑑 = 1,2, … , 𝐷 𝑛
𝑗=1
∑ 𝜆𝑗
𝑛
𝑗=1
= 1
𝜆𝑗≥ 0 , 𝑗 = 1,2, … , 𝑛
(Second phase)
∑ 𝜇𝑗𝑧𝑑𝑗 ≤ 𝑧̃𝑑𝑜 , 𝑑 = 1,2,3, … , 𝐷 𝑛
𝑗=1
∑ μj𝑦𝑟𝑗 ≥ 𝛽𝑦𝑟𝑜 , 𝑟 = 1,2, … , 𝑠 n
𝑗=1
∑ μ𝑗
n
𝑗=1
= 1
𝜇𝑗≥ 0 , 𝑗 = 1,2, … , 𝑛
Where xij is the i-th input and yrj is r-th output of j unite andi = 1,2,3, . . , m;r = 1,2,3, … , s ;j =
1,2,3, … , n and "o" is an underestimation unite. α and β are also efficiency values, relating to phase 1 and 2 respectively. w1andw2 are allocated weights into first and second phases that if the phases have the same importance degree, they are equal to one. Moreover, 𝑧𝑑𝑗is intermediate input, accounting as input for the first and output for the second phase. The sign “͠“ indicates unknown deciding variable, it
signifies they are z̃do. Chen and Zhu model is to contemplate to calculate intermediate variables in the most optimum state with the decrease of inputs and increase of outputs simultaneously. It’s worthy of
mention that according to model (3), the companies take into account as efficient ones that the efficient values in both phases are equal to one (𝛼 = 𝛽 = 1).
4. DEA model of Ebrahimnejad and colleagues for the new process
Contemplate the an organization or a system like fig.4 which have two parallel systems, referring to as A and B each of which have to distinct input groups, calling 𝑋1and 𝑋2. It’s hypothesis that two systems act as two distinct systems and there is no any relationship between them. In overall, system works such a way that all systems A and B outputs consumed as the input of other connected series system, supposedly C. Output group of systems A and B name W and V respectively. Finally, systems C, also, turn intermediate variables into Y outputs.
Fig.4: a chain of two parallel and one series subsystems
Now, take an organization with n amount of similar DMU into consideration that each of DMUs act under process in fig.4. To put DMUj ( = 1,2,3, … , n) and xij1as i-th (i = 1,2,3, … , m) input of system A
and Wtj as t-th(t = 1,2,3, … , k)output variable of system A and input for system C and xej2 as e-th (e = 1,2,3, … , c) input of system B, Vrj as r-th(r = 1,2,3, … , h) output variable of system B and C, and
ultimately, ysj as s-th (s = 1,2,3, … , q) output of system C or the whole system, under observation, Ebrahimnejad et al developed DEA model of Chen and Zhu for the special process in order to use that for assessing the same performance processes and identifying efficient and inefficient resources.
1.4. Traditional approach in performance assessing for an especial process
A common approach toward an especial problem is to encounter with the above chain as so-called Black Box and relinquish internal processes and intermediate variables. That is, we consider the whole system as a collection of inputs and outputs instead of parallel and series systems. This method is shown in fig.5.
Though, this Black Box method doesn’t consider the interior mechanism of making decision unite, it’s very useful. Because in many cases, especially about complicated systems, if we want to consider interior processes, getting information of inefficient resources is very difficult.
2.4. The analysis of Chen and Zhu DEA model about the structure of a special process
In this section, we are going to formulate the processes of fig.4, using Chen and Zhu model. After identifying the limitations and assigning the relationship between variables based on Chen and Zhu model, ultimately we will have the following linear model:
𝑚𝑖𝑛 𝑤1𝜃 + 𝑤2𝜃′− 𝑤3𝛽
𝑠. 𝑡. ∑ λ𝑗𝑥𝑖𝑗1 ≤ 𝜃𝑥𝑖𝑜1 , 𝑖 = 1,2, … , 𝑚 𝑛
𝑗=1
∑ 𝜆𝑗𝑤𝑡𝑗 ≥ 𝑛
𝑗=1
𝑤̃𝑡𝑜 , 𝑡 = 1,2, … , 𝑘
∑ 𝜆𝑗′𝑥𝑒𝑗2 ≤ 𝜃′𝑥𝑒𝑜2 , 𝑒 = 1,2, … , 𝑐 𝑛
𝑗=1
∑ 𝜆𝑗′𝑣𝑟𝑗 ≥ 𝑣̃𝑟𝑜 𝑛
𝑗=1
, 𝑟 = 1,2, … , ℎ
∑ 𝜋𝑗𝑤𝑡𝑗≤ 𝑛
𝑗=1
𝑤̃𝑡𝑜 , 𝑡 = 1,2, … , 𝑘
∑ 𝜋𝑗𝑣𝑟𝑗≤ 𝑣̃𝑟𝑜 𝑛
𝑗=1
, 𝑟 = 1,2, … , ℎ
∑ 𝜋𝑗𝑦𝑠𝑗 ≥ 𝛽y𝑠𝑜 , 𝑠 = 1,2, … , 𝑞 𝑛
𝑗=1
∑ λ𝑗
n
𝑗=1
= 1
∑ λj′ n
𝑗=1
= 1
∑ 𝜋𝑗 n
𝑗=1
= 1
θ, θ′ and βare efficiency value of A, B and C systems respectively. With the contemplation of intermediate variables as unknown ones, the model’s aim is that to decrease inputs 𝑥𝑖𝑗1 and 𝑥𝑒𝑗2 and
increase the outputs 𝑦𝑠𝑗 at the same time, an appropriate level of intermediate variables such as 𝑤𝑡𝑗 and
𝑣𝑟𝑗 obtains.
3.4. Structure method of Ebrahimnejhad et al DEA model.
Consider Chen and Zhu two-stage model to examine indirect impression of information technology on institution’s performance. This indirect examine has done such a way that information technology
impacts directly on intermediate variables (bank deposits) and the effects of that on the institution performance (final output). With the attention of this issue, intermediate variables in this model are highly important and that’s the reason why they took as unknowns. It helps the indirect impression of
input variables on the final output ones in a two or multi-stage system. By virtue of this issue, e.g. take intermediate variables as unknowns, some other limitations add to the model, just like Chen and Zhu two-stage model. However, in the performance assessment of a multi-stage system (for example fig.4) intermediate variables are important due to the fact that it merely creates limitations for our system and we concentrate on efficiency values of subsystems and the whole system. It’s not essential in this state
to take these variables unknown and impose additional limitations onto the model. What’s important is to achieve the weights such a way that to efficiency of each subsystem and the whole system in the maximum underestimation DMU. With these interpretations, consider the limitations, relating to intermediate variables of model (4).
Limitations, relating to 𝑤𝑡𝑗:
∑ 𝜆𝑗𝑤𝑡𝑗 ≥ 𝑛
𝑗=1
𝑤̃𝑡𝑜 , 𝑡 = 1, … , 𝑘
∑ 𝜋𝑗𝑤𝑡𝑗≤ 𝑛
𝑗=1
𝑤̃𝑡𝑜 , 𝑡 = 1, … , 𝑘
Limitations for 𝑣𝑟𝑗:
∑ 𝜆𝑗′𝑣𝑟𝑗 ≥ 𝑣̃𝑟𝑜 𝑛
𝑗=1
, 𝑟 = 1, … , ℎ
∑ 𝜋𝑗𝑣𝑟𝑗≤ 𝑣̃𝑟𝑜 𝑛
𝑗=1
, 𝑟 = 1, … , ℎ
With the comparison between relationships, it’s clear-cut that the limits for intermediate variables can
∑ 𝜆𝑗𝑤𝑡𝑗 ≥ ∑ 𝜋𝑗𝑤𝑡𝑗 𝑛
𝑗=1 𝑛
𝑗=1
, 𝑡 = 1, … , 𝑘
∑ 𝜆𝑗′𝑣𝑟𝑗 ≥ ∑ 𝜋𝑗𝑣𝑟𝑗 𝑛
𝑗=1 𝑛
𝑗=1
, 𝑟 = 1, … , ℎ
The recent two limits guarantee in order that input intermediate variable to system C not to be more than output variable of system A and furthermore, input intermediate variables of system C not to be more than output system A. Now, if we want to apply the above changes on model (4) and then we reach the following linear DEA model.
𝑚𝑖𝑛 𝑤1𝜃 + 𝑤2𝜃′− 𝑤3𝛽
𝑠. 𝑡. ∑ λ𝑗𝑥𝑖𝑗1 ≤ 𝜃𝑥𝑖𝑜1 , 𝑖 = 1,2, … , 𝑚 𝑛
𝑗=1
∑ 𝜆𝑗𝑤𝑡𝑗 ≥ ∑ 𝜋𝑗𝑤𝑡𝑗 𝑛
𝑗=1 𝑛
𝑗=1
, 𝑡 = 1, … , 𝑘
∑ 𝜆𝑗′𝑥𝑒𝑗2 ≤ 𝜃′𝑥𝑒𝑜2 , 𝑒 = 1, … , 𝑐 𝑛
𝑗=1
∑ 𝜆𝑗′𝑣𝑟𝑗 ≥ ∑ 𝜋𝑗𝑣𝑟𝑗 𝑛
𝑗=1 𝑛
𝑗=1
, 𝑟 = 1, … , ℎ
∑ 𝜋𝑗𝑦𝑠𝑗 ≥ 𝛽y𝑠𝑜 , 𝑠 = 1, … , 𝑞 𝑛
𝑗=1
∑ λ𝑗
n
𝑗=1
= 1
∑ λj′ n
𝑗=1
= 1
∑ 𝜋𝑗 n
𝑗=1
= 1
𝜃 ≤ 1
𝜃′ ≤ 1
𝛽 ≥ 1
λ𝑗 , 𝜆𝑗′ , 𝜋𝑗 ≥ 0 , 𝑗 = 1, … , 𝑛
Model (5) is to assess performance process of fig (4). This model’s aim is that according to intermediate
efficiency value of A, B and C system, namely θ, θ′ and β to be achieved for DMUj . the limitations
θ≤ 1 and θ′≤ 1, don’t allow the inputs to go over an especial level and limitation β≥ 1warranties the
outputs to don’t go down of an acceptable level. The values θ= θ′= β = 1 and λ
jo= λjo′ = πjo= 1
are feasible results for model (5).
5. Absorption and resource allocation process (open system) in the country banks.
Country banks act in the two overall phases (stages), in the first, the resources earmarks and afterwards in phase 2, they make money with the allocation of these resources. Here, we defined the inputs and outputs for each of these phases and its formed subsystems. To do this, we analyzed the process. Phase1, namely resource absorption includes two distinct subsystems, calling the first source absorption (time deposit) and the second one (money on deposit for documentary credits) (fig.6), Consider that we hypothesized that these two subsystems act independently and do not have any connection together. In the second phase, independent inputs (X3) with the outputs of phase 1 (as inputs) enter into the second phase. Finally, this sub-system (source allocation) invests the deposits and sources in the different shape to earn money for banks.
The significant point here is that achieved outputs in the last stage are divided into two groups: beneficial (good) and non-beneficial (bad) outputs. Beneficial outputs are that one’s which are useful for the banks and are somehow income for them. In contrast, non-beneficial outputs are ones which are maleficent for them and to be subtracted. The present connection between subsystems is shown below:
Fig.6: absorption and source allocation process (open system) The first subsystem:
Financial resources absorption
The second subsystem: Credit resources absorption
The Third subsystem: Recourses allocation Stage 1
Stage 2
Stage 3
First Phase:Resources Absorption
Second Phase: (Recourses allocation)
𝑋1
𝑋2
𝑋3
𝑌𝑏
1.5. Introducing of this research understudied indexes in absorption and source allocation
process.
A) Input indexes:
𝑥1:Payment on account profit to investors
𝑥2: Costumers obstructions for documentary credits and surety bonds.
𝑥3:The sum of prices, including doubtful arrival of claims and advertising expenditures and etc.
𝐵) Intermediate indexes:
𝑣: Time deposit (short and long time)
𝑤: Other deposits (cash deposit for giving documentary credits and surely bonds)
C) Output indexes:
𝑦𝑔 : The efficient outputs (sum of prices and remaining checking facilities)
𝑦𝑏 ∶The non-efficient outputs (remaining non-checking facilities, including on-time and delayed and doubtful arrival claims).
6. This study’s developed DEA model, relating to open system structure.
Consider the process in fig.6. The hypothesis here is that parallel systems work separately and don’t connect together and moreover, all output intermediate variables of two parallel sub-systems plus x3 as inputs are under authority of third subsystem. Since obtained outputs in this phase divided into efficient (good) and non-efficient (bad) outputs, to decrease the impact of non-efficient outputs, firstly output variable (yb)is multiplied to -1, and then we add the value of tf to all non-efficient outputs to turn it into positive such a way that the following relationship establishes.
𝑦𝑓𝑗−𝑏 = −𝑦𝑓𝑗𝑏 + 𝑡𝑓 > 0
Plus, tf achieves from the following relationship:
𝑡𝑓 = 𝑀𝑎𝑥{𝑦𝑓𝑗𝑏} + 1
𝑚𝑖𝑛 0.5 𝜃 + 0.25 𝜃′− 0.25 𝛽
𝑠. 𝑡. ∑ λ𝑗𝑥𝑖𝑗1 ≤ 𝜃𝑥𝑖𝑜1 , 𝑖 = 1, … , 𝑚
𝑛
𝑗=1
∑ 𝜆𝑗𝑤𝑡𝑗 ≥ ∑ 𝜋𝑗𝑤𝑡𝑗 𝑛
𝑗=1 𝑛
𝑗=1
, 𝑡 = 1, … , 𝑘
∑ 𝜆𝑗′𝑥𝑒𝑗2 ≤ 𝜃′𝑥𝑒𝑜2 , 𝑒 = 1, … , 𝑐 𝑛
𝑗=1
∑ 𝜆𝑗′𝑣𝑟𝑗 ≥ ∑ 𝜋𝑗𝑣𝑟𝑗 𝑛
𝑗=1 𝑛
𝑗=1
, 𝑟 = 1, … , ℎ
∑ 𝜋𝑗𝑥𝑙𝑗3 ≤ 𝑥𝑙𝑜3 𝑛
𝑗=1
, 𝑟 = 1, … , ℎ
∑ 𝜋𝑗𝑦𝑠𝑗 ≥ 𝛽y𝑠𝑜 , 𝑠 = 1, … , 𝑞 𝑛
𝑗=1
∑ 𝜋𝑗𝑦𝑓𝑗−𝑏 ≥ 𝛽𝑦𝑓𝑜−𝑏 , 𝑓 = 1, … , 𝑢
𝑛
𝑗=1
∑ λ𝑗
n
𝑗=1
= 1
∑ λj′
n
𝑗=1
= 1
∑ 𝜋𝑗 n
𝑗=1
= 1
𝜃 ≤ 1
𝜃′ ≤ 1
𝛽 ≥ 1
λ𝑗 , 𝜆𝑗′ , 𝜋𝑗 ≥ 0 , 𝑗 = 1, … , 𝑛
We considered target function coefficient according to system analyzer as follows:
𝑤1= 0.5 , 𝑤2= 0.25 , 𝑤3= 0.25
θ is efficiency for system 1 and θ′ for the second and β for the third one. Now, we are going to use new
7. Data table
Statistical society of research are the most important banks in our country, albeit some of the banks due to numerous reasons such as being new founded, lack of availability to data and suchlike, omitted of it. Each of these banks has especial properties like documentary credit, Payment on account profit to investors and etc., that their efficiency only can be logically assessed that homogeneous unites are to be compared. Obtained data in these banks are the average (per capita) data per human resource in banks, collecting 2012 and presented as tables (1), (2) and (3) for each subsystem.
Table1.Inputsand outputs variables values of the first subsystem (unite: per million Rials).
Banks
Input variables Output variables (Intermediate)
𝒙𝟏 𝒗
Eghtesad-E-Novin 5704 47996
Parsian 7302 48322
Pasargad 5816 44439
Tat 1368 21341
Tejarat 959 10840
Refah-E-Kargaran 456 4892
Saman 4021 33320
Sepah 851 8670
Sarmayeh 2479 16287
Sina 2642 22278
Shahr 1406 18834
Saderat-E-Iran 675 7212
Karafarin 2837 25209
Gardeshgari 627 7579
Table2.inputsand outputs variables values of the second subsystem (unite: per million Rials).
Banks
Input variables Output variables (Intermediate)
𝒙𝟐 𝒘
Eghtesad-E-Novin 13831 2397
Parsian 8151 4614
Pasargad 32252 4557
Tat 3091 484
Tejarat 11401 1585
Refah-E-Kargaran 904 142
Saman 9530 4353
Sepah 2307 458
Sarmayeh 4233 1148
Sina 1429 164
Shahr 3051 507
Saderat-E-Iran 2805 933
Karafarin 15449 1682
Gardeshgari 22159 3867
Melli 2405 799
Table3.inputs and outputs variables values of the third subsystem (unite: per million Rials).
Banks
Input variables Output variables
𝒙𝟑 𝒚𝒈 𝒚𝒃
Eghtesad-E-Novin 1226 34204 10619
Parsian 1202 46327 11975
Pasargad 963 46330 2502
Tat 3255 27858 1288
Tejarat 728 15651 3605
Refah-E-Kargaran 549 4921 1179
Saman 1674 33890 14456
Sepah 841 11459 2189
Sarmayeh 1780 23551 7392
Sina 768 20991 2897
Shahr 1111 15372 828
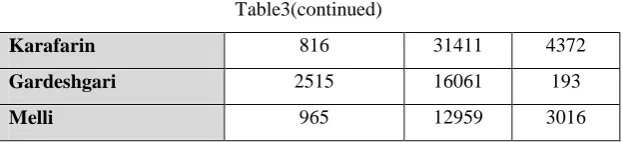
Table3(continued)
Karafarin 816 31411 4372
Gardeshgari 2515 16061 193
Melli 965 12959 3016
Since output variables of both first and second subsystem, including the outputs of deposit absorption (sources) on behalf of documentary credits and guaranties, are the inputs for the third subsystem or source allocation section as well, in table (3) only 𝑥3 inputs and efficiency and non-efficiency outputs have been shown. Ultimately, the model estimated, using model (6) and Lingo software and each sub-system’s efficiency score have brought in table (4).
Table 4.the results, obtaining of developed model performance
Banks 𝜽 𝜽′ 𝜷 Total efficiency Black box
Eghtesad-E-Novin 0.45593(15) 0.29956(11) 1(1) 0.55286(15) 0.75849(15) Parsian 0.70176(11) 0.98853(2) 1(1) 0.84801(3) 1(1) Pasargad 0.88117(4) 0.24986(14) 1(1) 0.75305(9) 1(1)
Tat 1(1) 0.47176(7) 1(1) 0.86794(2) 1(1)
Tejarat 0.81937(7) 0.28439(13) 1(1) 0.73078(10) 1(1)
Refah-E-Kargaran 1(1) 1(1) 1(1) 1(1) 1(1)
Saman 0.63563(12) 0.40855(9) 1(1) 0.66995(12) 0.92955(13)
Sepah 0.78198(8) 0.61382(5) 1(1) 0.79445(6) 1(1)
Sarmayeh 0.55183(14) 0.28837(12) 1(1) 0.59800(14) 0.86140(14)
Sina 0.57548(13) 0.65755(3) 1(1) 0.70212(11) 1(1)
Shahr 0.87411(5) 0.49016(6) 1(1) 0.80959(5) 1(1)
Saderat-E-Iran 0.86887(6) 0.43601(8) 1(1) 0.79344(7) 0.94227(12) Karafarin 0.70398(10) 0.22005(15) 1(1) 0.65700(13) 1(1) Gardeshgari 0.96487(3) 0.31321(10) 1(1) 0.81073(4) 1(1)
Melli 0.76054(9) 0.64244(4) 1(1) 0.79088(8) 1(1)
efficiency) which in this weight average, considering to the importance of sub-systems, we gave the first subsystem double weight than the others. In addition to that, the sixth column (Black Box) presents supply chain structure efficiency irrespective of intermediate indexes. As can be seen, Refah-e-karegaran bank gain number 1 in all 3 columns of performance assessment of its subsystems and therefore, it’s efficient in overall. It means that only banks which are efficient in any subsystem can be taken into account for efficient one. If we put the table into perspective, it’s scriptable that all banks are efficient in the source allocation section. In financial sources absorption (the first subsystem), Refah-e-karegaran and Tat banks were efficient 100% and Eghtesadenovin, Sarmayeh and Sina banks have the least efficiency in order. In the credit sources section (the second subsystem), it was only Refah-e-karegaran bank which has had 100% efficiency and Karafarin, Pasargad and Tejarat placed in the lowest level. Thanks to comparison between degrees of the process’s components and total efficiency, it’s easy
to understand that all banks have the same degree in components and total efficiency that it indicates that total performance of collection originates from the performance of its components. In the sixth column (Black Box) which shows the efficiency of the whole supply chain structure without any consideration of intermediate indexes, it can be seen that all banks except Eghtasadnovin, Saman, Sarmayeh and Saderat-e-iran have the efficiency score equal to 1, however, the efficiency score of these banks in the relevant subsystems isn’t equal to 1 which it stipulates the importance of taking care of interior processes (indexes) to efficiency calculation of a supply chain.
8. Conclusion and the recommendations for the future
Due to the fact that traditional models act as Black Box, and don’t consider the intermediate processes, when we want to assess a complicated and chain process, they are inefficient. To cope with this problem, researchers have strived to analyze and measure complicated systems. In this order, muli-stage data covering analysis models came to the existence. This stage shows that for accurate measuring of a multi-stage system, the process must be analyzed and seen multiple subsystems connected with independent inputs and outputs or dependent (based on the special process) one. Thus, this is a way to measure the impact of unites to each other and identify efficient and non-efficient factors. A developed model is for the case that parallel subsystems don’t have any connection to each other and act separately. As a new
References:
[1] Castelli, L., Pesenti, R., Ukovich, W. (2004) DEA-like models for efficiency evaluation of hierarchically structured units. European Journal of Operational Research, 154(2):465-76.
[2] Chen, Y., Zhu, J., (2004) Measuring Information Technology’s Indirect Impact on Firm Performance, Information Technology and Management 5, 9–22.
[3] Chilingerian J, Sherman HD. (2004) Health care applications: From Hospitals to Physician, from productive efficiency to quality frontiers.
[4] Fare, R.,Grosskopf S. (1996) Productivity and intermediate product: A frontier approach. Economics Letters, 50:65-70.
[5] Fare, R., Whirraker, G. (1995) An intermediate input model of dairy production using complex survey data. Journal of Agricultural Economics, 46(2): 201-13.
[6] Golany, B., Hackman, S.T., Passy, U. (2006) An efficiency measurement framework for multistage production systems. Annals of Operational Research, 145: 51-68.
[7] Kao C, Hwang SN., (2007) Efficiency decomposition in two-stage data envelopment analysis: an application to non-life insurance companies in Taiwan.European Journal of Operation Research, 185(1):418-29.
[8] Lovell, C.A.K. , Walters, L.C. , Wood, L.L., (1994) Stratified models of education production using modified DEA and regression analysis.
[9] Saranga, H., Moser, R., (2010) Performance evaluation of purchasing and supply management using value chain DEA approach. European Journal of Operational Research, 207:197-205.
[10] Schinnar, A.P., Kamis-Gould, E., Delucia, N., Rothbard, A.B. (1990) Organizational determinants of efficiency and effectiveness in mental health partial care programs. Health Services Research, 25:387-420.
[11] Seiford, L.M. , Zhu, J., (1999) Profitability and marketability of the top 55 US commercial banks, Management Science 45 , 1270-1288.
[12] Tone, K., Tsutsui, M. (2010) Dynamic DEA: A slacks-based measure approach. OMEGA, 38(3-4): 145-56.
[13] Tone, K., Tsutsui, M. (2009) Network DEA: A slacks-based measure approach. European Journal of Operational Research, 197(1): 243-52.