401 International Journal of Transportation Engineering,
Assessing Behavioral Patterns of Motorcyclists Based on
Traffic Control Device at City Intersections by
Classification Tree Algorithm
Mohammad Mehdi Khabiri1
Received: 17. 10. 2016 Accepted: 30. 07. 2017
Abstract
According to the forensic statistics, in Iran, 26 percent of those killed in traffic accidents are motorcyclists in recent years. Thus, it is necessary to investigate the causes of motorcycle accidents because of the high number of motorcyclist casualties. Motorcyclists' dangerous behaviors are among the causes of events that are discussed in this study. Traffic signs have the important role of traffic controller, and road surface marking is a tool for traffic separation and has a significant effect on drivers' behaviors. The aim of this study is to investigate the effect of variables, including traffic conditions, motorcyclists' psychological conditions, and symptoms and function of traffic lights on the motorcyclists' dangerous behaviors. In this study, classification tree method is used to determine the effective factors in some motorcyclists' dangerous behaviors such as the amount of deviation from the center lane, lane changing, and running red lights. The classification tree is easy to understand and interpret because of the graphical display of results. The data classification tree is made based on the classification and regression tree algorithm (CRT) in this study. The data are collected from the 7 intersections in a city with the medium population by video-based observation method. Hand-held cameras randomly record the motorcyclists' motions and, then, these behaviors are investigated in the office by playing back the videos at slow motion. The obtained trees show that the variables of traffic volume have the greatest impact on the motorcyclists' diversion from the center lane and lane changing. Also, the clarity of the pavement marking is effective in reducing deviation from the middle lane by cyclists so that, in the streets with the line color contrast of more than 1.36, deviation from the center lane is reduced by 25 cm.
Keywords: Pavement marking, classification trees, dangerous behavior, motorcyclist, color
contrast, lateral deviation from center lane.
Corresponding author E-mail: [email protected]
A hybrid algorithm for a two-echelon location-routing problem with simultaneous pickup …
International Journal of Transportation Engineering, 402
1. Introduction
Economic growth is often associated with the increased use of motor vehicles, which results in an increase in traffic accidents and deaths. The World Health Organization has announced traffic accidents as the sixth leading cause of death worldwide and the second leading cause of spending the last years of life with disabilities in developing countries by 2020 [Wong, Chung, and Hung, 2010].According to the report, half of all road deaths occur among motorcyclists, cyclists, and pedestrians. Urban transportation is faced with one of the biggest problems, i.e. motorcyclists ride their motor in city's pavements [Zare, Admlayi, Alipur and Tarkhān, 2014]. As the lack of proper attention to the behavior pattern of motorcycles causes many traffic-related problems in urban areas and leads to the occurrence of horrible accidents, learning, and acquisition of skills and experience in the control of the vehicle, as well as human and mental factors, have a special role in preventing traffic accidents. Motorcyclists' moods and mental states are both transient and stable. Transient mental state includes alcohol and drug use by motorcycle riders [Christophersen and Gjerde, 2015]. According to researchers, sudden lane changing maneuvers, increasing delays and environment impacts [Abdi, Safarzadeh and Salehikalam, 2016].
Road conditions also have a huge impact on motorcycle traffic safety compared with the vehicles with two or more axels. Parallel longitudinal grooves in the road pavement, as well as ineffective marking, can induce variability for motorcycle riders similarly, consistent with [Elliott et al., 2003], [Marzwan, 2014]. In a study, several effective factors for the number of motorcycle accidents with obstacles on the horizontal curve road have been examined and it is found that the increasing volume of traffic causes a reduction
in motorcyclists' safety in the horizontal curve [Gabauer, and Li, 2015].
In another study that was done on motorcycle accidents during 5 years, the average death of motorcycle passengers (except riders) in accidents was announced as 3.4 people per day [Tavakoli, Rabieyan, and Besharati, 2014]. In this study, the number of passengers was selected as one of the independent variables until determining how the number of passengers could impact the behavior of motorcycle riders. Godlay et al. examined the effect of center lanes and pavement markings on drivers' speed, and concluded that pavement marking could reduce the drivers' speed. Their research results suggest that driving speeds were reduced on the narrowest lane width road, and additionally reduced on conventional road sections that contained the center marking with painted crosshatching [Godley, Triggs and Fildes, 2004].
Mohammad Mehdi Khabiri
403 International Journal of Transportation Engineering, while in Iran, this figure is 8.23%. The
recorded statistics in Iran shows that, in the last 4 years, the most important violations of motorcyclists included running the red light, unnecessary change path, and lateral movement; thus, these variables are considered the dependent variables [Hendian, Moameni and Rahim, 2015]. The aim of this study is to investigate the impact of drivers’ personality characteristics and traffic factors (such as traffic volume, intensity of clear color of the pavement marking, and green time) as the independent variable on motorcyclists' three dangerous behaviors (lane changing, deviation from the center lane, and running red lights) as the dependent variable. Drivers’ personality characteristics in this study refer to their behaviors such as use/non-use of turning signal and wearing/non-wearing helmets; this behavior indicates legal or illegal personality.
2. Research Methodology
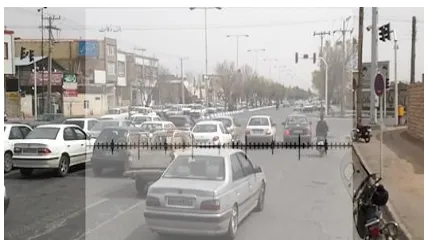
In this study, the factors affecting the motorcyclists' behavior are studied in an urban road network. The data were collected from passageways leading to 7 intersections in Yazd (a city with medium population), Iran, in 2015. By preparing films of the selected passages, the motorcyclists' reactions (i.e. degree of deviation from the center lane, number of lane changes, moving before the green light, use of motorcycle turn signal, and wearing helmets), traffic volume, and signal intersection timing, e.g. the duration of green light (fixed in some cases and variable in others) were selected and the color contrast of the pavement marking was determined using photos.
2.1 Data Collection
To obtain the number of lane changes, the motorcycles were followed from the moment of exposure to the intersection camera (less than 50 m) and their number of lane changes was recorded. In this study, the data of 258 motorcyclists were used for analysis. Frey and Fisher developed a model based on small
datasets, from 57 to 3,196 observations, to examine the response of modeling accuracy to changes in sample size [Frey and Fisher, 1999; Morgan, Daugherty, Hilchie, and Carey, 2003]. Increasing the amount of data used for building a model often led to no significant increase in model accuracy according to Oates and Jensen [Oates and Jensen, 1998]. Therefore, 258 data sets seemed enough. Weather conditions were constant for collecting and preparing the data. To eliminate the effect of high traffic volume (high density), the data were collected during off-peak hours. The light conditions (daylight and natural light) were normal and stable. Also, the weather was normal and sunny. In the study area, the lane width was suitable for motorcycle riders. Therefore, it was not considered as a variable. Motorcycles have much smaller dimensions and do not necessarily follow the same lane widths as cars.
The recorded videos were reviewed in the office and, in order to obtain a deviation from the center lane, each of the lanes was divided into a positive part on the right side and a negative part on the left side by grading in centimeter; the lateral distance is calculated according to the scale and space of the center of line. Placement angle and position of the camera in the video recording is not important; because of the actual size of a car in the image use to conversion dimensions in a picture to the actual size such as deviations calculation. The procedures of this study were approved by khabiri [khabiri, Elahizadeh and Diah, 2016].
Assessing Behavioral Patterns of Motorcyclists Based on Traffic Control Device at ….
International Journal of Transportation Engineering, 404 Figure 1.Location of intersections taken from
the city
Figure 2.Determining the amount of motorcycle deviation from the center lane
Table 1.Descriptive statistics of the obtained variables
Percentage/Average Employed variables
Less than 1 percent Drivers use of turn
signal
8 percent Drivers wear of
helmet
64 percent Drivers with no
lane changing
82 percent Motorcyclists
without running before green lights
65 centimeter Average of
deviation from the center lane
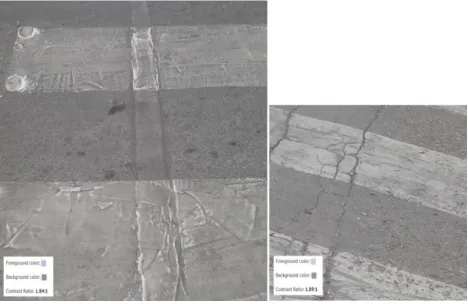
2.2 Calculating Color Contrast of
Pavement
The goal of pavement marking is to guide vehicles and inform and help road users [MRT, 2007]. In a study, the impact of profile line-marking on the performance of drivers was investigated and it was concluded that the profile line-marking was effective for keeping the lane by drivers [Hatfield, Murphy and Job, 2008]. According to research by Khabiri evaluated the importance and influence of Pavement Condition Index (PCI) and contrast of lines color on the behavior of drivers [khabiri, Elahizadeh and Diah, 2016].
Mohammad Mehdi Khabiri
405 International Journal of Transportation Engineering, Figure 3.Example of pavement marking images
and calculated contrast
Table 2.Summary of classification tree models for three dependent variables
Dependent Variable
Classification Tree(figure
number)
Number of Nodes
Number of Terminals
Nodes
Lane
changes Figure.4 13 7
Running the red
light
Figure.5 9 5
Deviation from the center lane
Figure.6 9 5
2.3 Data Analysis
A classification tree is a method of non-parametric data analysis and a strong tool for prediction and classification problems [Chang and Chien, 2013]. Classification tree method for the classification of effective factors is appropriate for the independent variables [Chang, 2014]. In this method, the obtained results of the data analysis are graphically displayed, which makes it easy to understand and
interpret the tree. Using a classification tree can identify important and less important variables and virtually eliminate insignificant variables [Shariat and Tavakoli, 2010]. The scope of this method is widespread and it is used in various fields such as medicine, management, industry, and engineering [Chang and Chien, 2013].
Card model is a powerful tool for data searching and is a non-parametric model without any assumptions about the relationship between independent and dependent variables [Beshah, Ejigu, Abraham, Snasel and Kromer, 2013]. Also, it is an important method for data searching and a powerful tool for determining the most important independent variables and solving predicted and classification issues [Chang, and Chien, 2013]. Card model is also able to identify complex relationships between the variables without any need to determine the association between the independent variables [Tavakoli, Rabieyan and Besharati, 2014].
In this study, when running the statistical software to validate, the split sample method was used. The maximum tree depth and the maximum in child node were selected as 10 and 3, respectively. The three classification trees for three dangerous behaviors (lane changes, running the red light, and deviation from the center lane) were designed and its results were interpreted. According to the software output, data are correctly grouped in the classified tree created for the number of lane changes by 66.7% and in the one created for running red lights by 79.3%. All the developed classified trees up to 3 depths (three consecutive classifications) were indicated. The characteristics of the classification tree models are shown in Table 2. In this research, IBM SPSS Statistics 22 and CRT algorithm were used to construct a classification tree [SPSS Manual, 2004].
3. Results
Three developed classified trees were obtained from volumetric data in the previous stages, is shown in the result section.
Assessing Behavioral Patterns of Motorcyclists Based on Traffic Control Device at ….
International Journal of Transportation Engineering, 406 To determine the effective factors in lane changing using the described variables in Table 3, the obtained classification tree is shown in Figure 4. The obtained tree representation was stated as follows (Figure 4): Nodes 0 are the root node which shows a summary of the lane changing variables of motorcyclists in this study. We can see that 65% of motorcyclists without any lane changing moved on their route, while 35% of them had at least one lane changing along the way. Zero nodes were divided into two subdivisions by the variable of volume of vehicles.
The most important effective variable for motorcyclists' lane changing was the volume of the vehicle on track. Node 1 shows, at the volume of less than 760 Veh/hr, there was little difference between the number of motorcyclists with at least one lane changing and the number of motorcyclists without lane changing, but mostly they had at least one lane changing. This node represented the willingness of the motorcyclists to change the lane at the volumes of below 760 Veh/hr. Node 2 shows, if the vehicle volume were more than 760 Veh/hr; most of the motorcyclists did not have lane changing with a significant difference. Comparison of nodes 3 and 4 showed that increasing pavement marking color contrast had a positive impact on reducing the number of lanes changing. Comparison of nodes 5 and 6 demonstrated that increasing the volume of traffic led to increasing the number of lanes changing. At nodes 7 to 12 and various volumes, the less the deviation from the center lane, the less the number of lane changing would be.
3.2 Effective Factors in Motorcyclists'
Running Red Lights
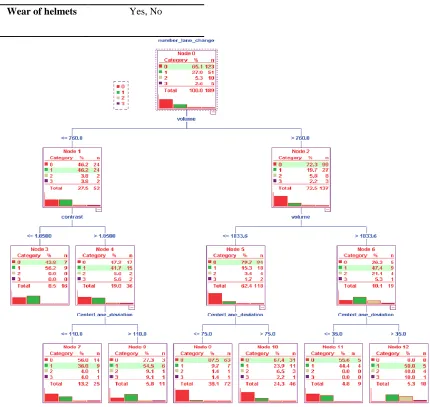
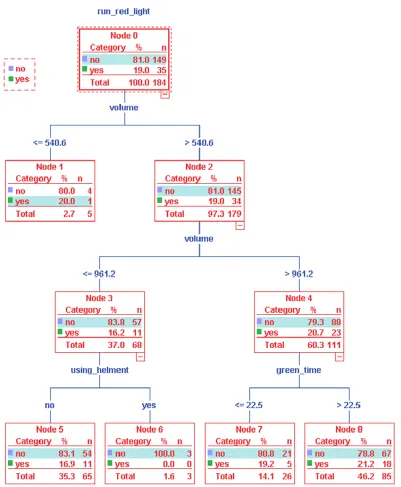
To determine the effective factors for running red lights using the described variables in Table 4, the obtained classification tree is presented in Figure 5.
In Figure 5, node 0 (zero), which is the root node and the first node, indicates that 81 percent of motorcyclists avoided running red lights at the intersection. Comparisons of the volume of traffic at nodes 3 and 4 show an increase in traffic volume over 961 Veh/hr had a significant increase in
running red lights. Nodes 7 and 8 show an increase in the green time up to 22.5 sec causes an increase in the number of running red lights. Nodes 5 and 6 compare the motorcyclists' behavior in terms of wearing/non-wearing helmets and show that none of the motorcyclists wearing helmets had the dangerous behavior of running red lights.
In other words, the motorcyclists who had legal behaviors and personality did not have the dangerous behavior of running red lights and 17% of the motorcyclists without helmets had the dangerous behavior of running red lights. The obtained tree representation was stated as follows (Figure 4): Nodes 0 are the root node which shows a summary of the lane changing variables of motorcyclists in this study We can see that 65% of motorcyclists without any lane changing moved on their route, while 35% of them had at least one lane changing along the way.
Table 3. Name of different variables in making tree decision for determining effective factors
for lane changing
Variable
Different employed manner codes/Unit of quantitative variable
Lane changes (dependent
variable)
No(no lane change), Yes(at least one lane
change)
Volume of traffic Quantitative (Vehicle per hour)
Amount of deviation from the
center lane
Quantitative (Centimeter)
Color contrast of the pavement
marking
Quantitative
Mohammad Mehdi Khabiri
407 International Journal of Transportation Engineering, Wear of helmets Yes, No
Figure 4. Developed classified tree by card method for determining effective factors for lane changing
Zero nodes were divided into two subdivisions by the variable of volume of vehicles. The most important effective variable for motorcyclists' lane changing was the volume of the vehicle on track. Node 1 shows, at the volume of less than 760 Veh/hr, there was little difference between the number of motorcyclists with at least one lane changing and the number of motorcyclists without lane changing, but mostly they had at least one lane changing.
This node represented the willingness of the motorcyclists to change the lane at the volumes of below 760 Veh/hr. Node 2 shows, if the vehicle
Assessing Behavioral Patterns of Motorcyclists Based on Traffic Control Device at ….
International Journal of Transportation Engineering, 408
3.3 Factors Affecting Deviation from the
Center Lane
For determining the Effective Factors on the quantity of motorcycle deviation from the center lane, using the variables described in.
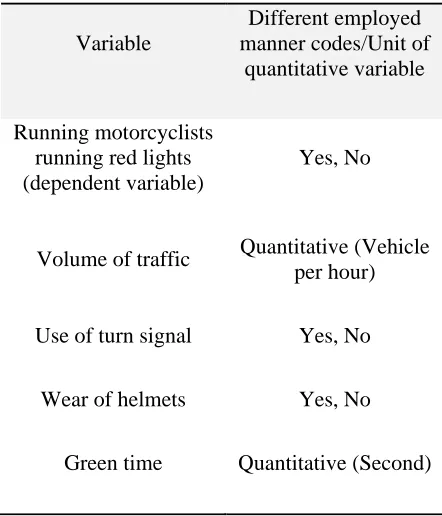
Table 4. Name of different variables used in making classification tree for determining the effective
factors in running the red light
Variable
Different employed manner codes/Unit of
quantitative variable
Running motorcyclists running red lights (dependent variable)
Yes, No
Volume of traffic Quantitative (Vehicle per hour)
Use of turn signal Yes, No
Wear of helmets Yes, No
Green time Quantitative (Second)
Table 5, the obtained classified tree is shown in Figure 6.
The obtained tree representation was stated as follows (Figure 6): Node 0 (zero), which is the same as the root, and the first node are divided into two branches by the variable of volume of vehicles. The most important variable affecting the degree of displacement from the middle of the lane is the volume of vehicles on tracks. Node 1 indicates that if the volume of the vehicle is less than 1035 Veh/hr, the rate of displacement from the middle by motorcyclists will be 79 cm on average. However, node 2 demonstrates that when the volume of vehicles exceeds 1035 Veh/hr, the rate of displacement from the middle will be 50 cm on average. Figure 6 indicates that, at node 0, the average deviation from the center lane is predicted to be 63 cm. Traffic volume divides this node into
the following two nodes.
At the traffic volume of less than 1035 Veh/hr, the amount of movement from the center lane is increased. Probably, the reason for the growth in displacement from the middle of lane could be the lower number of vehicles (overlapping reduction) and increase the possibility of more lateral movement by motorcyclists. From nodes 4 and 5, it can be seen that, when the marking color contrast is less than 1.56, the deviation from the center lane is 90 cm and, when the contrast is higher than 1.85, the deviation is 83 cm.
However, the comparison of nodes 3 to 6 shows that changes in traffic volume may change the effect of marking color contrast on the amount of deviation. The traffic volume of less than 620 Veh/hr at nodes 7 and 8 shows an increase in traffic volume which causes a reduction in forecasting the average deviation by the software.
4. Discussion
Mohammad Mehdi Khabiri
409 International Journal of Transportation Engineering, [Haquea, Chinb and Huanga, 2010]
Table 5.Name of different variables in making classification tree for determining the effective
factor for the deviation from the center lane
They conducted a study on the motorcycle crash occurring at the signalized intersections and found that the number of lanes at signalized intersections significantly increased motorcycle crashes largely because of the higher exposure resulting from higher motorcycle accumulation on the stop line. Therefore, the effect of short green time (stopping of a large number of motorcycles before the stop line) also increased the potential of the dangerous behaviors. Also, out of impatience during long red lights, motorcyclists may choose the dangerous driving behavior of running red lights [Shadabmehr, 2014; Haquea, Chinb and Huanga, 2010].
In the current study, both of the above-mentioned points were represented via determining the effect
of green time in signalized intersection on the behavior of running red lights. The study also showed that motorcycle crashes increased on high-speed roadways, because the motorcyclists were less likely to react in time during conflicts, so it is suggested that a motorcycle lane is dedicated for motorcyclists [Haquea, Chinb and Huanga, 2010]. A study by Cheng et al. was done on motorcycle accidents and confirmed these results. Motorcyclists' behavior for breaking law resulted from their venture; this study showed that these people had less risk understanding [Cheng, Liu and Tulliani, 2015].
The present study demonstrated that the quality of marking color caused lateral distance from the center lane. Wang (2004) showed that the situation and amount of reflective color of marking had an influence on the amount of lateral distance from longitudinal lines [Wang and Cao, 2004]. In this study, the effect of the lane marking quality on the dangerous behavior, especially the lane changing and deviation from the center lane, was assessed. The results by Haworth et al.’s research on the 206 accidents in 1997 also confirmed this dangerous behavior so that the poor road condition or road markings caused 12% motorcycle accidents [Haworth, 2005]. Also, the studies conducted by "National Highway Traffic Safety Administration (NHTSA)" on the effect of durable pavement marking material on crash reduction showed that the use of durable pavement marking material can substantially reduce crashes by 11% [Migletz and Graham, 2002].
In this study, two types of behaviors (wearing /non-wearing helmets and use/non-use of turning signal) were considered an outer or reaction symbol of the motorcyclist’s spirits or inner personality, so each of the three classification trees showed that the effect of this behavior on their dangerous behavior as compared with other factors was not important, while other researchers have intensively studied and considered psychological traits as significantly affecting risky driving behaviors. Hence, there is a need to investigate and compare separately the psychological traits of motorcyclists and traffic conditions for their dangerous driving behavior. Variable
Different employed manner codes/Unit of quantitative variable
Running motorcyclists running red lights (dependent variable)
Yes, No
Volume of traffic Quantitative (Vehicle
per hour)
Use of turn signal Yes, No
Wear of helmets Yes, No
Assessing Behavioral Patterns of Motorcyclists Based on Traffic Control Device at ….
International Journal of Transportation Engineering, 410
Mohammad Mehdi Khabiri
Assessing Behavioral Patterns of Motorcyclists Based on Traffic Control Device at ….
International Journal of Transportation Engineering, 412
Figure 6. Classified tree is developed by card method for determining the effective factors in the deviation from thecenter lane
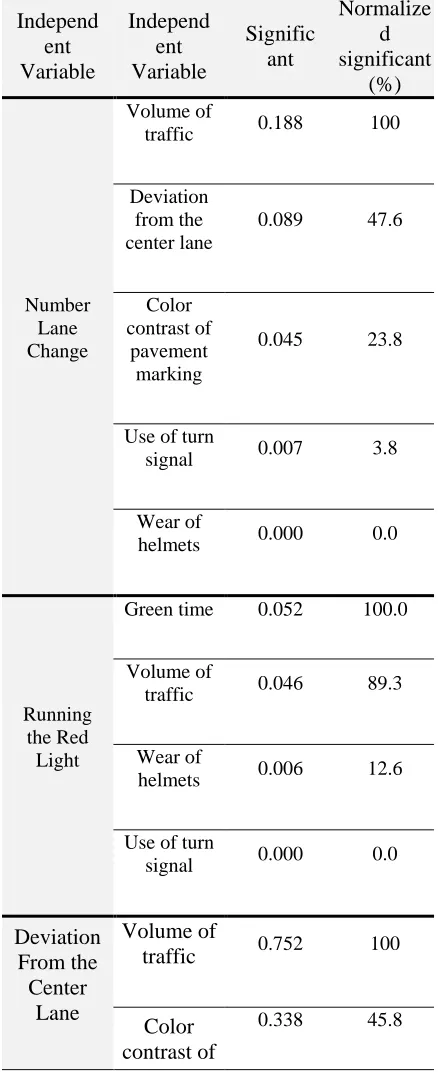
Table 6.Importance of independent variable (effective factors) for the dangerous behavior
patterns of motorcyclists Independ ent Variable Independ ent Variable Signific ant Normalize d significant (%) Number Lane Change Volume of
traffic 0.188 100
Deviation from the center lane
0.089 47.6
Color contrast of
pavement marking
0.045 23.8
Use of turn
signal 0.007 3.8
Wear of
helmets 0.000 0.0
Running the Red Light
Green time 0.052 100.0
Volume of
traffic 0.046 89.3
Wear of
helmets 0.006 12.6
Use of turn
signal 0.000 0.0
Deviation From the Center
Lane
Volume of
traffic 0.752 100
Color contrast of
0.338 45.8
pavement marking
Use of turn
signal 0.000 0.0 Wear of
helmets 0.000 0.0
In this study conducted on the behavior of high-risk motorcyclists, data were obtained from a limited geographical area; therefore, further studies are needed to be carried out in larger areas. The results of this study could not be considered definitive because of environmental factors (temperature condition, light condition, and rainy weather conditions) and the anthropologist factors, society, and popular culture may change the results. Therefore, for more precise results, more studies and larger statistical communities are required.
5. Conclusion
Mohammad Mehdi Khabiri
413 International Journal of Transportation Engineering, law enforcement at the intersections with low
volume. The achieved results of motorcyclist deviation from the center lane of modeling indicated the effect of pavement marking color on motorcyclists' deviation from the center lane. The most important results of this research were: -Due to the diversion of traffic lanes, it is necessary to use a specific motorcycle lane for moving motorcyclists, especially when traffic volume is high.
-Motorcyclists should be banned from urban highways (with high traffic volume) in order to reduce the severity and number of accidents considering their risky behaviors (unnecessary lane changes and deviation from the center lane) and the high speed of cars.
-Considering the effect of clarity of pavement color on the reduction of deviation from the middle lane by motorcyclists, urban officials need to pay more attention to the color of pavement marking.
-Considering the effect of green time at intersections on the high-risk behavior of running red lights, it is necessary to modify traffic light timing at the intersections with the high volume of motorcyclists, as an example, the timing of red light should be shortened in the approach with the high traffic volume of motorcycles. The amount of yellow interval affects the dilemma zone and probability of red light running; it was not studied in this paper and could be considered as Future work.
6. Acknowledgments
We appreciate the civil engineering students, M. Elahizadeh Z. Salimi, S. Hosseini, P. Afkhami, M. Ranjbar and M. Arastah who cooperated in preparing the films and collecting the field data and A. Motavaselolhagh for language translation.
7. References
-Abdi, A., Saffarzadeh, M. and Salehikalam, A. (2016) "Identifying and analyzing stop and go traffic based on asymmetric theory of driving behavior in acceleration and deceleration", International Journal of Transportation
Engineering (IJTE), Volume 3, No. 4, pp. 237-312.
-Beshah, T., Ejigu, D., Abraham, A., Snasel, V., and Kromer, P. (2013) "Mining pattern from road accident data: Role of road user's behavior and implications for improving safety", International Journal of Tomography And Simulation, Vol.22, No. 1, p. 73-86.
-Chang, L.Y. (2014) " Analysis of effects of manhole covers on motorcycle driver maneuvers: a non-parametric classification tree approach", Traffic Injury Prevention, Vol.15, No.2, pp.206-212.
-Chang, L.Y., and Chien, J.T. (2013) "Analysis of driver injury severity in truck involved accidents using a non-parametric classification tree model", Safety Science, Vol.51, pp.17–22.
-Cheng, A. S. K., Liu, K. P.Y. and Tulliani, N. (2015) "Relationship between driving-violation behaviors and risk perception in motorcycle accidents", Hong Kong Journal of Occupational Therapy, Vol. 25, No.3, pp. 32–38.
-Christophersen, A. S. and Gjerde, H. (2015)" Prevalence of alcohol and drugs among motorcycle riders killed in road crashes in Norway during 2001–2010", Accident Analysis and Prevention,Vol.80, pp.236–242.
-Dobson, A., Brown, W., Ball, J., Powers, J. and McFadden, M. (1999) "Women drivers’ behaviors, socio-demographic characteristics and accidents", Accident Analysis and Prevention, Vol.31, pp.525 – 535.
-Elliot, M., Baughan, C., Broughton, J., Chinn, B., Grayson, G., Knowles, J. and Simpson, H. (2003) "Motorcycle safety: a scoping study", TRL Report TRL 581. TRL, UK, pp.1-80.
Assessing Behavioral Patterns of Motorcyclists Based on Traffic Control Device at ….
International Journal of Transportation Engineering, 414 -Frey, L. and Fisher D. (1999) “Modeling
decision tree performance with the power law", Proceedings of the Seventh International Workshop on Artificial Intelligence and Statistics, San Francisco, CA: Morgan-Kaufmann, pp59-65.
-Gabauer, D. J. and Li, X. (2015) "Influence of horizontally curved roadway section characteristics on motorcycle-to-barrier crash frequency", Accident Analysis and Prevention, Vol. 77, pp.105–112.
-Godley, S. T., Triggs T. J. and Fildes B. N. (2004)" Perceptual lane width, wide perceptual road center markings and driving speeds", Ergonomics, Vol.47, No. 3 , pp. 237-256.
-Haquea, M. , Chinb, H. and Huanga, H. (2010) “Applying Bayesian hierarchical models to examine motorcycle,crashes at signalized intersections", Accident Analysis and Prevention, Volume 42, No. 1, pp. 203–212.
-Hatfield, J., Murphy, S. and Job, R.F. S. (2008)" Beliefs and behavior's relevant to the road safety effects of profile lane-marking", Accident Analysis and Prevention, Vol.40, No.6 , pp. 1872–1879.
-Hatfield, J., Murphy, S., Job R.F. S., and Du W. (2008)" The effectiveness of audio-tactile lane-marking in reducing various types of crash: a review of evidence, template for evaluation, and preliminary findings from Australia", Accident Analysis and Prevention, Vol. 41, pp. 3365– 3379.
-Haworth, N., Mulvihill, C. and Symons, (2005)" Hazard perception and responding by motorcyclists – Background and literature review", Melbourne: Report No. 235, Monish University Accident Research Centre, pp1-116.
-Hendian, M., Moameni, A. and Rahimi,H. (2015) "The factors affecting the organization of motorcycle riders", Rahvar Journal,Vol.2. N0.4,pp 63-91.
-Khairi,M. M., Elahizadeh, M. and Diah, J. (2016) "Statistical analysis of two-lane roundabout data for traffic control decision-making in an urban area", International Journal of Transportation Engineering , Vol. 4, No. 1, pp. 27-39.
-Ministry of Roads and Transportation (MRT), (2007)" Operation Manual horizontal traffic signs (Alignments)", Institute of transportation Engineers, Tehran, pp1-17.
-Migletz, J., and Graham, J. (2002)"Long-Term pavement marking practices", a synthesis of highway practice, National Cooperative Highway Research Program (NCHRP), Synthesis 306, Chapter 4, "Traffic Crashes and Pavement Marking",pp.1-154.
-Marizwan M. (2014), "Factors associated with motorcyclists ’safety at access points along primary roads in Malaysia " , doctoral dissertation , Faculty of engineering, Lund University, Sweden,pp.1-103.
-Morgan, J., Daugherty, R., Hilchie, A., and Carey, B,(2003) "Sample size and modeling accuracy of decision tree based data mining tools"Academy of Information and Management Science Journal, Vol.6,No.2 , pp.71-99.
-Norris, F. H.; Matthews, B. A.and Riad, J. K. (2000) "Character logical, Situational, and Behavioral Risk Factors for Motor Vehicle Accidents: A Prospective Examination", Accident Analysis and Prevention. 3,Vol.2, pp. 505 - 515.
-Oates, T. and Jensen, D. (1998) “Large data sets lead to overly complex models: an explanation and a solution,” Proceedings of the Fourth International Conference on Knowledge Discovery and Data Mining, Menlo Park, CA: AAAI Press, pp. 294-298.
Mohammad Mehdi Khabiri
415 International Journal of Transportation Engineering, -Shariat Mohaymany, A., and Tavakoli
Kashani, A. (2010) " Analysis of lane, two-way rural roads traffic injury severity based on data mining models", Journal of Transportation Research, Vol.7,No.2 , pp. 153-165.
-SPSS Inc.,(2004)"SPSS Classification Trees™ 13.0 Manual" , United States of America, Chicago, pp.1-137.
-Tavakoli Kashani, A., Rabieyan, R. and Besharati, M.M. (2014)" A data mining approach to investigate the factors influencing the crash severity of motorcycle pillion passengers" , Journal of Safety Research, Vol.51, pp. 93–98.
-Wang, J., Cao,Y. and Yong, Cao (2004)" Effects of road marking luminance contrast on driving safety", FHWA-RIDOT-RTD-04-1 ,pp.1-128.
-Wong, J. T., Chung, Y. S., and Hung, S. H. (2010) “Determinants behind young motorcyclists' risky riding behavior", Accident Analysis and Prevention, Vol. 42, No.1, pp.275-281.