J. ADV COMP ENG TECHNOL, 5(2) Spring 2019
This work is licensed under the Creative Commons Attribution 4.0 International Licence.
To view a copy o this licence, visit https://creativecommons.org/licenses/by/4.0/
A Hybrid Data Clustering Algorithm Using
Modified Krill Herd Algorithm and K-Means
R.Jensi1
1- Dr.Sivanthi Aditanar College of Engineering, Tiruchendur, TamilNadu, India. ([email protected])
Received (2018-12-27) Accepted (2019-03-23)
Abstract: Data clustering is the process of partitioning a set of data objects into meaning clusters or groups. Due to the vast usage of clustering algorithms in many fields, a lot of research is still going on to find the best and efficient clustering algorithm to partition the data items. K-means is simple and easy to implement, but it suffers from initialization of cluster center and hence trapped in local optimum. In this paper, a new hybrid data clustering approach which combines the modified krill herd and K-means algorithms, named as K-MKH, is proposed. K-MKH algorithm utilizes the power of quick convergence behaviour of K-means and efficient global exploration of Krill Herd and random phenomenon of Levy flight method. The Krill-herd algorithm is modified by incorporating Levy flight into it to improve the global exploration. The proposed algorithm is tested on artificial and real life datasets. The simulation results are compared with other methods such as K-means, Particle Swarm Optimization (PSO), Original Krill Herd (KH), hybrid K-means and KH. Also the proposed algorithm is compared with other evolutionary algorithms such as hybrid modified cohort intelligence and K-means (K-MCI), Simulated Annealing (SA), Ant Colony Optimization (ACO), Genetic Algorithm (GA), Tabu Search (TS), Honey Bee Mating Optimization (HBMO) and K-means++. The comparison shows that the proposed algorithm improves the clustering results and has high convergence speed.
Keywords: Data clustering, Krill Herd, Levy-flight distribution, K-means, Convergence rate.
I. INTRODUCTION
D
ata clustering [5] is the method in which a group of data objects are divided into groups or clusters in such a way that the objects within the clusters are having high similarity while the data objects in different clusters are dissimilar. Data clustering is an unsupervised technique due to the unknown class labels. The similarity between data objects is measured by some distance metric. There are several distance measurements [2] such as Euclideandistance, Minkowski metric, Manhatten distance, Cosine similarity, Jaccard coefficient, Pearson correlation coefficient, and so on.
Clustering is widely used in many fields of science and engineering and it must often be solved as part of complicated tasks in pattern recognition, data mining, information retrieval and image analysis. The clustering algorithms are mainly classified into two [2]: hierarchical and partitional. Hierarchical clustering algorithms group data objects into tree-like structure and it is further classified into two types, agglomerative and divisive, based on how the hierarchical decomposition How to cite this article:
94 J. ADV COMP ENG TECHNOL, 5(2) Spring 2019 is formed. On the other hand, partitional
clustering algorithm groups the data objects into a predefined number of clusters based on some optimization criterions. The most well known partitional clustering algorithm is K-means which is the center-based clustering algorithm. The advantage of K-means algorithm is simple and efficient. But K-means suffers from initial cluster seed selection since it is easily trapped in local minima. In order to overcome the shortcomings of K-means, several heuristic algorithms have been introduced in the literature.
Many nature-inspired algorithms, also known as Swarm Intelligence (SI) [3] have been introduced inspired by the clever behaviours of animal or insect groups, such as ant colonies, bird flocks or fish schools, bacterial swarms, bee colonies, cuckoos, fireflies and flower pollination. Swarm Intelligence is based on heuristic approach, so SI algorithms were used to solve the clustering problems.
Gandomi and Alavi(2012) [26] introduced Krill Herd (KH) optimization algorithm simulating the herding behaviour of krill individuals to solve the optimization problems. The implementation of KH is available from [37]. A novel variants of Krill Herd algorithm was presented in [27]-[30], [40-41]. Each algorithm was tested with several standard unimodal and multimodal functions. The main contribution of this study is to apply krill-herd algorithm with levy flight for data clustering. In order to speed up the convergence of the proposed algorithm, k-means algorithm is employed for generating initial cluster centers.
The remaining section of the paper is organized as follows. Section 2 lists out the various research works related to data clustering and Section 3 provides the clustering problem statement. Section 4 briefly explains the K-means algorithm, Original Krill Herd algorithm, Levy Flight method and Section 5 presents the proposed K-MKH approach. Section 6 provides the experimental results, and Section 7 concludes the paper.
II. RELATED WORKS
In this section the various research works related to data clustering proposed by the authors are given. Selim et.al [4] introduced a simulated annealing algorithm for solving the clustering problems. Maulik and Bandyopadhyay [5] proposed a clustering algorithm using genetic algorithm for improving global search capacity. Sung et.al. [6] presented a tabu search based clustering method to alleviate the local optima problem. An ant colony based clustering approach was proposed by Shelokar.et.al [7]. Liu et.al. [8] proposed a new tabu search based clustering approach to enhance the clustering solutions. In Kao et.al [9], a hybrid clustering technique K-NM-PSO based on K-means, Nedler-Mead simplex and PSO was presented by the authors. Fathian and Amiri [10] applied honey-bee mating technique for obtaining better cluster solutions. Dervis Karaboga [11] and Yan et.al [12] proposed novel clustering algorithms using Artificial Bee Colony (ABC). Miao Wan et.al [13] proposed data clustering using bacterial foraging optimization. Senthilnath et.al [14] performed a clustering study using firefly algorithm.
R.Jensi./ A Hybrid Data Clustering Algorithm Using Modified Krill Herd Algorithm and K-Means.
J. ADV COMP ENG TECHNOL, 5(2) Spring 2019 95
energy saving opportunities in the single mixed refrigerant liquefaction process. In [45], k-means algorithm is initialized by choosing random starting centers with specific probabilities.
III. THE PROBLEM STATEMENT
Clustering is the process of partitioning the set of N data objects into K clusters or groups based on some distance (or similarity) metric. Let D ={d1, d2,…,dN} be a set of N data objects to be partitioned and each data object di ,i=1,2,… ,N is represented as di={di1,di2,….,dim} where dim represents mth dimension value of data object i.
The aim of clustering algorithm is to find a set of K partitions
C = {C1, C2, …., Ck | k:Ck and lk : CkCl }
in such a way that objects within the clusters are more similar and dissimilar to objects in different clusters. These similarities are measured by some optimization criterions, especially squared error function [30] and it has been calculated as follows:
k
j N
i i j
c d E f
1 1
,
min (1)
where cj represents a jth cluster center ; E is a distance measure between a data object di and a cluster center cj. This optimization criterion is used as the objective function value in this study. There are many distance metric used in literature. In this study Euclidean distance is used as distance metric which is defined as follows:
M
m im jm
j
i c d c
d E
1
2
, (2)
where, cj is cluster center for a cluster j and is calculated as follows:
j i c
d i
j
j
n
d
c
1
(3)where nj is the total number of objects in cluster j.
The main issue in data clustering is local optima problem and slow convergence speed. In order to achieve global optimal solution and speed up the convergence, a hybrid data clustering approach using modified krill herd and k-means is proposed.
IV. K-MEANS AND KRILL HERD ALGORITHM
4.1 K-Means algorithm
K-means [1] is the simplest partitional clustering algorithm and it is widely used due its simplicity and efficiency. Given a set of N data objects and the number of clusters k, the k-means algorithm proceeds as follows:
Step1: Randomly select ‘k’ cluster centers.
Step2: Calculate the Euclidean distance between each data point and cluster centers.
Step3: Assign the data point to the cluster center whose distance from the cluster center is minimum of all the cluster centers.
Step4: Update cluster center using Equation (3).
Step5: If no data point was reassigned then stop, otherwise repeat from step 2.
4.2 Krill Herd Algorithm
Krill Herd (KH) [26] is a new heuristic population based global optimization algorithm. The inspiration of KH algorithm is the herding behaviour of krill swarm when looking for food and communication with each other. The implementation of KH method is based on three movements such as
(i) Movement influenced by other krill individual
J. ADV COMP ENG TECHNOL, 5(2) Spring 2019 96 KH approach follows Lagrangian model for
effective search and it is described as:
i i i
i N F D
dt
dX
(4)
where Ni is the movement induced by other krill individuals, Fi is the foraging action and Di
is the random physical diffusion of the ith krill individuals.
The direction of motion induced, ai , depends
on the three components, namely local swarm density, a target swarm density and a repulsive swarm density. The movement of a krill individual
Ni is defined as:
old i n i new
i
N
N
N
max
(5)
where
et
t i local i
i
arg
(6)and Nmax is the maximum induced speed, w n
is the inertia weight, Niold is the motion induced previously, ailocal is the local effect offered by
neighbours and aitarget is the best krill individual’s
target effect.
The second movement of KH approach foraging action Fi depends on two parameters, namely current food location and information about previous food location. The ith krill individual’s motion is described as:
old i f i f
i V F
F
(7) wherebest i food i
i
(8)and Vf is the foraging speed, wf is the inertia weight of the foraging action, Fiold is the previous
foraging motion, bifood is the food attractive and
is the best fitness found by the ith krill so far. The value for wn, wf is equal to 0.997 at the first
iteration and decreases gradually to 0.1 at the end of the iteration.
The third movement of KH approach is random
physical diffusion. The physical diffusion of the ith krill individual depends on two components, namely maximum diffusion speed and a random directional vector and it is defined as:
max
max 1
I I D
Di (9)
where Dmax is the maximum diffusion speed,
d is the random vector in the range [-1, 1], I is the current generation and Imaxis the maximum generation.
Based on the three movements defined above, the position of ith krill individual during the time interval is
dt dX t t X t t
X i
i
i ( ) (10)
It is clearly seen that t is an important
parameter and its value determines the convergence speed. For more details, refer [26].
4.3 Levy flight
Levy flight follows [31-34]; the generation of random numbers with levy flight consists of two steps: the choice of a random direction and the generation of steps which obey the chosen levy distribution. Random walks are drawn from Levy stable distribution. This distribution is a simple power-law formula
L
(
s
)
~
s
1where 0 < β < 2 is an index.
Definition 4.1 Mathematically, a simple version of Levy distribution can be defined as:
0 ,
0
0 , ) ( 2 exp
2 ,
,
2 3
s if
s if
s s s
L
R.Jensi./ A Hybrid Data Clustering Algorithm Using Modified Krill Herd Algorithm and K-Means.
97 J. ADV COMP ENG TECHNOL, 5(2) Spring 2019
where m parameter is location or shift parameter, g > 0 parameter is scale (controls the scale of distribution) parameter.
Definition 4.2 In general, Levy distribution should be defined in terms of Fourier transform.
,
0
2
exp
)
(
k
k
F
where a is a parameter within [−1, 1] interval and known as skewness or scale factor. An index of o stability
(
0
,
2
)
is also referred to as Levyindex. The analytic form of the integral is not known for general b except for a few special cases.
For random walk, the step length S can be calculated by Mantegna’s algorithm as
1
v
u
S
(11)where u and v are drawn from normal distributions. That is
0
,
,
~
0
,
,
~
2 2v
u
v
N
N
u
(12)where
1
2 / 1 2
2
1
2
sin
)
1
u
(13)
Then the step size is calculated by
S
stepsize
0
.
01
(14)The new position of the krill individual is calculated as:
X best
rand(01,)stepsize X
X j j
i i
new
(15)
where
⊕
stands for entry-wise multiplication,best j is the best position of the jth variable krill individual in the swarm.
V. THE PROPOSED HYBRID K-MKH CLUSTERING APPROACH
In [26], Gandomi and Alavi presented four different KH algorithms and they tested each algorithm and concluded that KH with crossover operator has the best performance in compare to those of other algorithms. Hence, in this study KH means it refers to KH with crossover operator. The shortcoming of KH algorithm is KH cannot escape from local optima due to the failure in global search capability. The search in KH is based on random physical activity and hence it cannot always produce the global optimal solution. In order to alleviate the shortcomings of KH, in this paper global search capability is included via levy-flight method.
5.1 Global search random walk using Levy Flight method
In order to explore search space globally, fine tuning of current position of ith krill individual is made with a chance of 0.5. For random walk, a coin is flipped and if it is less than 0.5 then Levy walk is performed for making diversity of solutions as in Section 3.3, otherwise new position of the krill is created belonging to the search space.
The above mentioned modification of krill herd algorithm is combined with K-means to solve the clustering problem. The proposed novel hybrid data clustering approach is then referred to as Modified Krill Herd with K-means (K-MKH). In this hybrid algorithm, K-means is employed as the first step before entering into the generations for finding optimal solution. Instead of getting trapped in local minimum, this idea makes the proposed algorithm to converge quickly as well as attain best clustering quality. For solving the data clustering problem, K-MKH algorithms is neatly explained in detail in the following steps.
98 J. ADV COMP ENG TECHNOL, 5(2) Spring 2019 minimum and maximum bounds.
Step 2: Randomly generate krill individuals (solutions). The population of solutions is represented as given below:
11
c c12 c13 … c1m … ck1 ck2 ck3 … ckm
C1 … Ck
Fig. 1. Representation of a candidate solution for k clusters and m features
XN X X X
P
3 2 1
(16)
ܺ݅ ൌ ሾܥͳǡ ܥʹ ǥ Ǥ ǡ ܥ݇ሿ
(17)�𝑐𝑐 � �𝑐𝑐𝑐𝑐𝑐𝑐 𝑐𝑐𝑐𝑐𝑐𝑐 𝑐 𝑐𝑐𝑐𝑐𝑐𝑐�𝑐 �𝑐𝑐 � �𝑐𝑐𝑐𝑐 𝑐 𝑐 ��
(18)where k is the number of clusters, m is the dimension of the data object, N is the number krill individuals.
Thus the candidate solution is represented as a row vector of size k×m and it is shown in Fig. 1.
Step 3: Run K-means with random cluster center generated in Step 2 as seed. Perform this step for each krill individual.
Step 4: Evaluate the objective function value
f using (1) and find the worst and best fitness values.
Step 5: Store the pre-specified number of best krill.
Step 6: Calculate three movements.
5.1 Movement influenced by other krill individual
5.2 Foraging action 5.3 Physical diffusion
Step 7: Implement crossover operator. Step 8: Update krill position using (10). Step 9: Generate a random integer between 0 and 1 and if it is less than 0.5, explore new krill individual position using Levy walk as in Section
3.3 using (15), otherwise krill individual new position is found using the below equation.
)
1,
0
(
2
01
.
0
UB
LB
rand
X
X
new i
(19)
where UB and LB are maximum and
minimum value of each feature of the data object respectively.
Step 10: Evaluate the objective function value f using (1) and update the krill individual if necessary.
Step 11: Repeat Step 6-10 for each krill individual.
Step 12: Replace the worst krill with the best krill stored before.
Step 13: Increment the iteration count and go to Step 5 if the maximum number of iterations is not reached.
The flowchart of the proposed algorithm for data clustering problem is shown in Fig. 2.
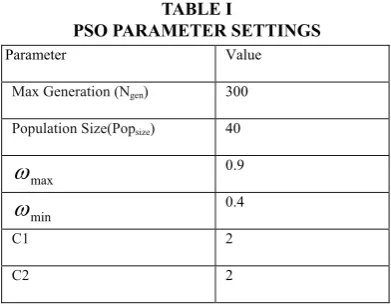
TABLE I
PSO PARAMETER SETTINGS
Parameter Value
Max Generation (Ngen) 300
Population Size(Popsize) 40
max
0.9
min
0.4
C1 2
C2 2
R.Jensi./ A Hybrid Data Clustering Algorithm Using Modified Krill Herd Algorithm and K-Means.
99 J. ADV COMP ENG TECHNOL, 5(2) Spring 2019
Initialize the parameters
Randomly initialize the swarm
Run Kmeans with random cluster center as seed
Calculate objective function values
Find new position in stepwise using (19)
rand<0.5
No Yes
Find new position using Levy Flight
method
Calculate objective function value
Iteration< maxiter
Update krill position
Yes No
Output Best Solution For each krill
Replace the worst krill with the best krill and find the current best krill in the swarm
Sort the krill and store the best krill
Update krill position Apply crossover operator Calculate induced motion, foraging motion, physical diffusion by using (5),
Fig.2. Flowchart of the proposed algorithm
VI. EXPERIMENTAL RESULTS
The Kmeans, PSO, Krill Herd (KH) [26], Hybrid Kmeans and Krill Herd (K-KH) and proposed algorithm (K-MKH) are written in Matlab 8.3 and executed in a Windows 7 Professional OS environment using Intel i3, 2.30 GHz, 2 GB RAM. K-means, PSO, KH, K-KH and
K-MKH are executed 20 times independently. KH, K-KH and K-MKH algorithms are run with the parameters as [26]: Vf = 0.02 , Dmax=0.005,
Nmax=0.01, Max Generation=300, No. of Krills=25.
The parameter setting for PSO algorithm is shown in Table I.
To evaluate the performance of proposed algorithm, ten datasets have been used. Two artificial datasets, Art1 and Art2 are drawn from Kao. et.al (2008) [9]. The eight real datasets, namely, Iris, Wine, Glass, Wisconsin Breast Cancer (WBC), Contraceptive Method Choice (CMC), Crude Oil, Vowel and Liver Disorders (LD) are collected from Machine Learning Laboratory [35]. The datasets used in this study is summarized in Table I.1.
TABLE.I.1
TEST DATASET DESCRIPTIONS
Dataset
Name # features of # classes of # of instances(size of each class)
Art1 2 4 600 (150,150,150,150)
Art2 3 5 250(50,50,50,50,50)
Iris 4 3 150(50,50,50)
Wine 13 3 178(59,71,48)
Glass 9 6 214(70,17,76,13,9,29)
Wiscons in Breast Cancer (WBC)
9 2 683(444,239)
CMC 10 3 1473(629,333,511)
Crude
Oil 5 3 56(7,11,38)
Vowel 3 6 871 (72, 89, 172, 151,
207, 180)
Liver Disorders
(LD)
6 2 345(145,200)
In order to evaluate the performance and accuracy of the clustering result, three criteria are used. They are:
(i) Intra-cluster distances as defined in (1). The low value of the sum is, the higher the quality of the clustering is.
(ii) Number of fitness function evaluations (NFE). The smaller the NFE value is, the higher the convergence speed of the algorithm.
(iii) F-measure: This combines the precision and recall values used in information retrieval. The precision P(i,j) and recall R(i,j) for each class
i of each cluster j are calculated as
100 J. ADV COMP ENG TECHNOL, 5(2) Spring 2019
j ij
j i
P , (20)
i ij
j i R
, (21)
where,
γi : is the number of members of class i γj : is the number of members of cluster j γij: is the number of members of class i in cluster j
The corresponding F-measure F(i,j) is given in (22):
j i R j i P
j i R j i P j
i F
, ,
, ,
2
, (22)
Then the definition of F-measure of a class i
is given as
F i j
n F
j i
i
tot
max ,
(23)
where, n is the total number of data objects in the collection. In general, the larger the F-measure gives the better clustering result.
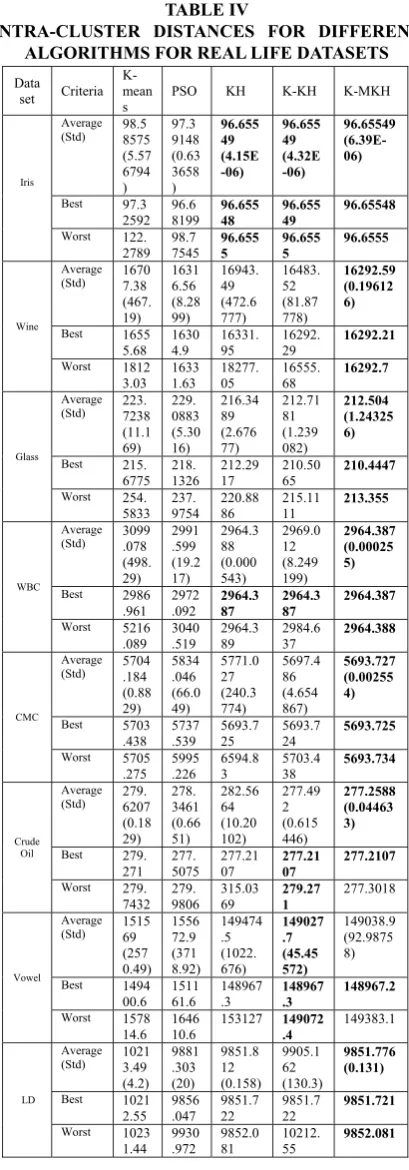
Table II and Table IV lists the best, worst, average and standard deviation of solutions for the five algorithms K-means, PSO, Original Krill Herd (KH), K-means Krill Herd (K-KH) and proposed algorithm (K-MKH) from 20 independent runs for artificial and real life datasets respectively and Table III and Table V lists the average and standard deviation of F-measures and mean time (in seconds) from 20 independent runs for artificial and real life datasets respectively.
From the values given in Table II, for the artificial datasets Art1 KH obtains better solution than the other algorithms whereas for the Art2 dataset K-KH and K-MKH algorithms achieve better results. As seen from Table IV, for the
iris dataset KH, K-KH and K-MKH algorithms obtain the same result. K-KH performs well for the vowel dataset. For the datasets Wine, Glass, WBC, CMC, Crude Oil and Liver Disorders, the proposed algorithm obtains better optimal results compared to other algorithms. Thus the proposed approach reaches the optimal values in almost all the 20 independent runs.
The convergence behaviour of K-means, PSO, KH, K-KH and K-MKH algorithms for the artificial and real datasets are shown in Fig. 3-12. On seeing the graph, K-means algorithm converges quickly and at the same time it gets stuck in local optima. The proposed algorithm converges quickly compared to PSO, KH, and K-KH and also achieves better optimal solutions than those algorithms.
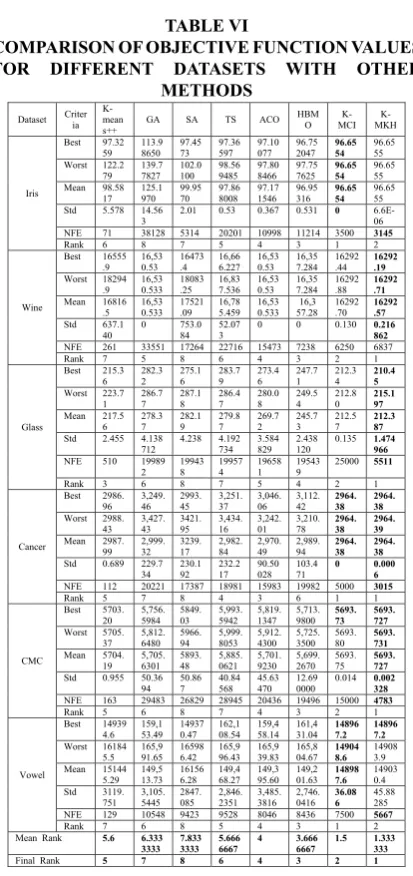
Also the performance of the proposed algorithm is compared with several heuristic methods in the literature such as K-means++ [36], SA [4], GA [5], ACO [7], TS [8], HBMO [10], K-MCI [25] whose results are directly taken from [25] and its values is given in Table VI. Table VI lists the best, worst, average and standard deviation of solutions from 20 independent runs and also includes the number of fitness function evaluations (NFE) required to attain the best solution.
The experimental results given in Table VI show that proposed algorithm obtains near optimal solutions and converge quickly in compare to those of other methods. The proposed algorithm achieves much better results for almost all datasets with small standard deviation. The number of function evaluations required for obtaining best solution over 20 independent runs is much smaller than all other methods. For iris dataset, K-MCI converges to 96.6554 for each run, but K-MKH obtains 96.6555 for each run. While comparing the number of function evaluations required to achieve the optimal result is 3145 for proposed algorithm whereas 3200 for K-MCI which indicates that proposed algorithm obtains near optimal value in small amount of time.
R.Jensi./ A Hybrid Data Clustering Algorithm Using Modified Krill Herd Algorithm and K-Means.
101 J. ADV COMP ENG TECHNOL, 5(2) Spring 2019
for the algorithms K-means ++, GA, SA, TS, ACO, HBMO,K-MCI and K-MKH are 217.56, 278.37, 282.19, 279.87, 269.72, 245.73,212.47 and 212.387 respectively. And also the NFE for glass dataset is very high for all methods when compared to K-MKH algorithm.
The best solutions for Cancer dataset obtained by K-MKH algorithm is 2964.38 in 3015 function evaluations, while K-MCI achieves 2964.38 in 5000 function evaluations. For CMC dataset, K-MKH achieves best, worst and mean solutions of 5693.727, 5693.731 and 5693.729 with a standard deviation of 0.002328, while K-means ++, GA, SA, TS, ACO, and HBMO cannot reach the global solution in all runs whereas K-MCI obtains the best solution with a standard deviation of 0.014. As proposed K-MKH algorithm reached the solution in almost all runs with a small standard deviation values indicates that K-MKH has high convergence speed as well as reaches optimal solution. For vowel dataset, K-MCI performs well than all other algorithms including K-MKH. Nevertheless, K-MKH achieves best solutions of 148967.24 in 5667 function evaluations. As a conclusion, the proposed scheme reaches near global optimal solution with a small standard deviation and smaller number of fitness function evaluations. As well as when compared to the other algorithms, K-MKH obtains first rank.
TABLE II
INTRA-CLUSTER DISTANCES FOR DIFFERENT ALGORITHMS FOR ARTIFICIAL DATASETS Data
set Criteria
K-mean
s PSO KH
K-KH K-MKH
Art1 Average
(Std) 531.
5287 (0)
531. 0678 (0.44 678)
530.87 39 (2.73E -05)
531. 5287 (0)
531.52 87 (0)
Best 531.
5287 530.8742 530.8739 531.5287 531.5287
Worst 531.
5287 532.7425 530.874 531.5287 531.5287
Art2 Average (Std) 2173.115
(375. 0322 )
1761 .966 (25.0 6701 )
1828.6 04 (249.3 881)
1727 .153 (0.00 0166 )
1727.1 53 (0.000 61)
Best 1728
.798 1736.722 1727.153 1727.153 1727.153
Worst 2516
.083 1813.282 2504.093 1727.154 1727.154
TABLE III
F-MEASURE AND COMPUTATIONAL TIME VALUES FOR DIFFERENT ALGORITHMS FOR
ARTIFICIAL DATASETS
Data
set Criteria K-mean
s PSO KH
K-KH K-MKH
Art1 Mean F-Measur e
0.99
6667 0.996667 0.996667 0.99667 0.996667
Std F-Measur e
3.42
E-16 3.42E-16 3.42E-16 5.7E-17 3.42E-16
Time 0.00
5221 3.619262 4.009741 19.45976 19.17784
Art2 Mean F-Measur e
0.87
6562 1 0.969524 1 1
Std F-Measur e
0.10
4329 0 0.074721 0 0
Time 0.00
102 J. ADV COMP ENG TECHNOL, 5(2) Spring 2019
TABLE IV
INTRA-CLUSTER DISTANCES FOR DIFFERENT ALGORITHMS FOR REAL LIFE DATASETS
Data set Criteria
K-mean
s PSO KH K-KH K-MKH
Iris
Average (Std) 98.58575
(5.57 6794 ) 97.3 9148 (0.63 3658 ) 96.655 49 (4.15E -06) 96.655 49 (4.32E -06) 96.65549 (6.39E-06)
Best 97.3
2592 96.68199 96.65548 96.65549 96.65548 Worst 122.
2789 98.77545 96.6555 96.6555 96.6555
Wine
Average (Std) 16707.38
(467. 19) 1631 6.56 (8.28 99) 16943. 49 (472.6 777) 16483. 52 (81.87 778) 16292.59 (0.19612 6)
Best 1655
5.68 16304.9 16331.95 16292.29 16292.21
Worst 1812
3.03 16331.63 18277.05 16555.68 16292.7
Glass
Average (Std) 223.7238
(11.1 69) 229. 0883 (5.30 16) 216.34 89 (2.676 77) 212.71 81 (1.239 082) 212.504 (1.24325 6)
Best 215.
6775 218.1326 212.2917 210.5065 210.4447
Worst 254.
5833 237.9754 220.8886 215.1111 213.355
WBC
Average (Std) 3099.078
(498. 29) 2991 .599 (19.2 17) 2964.3 88 (0.000 543) 2969.0 12 (8.249 199) 2964.387 (0.00025 5)
Best 2986
.961 2972.092 2964.387 2964.387 2964.387 Worst 5216
.089 3040.519 2964.389 2984.637 2964.388
CMC
Average (Std) 5704.184
(0.88 29) 5834 .046 (66.0 49) 5771.0 27 (240.3 774) 5697.4 86 (4.654 867) 5693.727 (0.00255 4)
Best 5703
.438 5737.539 5693.725 5693.724 5693.725
Worst 5705
.275 5995.226 6594.83 5703.438 5693.734
Crude Oil
Average (Std) 279.6207
(0.18 29) 278. 3461 (0.66 51) 282.56 64 (10.20 102) 277.49 2 (0.615 446) 277.2588 (0.04463 3) Best 279.
271 277.5075 277.2107 277.2107 277.2107 Worst 279.
7432 279.9806 315.0369 279.271 277.3018
Vowel
Average (Std) 151569
(257 0.49) 1556 72.9 (371 8.92) 149474 .5 (1022. 676) 149027 .7 (45.45 572) 149038.9 (92.9875 8)
Best 1494
00.6 151161.6 148967.3 148967.3 148967.2 Worst 1578
14.6 164610.6 153127 149072.4 149383.1
LD
Average (Std) 10213.49
(4.2) 9881 .303 (20) 9851.8 12 (0.158) 9905.1 62 (130.3) 9851.776 (0.131)
Best 1021
2.55 9856.047 9851.722 9851.722 9851.721
Worst 1023
1.44 9930.972 9852.081 10212.55 9852.081
TABLE V
F-MEASURE AND COMPUTATIONAL TIME VALUES FOR DIFFERENT ALGORITHMS FOR
REAL LIFE DATASETS
Data set Criteria
K-mean
s PSO KH K-KH K-MKH
Iris Mean
F-Measure 0.876254 0.900314 0.898775 0.898775 0.898775 Std
F-Measure 0.051157 0.010492 1.14E-16 1.14E-16 1.14E-16 Time 0.01
8827 3.102192 4.158826 4.292506 4.352969
Wine Mean
F-Measure 0.709064 0.722999 0.717422 0.71326 0.725405 Std
F-Measure 0.017896 0.00459 0.010765 0.010398 0.001972 Time 0.00
4443 3.179471 4.145985 4.50042 4.77045
Glass Mean
F-Measure 0.537838 0.523456 0.52628 0.558264 0.55857 Std
F-Measure 0.021938 0.02433 0.025186 0.004022 0.004598 Time 0.00
7306 3.453983 4.777963 4.652005 5.4064
WBC Mean
F-Measure 0.9477 0.963706 0.964755 0.964385 0.964755 Std
F-Measure 0.059807 0.002181 2.28E-16 0.001064 2.28E-16 Time 0.00
2859 3.443544 5.035167 4.489766 5.093428
CMC Mean
F-Measure 0.402879 0.402819 0.403912 0.412995 0.412968 Std
F-Measure 0.002171 0.002938 0.008196 0.016432 4.21E-05 Time 0.00
9258 5.186614 6.072309 5.727927 6.108674
Crude Oil
Mean
F-Measure 0.671124 0.69824 0.680466 0.709203 0.710883 Std
F-Measure 0.022764 0.020161 0.033381 0.015954 0.01116 Time 0.00
4041 2.990571 3.778886 4.119627 3.979876
Vowel
Mean
F-Measure 0.5233 0.533555 0.531858 0.533769 0.531142 Std
F-Measure 0.036181 0.026008 0.019983 0.00623 0.005701 Time 0.01
5468 4.587014 5.036707 5.111952 5.210973
LD Mean
F-Measure 0.626148 0.62266 0.622763 0.627467 0.628642 Std
F-Measure 0.000213 0.002002 0.000929 0.012294 0.005325 Time 0.00
3944 3.273448 5.21026 5.194463 4.901854
0 50 100 150 200 250 300 500 600 700 800 900 1000 1100 Iteration Fi tnes s va lue Art1 Kmeans PSO KH K-KH K-MKH
R.Jensi./ A Hybrid Data Clustering Algorithm Using Modified Krill Herd Algorithm and K-Means.
103 J. ADV COMP ENG TECHNOL, 5(2) Spring 2019
0 50 100 150 200 250 300 1500
2000 2500 3000 3500
Iteration
Fi
tnes
s
val
ue
Art2
Kmeans PSO KH K-KH K-MKH
Fig.4. Convergence behavior of Art2 dataset
0 50 100 150 200 250 300
80 100 120 140 160 180
Iteration
Fi
tnes
s
val
ue
Iris
Kmeans PSO KH K-KH K-MKH
Fig.5. Convergence behavior of Iris dataset
0 50 100 150 200 250 300
1.6 1.8 2 2.2 2.4x 10
4
Iteration
Fi
tnes
s
val
ue
Wine
Kmeans PSO KH K-KH K-MKH
Fig.6. Convergence behavior of Wine dataset
0 50 100 150 200 250 300
200 220 240 260 280 300
Iteration
Fi
tnes
s
va
lue
Glass
Kmeans PSO KH K-KH K-MKH
Fig.7. Convergence behavior of Glass dataset
0 50 100 150 200 250 300 2800
3000 3200 3400 3600 3800 4000 4200
Iteration
Fi
tnes
s
va
lue
Wisconsin Breast Cancer(WBC)
Kmeans PSO KH K-KH K-MKH
Fig.8. Convergence behavior of WBC dataset
0 50 100 150 200 250 300
5500 6000 6500 7000 7500 8000
Iteration
Fi
tnes
s
va
lu
e
CMC
Kmeans PSO KH K-KH K-MKH
104 J. ADV COMP ENG TECHNOL, 5(2) Spring 2019
0 50 100 150 200 250 300
270 280 290 300 310 320 330
Iteration
Fi
tne
ss
v
al
ue
Crude Oil
Kmeans PSO KH K-KH K-MKH
Fig.10. Convergence behavior of Crude Oil dataset
0 50 100 150 200 250 300
0.95 1 1.05 1.1 1.15 1.2 1.25
1.3x 10
4
Iteration
Fi
tn
es
s
va
lu
e
Liver Disorders(LD)
Kmeans PSO KH K-KH K-MKH
Fig.11. Convergence behavior of Liver Disorder dataset
0 50 100 150 200 250 300
1.4 1.6 1.8 2 2.2x 10
5
Iteration
Fi
tn
es
s
val
ue
Vowel
Kmeans PSO KH K-KH K-MKH
Fig.12. Convergence behavior of Vowel dataset
VII. CONCLUSION
R.Jensi./ A Hybrid Data Clustering Algorithm Using Modified Krill Herd Algorithm and K-Means.
105 J. ADV COMP ENG TECHNOL, 5(2) Spring 2019
TABLE VI
COMPARISON OF OBJECTIVE FUNCTION VALUES FOR DIFFERENT DATASETS WITH OTHER
METHODS Dataset Criteria K-mean
s++ GA SA TS ACO
HBM
O MCI K- MKH
K-Iris
Best 97.32
59 113.98650 97.4573 97.36597 97.10077 96.752047 96.6554 96.6555 Worst 122.2
79 139.77827 102.0100 98.569485 97.808466 97.757625 96.6554 96.6555 Mean 98.58
17 125.1970 99.9570 97.868008 97.171546 96.95316 96.6554 96.6555 Std 5.578 14.56
3 2.01 0.53 0.367 0.531 0 6.6E-06 NFE 71 38128 5314 20201 10998 11214 3500 3145
Rank 6 8 7 5 4 3 1 2
Wine
Best 16555
.9 16,530.53 16473.4 16,666.227 16,530.53 16,357.284 16292.44 16292.19
Worst 18294
.9 16,530.533 18083.25 16,837.536 16,530.53 16,357.284 16292.88 16292.71
Mean 16816
.5 16,530.533 17521.09 16,785.459 16,530.533 57.28 16,3 16292.70 16292.57
Std 637.1
40 0 753.084 52.073 0 0 0.130 0.216862
NFE 261 33551 17264 22716 15473 7238 6250 6837
Rank 7 5 8 6 4 3 2 1
Glass
Best 215.3
6 282.32 275.16 283.79 273.46 247.71 212.34 210.45
Worst 223.7
1 286.77 287.18 286.47 280.08 249.54 212.80 215.197
Mean 217.5
6 278.37 282.19 279.87 269.72 245.73 212.57 212.387
Std 2.455 4.138
712 4.238 4.192734 3.584829 2.438120 0.135 1.474966
NFE 510 19989
2 199438 199574 196581 195439 25000 5511
Rank 3 6 8 7 5 4 2 1
Cancer
Best 2986.
96 3,249.46 2993.45 3,251.37 3,046.06 3,112.42 2964.38 2964.38
Worst 2988.
43 3,427.43 3421.95 3,434.16 3,242.01 3,210.78 2964.38 2964.39
Mean 2987.
99 2,999.32 3239.17 2,982.84 2,970.49 2,989.94 2964.38 2964.38
Std 0.689 229.7
34 230.192 232.217 90.50028 103.471 0 0.0006
NFE 112 20221 17387 18981 15983 19982 5000 3015
Rank 5 7 8 4 3 6 1 1
CMC
Best 5703.
20 5,756.5984 5849.03 5,993.5942 5,819.1347 5,713.9800 5693.73 5693.727
Worst 5705.
37 5,812.6480 5966.94 5,999.8053 5,912.4300 5,725.3500 5693.80 5693.731
Mean 5704.
19 5,705.6301 5893.48 5,885.0621 5,701.9230 5,699.2670 5693.75 5693.727
Std 0.955 50.36
94 50.867 40.84568 45.63470 12.690000 0.014 0.002328
NFE 163 29483 26829 28945 20436 19496 15000 4783
Rank 5 6 8 7 4 3 2 1
Vowel
Best 14939
4.6 159,153.49 149370.47 162,108.54 159,458.14 161,431.04 148967.2 148967.2
Worst 16184
5.5 165,991.65 165986.42 165,996.43 165,939.83 165,804.67 149048.6 149083.9 Mean 15144
5.29 149,513.73 161566.28 149,468.27 149,395.60 149,201.63 148987.6 149030.4 Std 3119.
751 3,105.5445 2847.085 2,846.2351 3,485.3816 2,746.0416 36.086 45.88285 NFE 129 10548 9423 9528 8046 8436 7500 5667
Rank 7 6 8 5 4 3 1 2
Mean Rank 5.6 6.333
3333 7.8333333 5.6666667 4 3.6666667 1.5 1.333333
Final Rank 5 7 8 6 4 3 2 1
REFERENCES
1. Jain, A.K., Murty, M.N., and Flynn, P.J., 1999. Data clustering: A review. ACM Computing Survey, 31,pp.264-323.
2. Jiawei han,Michelin Kamber , 2010. Data mining concepts and techniques, Elsevier.
3. Kennedy, J., and Eberhart, R.C. , 2001. Swarm Intelligence, Morgan Kaufmann 1-55860-595-9.
4. Selim, S.Z., and Al-Sultan, K.S., 1991. A simulated annealing algorithm for the clustering problem. Pattern Recognition. 24(10), pp.1003–1008.
5. Ujjwal Maulik, Sanghamitra Bandyopadhyay, 2000. Genetic algorithm-based clustering technique. Pattern Recognition. 33, pp.1455-1465.
6. Sung, C., & Jin, H. (2000). A tabu-search-based heuristic for clustering. Pattern Recognition, 33, pp.849–858.
7. Shelokar, P.S., Jayaraman, V.K., Kulkarni, B.D., 2004. An ant colony approach for clustering. Analytica Chimica Acta, 509( 2), pp.187–195.
8. Liu, Y., Yi, Z., Wu, H., Ye, M., Chen, K., 2008. A tabu search approach for the minimum sum-of-squares clustering problem. Information Sciences. 178 , pp. 2680–2704 .
9. Yi-Tung Kao, Erwie Zahara , I-Wei Kao, 2008. A hybridized approach to data clustering. Expert Systems with Applications. 34(3), pp.1754–1762.
10. Fathian, M. , Amiri, B. , 2008. A honey-bee mating approach on clustering. The International Journal of Advanced Manufacturing Technology. 38, pp.809–821.
11. Dervis Karaboga, Celal Ozturk., 2011. A novel clustering approach: Artificial Bee Colony (ABC) algorithm. Applied Soft Computing. 11,pp. 652–657.
12. Xiaohui Yan, Yunlong Zhu , Wenping Zou, Liang Wang, 2012. A new approach for data clustering using hybrid artificial bee colony algorithm. Neurocomputing. 97 , pp. 241–250.
13. Miao Wan ,Lixiang Li ,Jinghua Xiao ,Cong Wang , Yixian Yang., 2012. Data clustering using bacterial foraging optimization. Journal of Intelligent Information Systems. 38(2), pp.321-341.
14. Senthilnath, J., Omkar, S.N., Mani, V., 2011. Clustering using firefly algorithm: performance study. Swarm and Evolutionary Computation. 1(3), pp.164–171.
15. Tunchan Cura, 2012. A particle swarm optimization approach to clustering. Expert Systems with Applications. 39(1), pp.1582–1588.
16. Abdolreza Hatamlou ,2012. In search of optimal centroids on data clustering using a binary search algorithm. Pattern Recognition Letters. 33, pp.1756–1760.
17. Abdolreza Hatamlou, 2013. Black hole: A new heuristic optimization approach for data clustering. Information Sciences. 222, pp.175-184.
106 J. ADV COMP ENG TECHNOL, 5(2) Spring 2019
Algorithm for Cluster Analysis. World Applied Sciences Journal. 4 (2), pp.300-307.
19. Taher NIKNAM, Babak AMIRI, Javad OLAMAEI, Ali AREFI, 2009. An efficient hybrid evolutionary optimization algorithm based on PSO and SA for clustering. Journal of Zhejiang University SCIENCE A. 10(4), pp.512-519.
20. Bahamn Nahmanifirouzi, lokhtar sha sadeghi and taher niknam, 2010. A new hybrid algorithm based on PSO,SA and K-means for cluster analysis. Int journal of innovative computing,information and control, 6(7), pp.3177-3192.
21. Niknam, T., Olamaei, J., Amiri, B., 2008. A Hybrid Evolutionary Algorithm Based on ACO and SA for Cluster Analysis. Journal of Applied sciences. 8(15), pp.2675-2702.
22. Taher Niknam, Babak Amiri, 2010. An efficient hybrid approach based on PSO, ACO and k-means for cluster analysis. Applied Soft Computing. 10, pp.183–197.
23. Chi-Yang Tsai, I-Wei Kao, 2011. Particle swarm optimization with selective particle regeneration for data clustering. Expert Systems with Applications. 38, pp. 6565– 6576.
24. Taher Niknam , Elahe Taherian Fard , Narges Pourjafarian , Alireza Rousta, 2011. An efficient hybrid algorithm based on modified imperialist competitive algorithm and K-means for data clustering. Engineering Applications of Artificial Intelligence. 24 (2), pp.306–317.
25. Ganesh Krishnasamy, Anand J. Kulkarni , Raveendran Paramesran, 2014. A hybrid approach for data clustering based on modified cohort intelligence and K-means, Expert Systems with Applications, 41, pp. 6009– 6016.
26. Amir Hossein Gandomi, Amir Hossein Alavi . 2012. Krill herd: A new bio-inspired optimization algorithm, Communications in Nonlinear Science and Numerical Simulation, 17, pp.4831–4845.
27. Gai-Ge Wang , AmirH.Gandomi , AmirH.Alavi , 2014, Stud krill herd algorithm , Neurocomputing, 128, pp.363–370.
28. Gai-Ge Wanga, Amir H. Gandomi, Amir H. Alavi, 2014, An effective krill herd algorithm with migration operator in biogeography-based optimization, Applied Mathematical Modelling, 38, pp.2454–2462.
29. Gai-Ge Wang, Amir H. Gandomi , Amir H. Alavi ,Guo-Sheng Hao, 2014, Hybrid krill herd algorithm with differential evolution for global numerical optimization, Neural Comput & Applic, 25, pp.297–308.
30. GaigeWang, Lihong Guo, Amir Hossein Gandomi, Lihua Cao, Amir Hossein Alavi,Hong Duan, and Jiang Li1, 2013. Lévy-Flight Krill Herd Algorithm, Mathematical Problems in Engineering.
31. Barthelemy P., Bertolotti J., Wiersma. D. S., 2008. A Levy flight for light. Nature. 453, pp. 495-498.
32. Huseyin Hakl., & Harun Uguz.(2014).A novel particle swarm optimization algorithm with Levy flight. Applied Soft Computing, 23, pp.333–345.
33. Xin-She Yang.(2010). Nature-Inspired Metaheuristic Algorithms: Second Edition. (pp. 11-19). United Kingdom, Luniver Press.
34. Yang, X.-S., & Deb, S. (2010). Engineering Optimisation by Cuckoo Search. Int. J. Mathematical Modelling and Numerical Optimisation, 1(4), pp.330–343.
35. Blake, C.L., Merz, C.J., 1998. University of California at Irvine Repository of Machine Learning Databases. <http://www.ics.uci.edu/mlearn/ MLRepository.html>
36. Arthur, D., & Vassilvitskii, S. (2007). K-means++: The advantages of careful seeding. In Proceedings of the eighteenth annual ACM–SIAM symposium on discrete algorithms SODA ’07, Philadelphia, PA (pp. 1027–1035). USA: Society for Industrial and Applied Mathematics
37. http://www.mathworks.com/matlabcentral/ fileexchange/55486-krill-herd-algorithm
38. R.Jensi and G.Wiselin Jiji, 2015. Hybrid data clustering approach using k-means and flower pollination algorithm. Advanced computational intelligence: an international journal (ACII), 2 (2), pp.15-25.
39. R.Jensi and G.Wiselin Jiji, 2015. MBA-LF: a new data clustering method using modified bat algorithm and levy flight. ICTACT journal on soft computing, 6(1), pp.1093-1101.
40. G.-G.Wang, A.H.Gandomi, X.- Yang, and A.H.Alavi.2016. A new hybrid method based on krill herd and cuckoo search for global optimisation tasks, International Journal of Bio-Inspired Computation , 8(5), pp.286-299.
41. G.Wang L.Guo H.Wang H.DuanL.LiuJ.Li, 2014. Incorporating mutation scheme into krill herd algorithm for global numerical optimization, Neural Computing Applications, 24(3), pp.853-871.
42. Raed Abdulkareem HASAN, and Muamer N. MOHAMMED, 2017. A Krill Herd Behaviour Inspired Load Balancing of Tasks in Cloud Computing, Studies in Informatics and Control, 26(4), pp. 413-424.
43. Qin Li and Bo Liu, 2017. Clustering Using an Improved Krill Herd Algorithm, Algorithms, 10(56), pp.1-12.
44. Kinza Qadeer, Muhammad Abdul Qyyum, and Moonyong Lee, 2018. Krill-Herd-Based Investigation for Energy Saving Opportunities in Offshore Liquefied Natural Gas Processes, Ind. Eng. Chem. Res., 57 (42),pp.14162– 14172.