Please cite this article as: H. R. Rezaei, H. Khademi Zare, M. Bashiri, M. B. Fakhrzad, Re-configuration of the Relief Network Considering Uncertain Demand and Link Failure in an Earthquake: A Multi-stage Stochastic Programming, International Journal of Engineering (IJE), IJE TRANSACTIONS C: Aspects Vol. 31, No. 6, (June 2018) 932-942
International Journal of Engineering
J o u r n a l H o m e p a g e : w w w . i j e . i rRe-configuration of the Relief Network Considering Uncertain Demand and Link
Failure in an Earthquake: A Multi-stage Stochastic Programming
H. R. Rezaeia, H. Khademi Zare*a, M. Bashirib, M. B. Fakhrzada
a Department of Industrial Engineering, Yazd University, Yazd, Iran b Department of Industrial Engineering, Shahed University, Tehran, Iran
P A P E R I N F O
Paper history:
Received 17 April 2017
Received in revised form 25 February 2018 Accepted 15 April 2018
Keywords:
Disaster Management Re-configuring Re-positioning Preparedness Facility
Multi-stage Stochastic Programming Scenario Tree
Link Damage
A B S T R A C T
Disasters inevitably trigger far-reaching consequences affecting all living things and the environment. Therefore, top managers and decision-makers in disaster management seek comprehensive approaches to evaluate facilities and network preparedness in dealing with the response phase of predicted disaster scenarios in terms of number of casualties, costs, and unmet demands. In this regard, previous studies on the preparedness phase have often been limited to the location of eligible facilities without considering other important factors such as current assets, entities and configuration. Thus, the present study proposes a reconfiguring and repositioning model in order to simultaneously assess whether existing support bases should remain, be consolidated or phased out as well as whether new support base facilities should be established and subsequently supply and demand requirements considered. In the proposed model, in addition to considering a scenario tree for destruction and demands, network links affected by the intensity of disaster events are also evaluated. Furthermore, in order to increase reliability, the destruction of network links takes into account that link failures give rise to vulnerability in related links. In the proposed model, multi-stage stochastic programming has been implemented on various real destruction and demand scenarios. The results indicate definite advantages in the re-positioning or reconfiguring model compared with current configurations. Moreover, the superior capability of the applied solving approach versus one of the traditional approaches is also appraised.
doi: 10.5829/ije.2018.31.06c.10
1. INTRODUCTION1
A disaster is a suddenly and dangerous event that strongly influences the infrastructure and function of a society so that human, economic or environmental losses may be some parts of the demolition range.
Any sort of disasters including natural (e.g. earthquakes, floods, hurricanes, tsunamis) and man-made (war, political/tribal disturbance) leads to crucial and far-reaching after effects so that the lack of supportive plans in pre-, during and post-disaster periods will cause the vulnerability or even inability to decline the potential negative outcomes. Disaster management includes four sequential phases that can be
*Corresponding Author Email: [email protected] (H. Khademi Zare)
on the real assumption, it seems that one of the supportive analytical platforms to make an explicit plan for the upcoming disasters is a redesigning or reconfiguring model that can evaluate the gap between current configuration and the optimum reconfiguration from the stand point of costs, fatalities, and other serious criteria that lack of enough attention to them will lead to irreversible consequences. It seems that a reconfiguration model should be able to:
A. Respond to some key questions about the locations such as SBs (as distribution center); which facilities should remain, be established, phased out or consolidated?
B. Determine the distinction between reconfiguring network and the current configuration capabilities during the disaster occurrence in terms of fatalities, costs, shortages, covered demands and any other factor that can be vital in decision-making.
The remainder of the paper is organized as follows. The literature of the preparedness phase for the disaster management is discussed in section 2. In the next section the details about studied problem are given as problem description. The proposed formulation of re-configuring model with consideration of link damage and its extension for a path-in-the-scenario-tree-based formulation are presented in section 4. Section 5 analyzes the results of two numerical examples. Thereafter, the paper ends with some conclusions and future research suggestions.
2. LITERATURE REVIEW
In this section, in order to highlight the contribution of the paper, the researches in the classification of preparedness mathematical models and failure effects on infrastructures have been surveyed.
The distribution of published works reveals that concentration on preparedness and response phase outweighs the mitigation and recovery phases. This means that the researchers have drawn more attention to preventive and responding decisions before and after the disasters (for more realization and better evidences see Figure 1 derived from literature [3]).
Figure 1. Distribution of researches based on phase of disasters derived from ref. [3]
Generally speaking, Governments, non-governmental organizations (NGOs) and humanitarian organizations can improve the agility and quality of the Humanitarian Relief Logistics (HRL) if they would participate in relevant policy-making or in resources allocation to pre-determined network in which desirable network and facility characteristics and also required goods of Relief Logistic Centers (RLCs) are decided and authorized in advance that a disaster occurs. The above-mentioned problem is known as Location with Relief Distribution and Stock Pre-positioning (LRDSP) problem in the HRL literature. In this regard, Rawls and Turnquist [4] have proposed a heuristic algorithm, using Langrangian L-shaped in order to solve a two- stage stochastic scenario-based MIP. Their paper is associated with development of a pre-positioning planning tool for hurricane in an uncertain environment. In their model, the objective function is to minimize the expected costs over all scenarios and contains the selection of facility locations and their capacities, commodity stocking decisions, unused material holding costs and unmet demand penalties, considering uncertainty in demand for stocked supplies and transportation network availability. Rawls and Turnquist [4] have proposed pre-positioning of the emergency supplies for natural disasters in a large-scale problem. The aforementioned papers [4, 5] have emphasized on the unlimited budget but sometimes sufficient and available budget can be financially prohibitive. Hence, in order to quenching the calamity as well as improving the reliability of the logistics network in our proposed model, the weighted shortages have been considered as an objective function while the budget considerations have been assumed in the constraints. Vargas-Florez et al. [6] have aimed to propose a supply chain model to support the relief in case of crisis. The authors have considered the determination of warehouse location as well as the number and the capacity of them. The classification of their model is a pre-positioning not a repositioning model which is discussed in the current work. Some researchers have addressed the holistic visions for initial design of LRDSP. Rezaei-Malek et al. [7] have proposed a comprehensive multi objective approach to consider the efficiency, efficacy and balance for relief pre-positioning, simultaneously. They have considered some functions including the total cost, expected time, priority, and demand-weighted utility levels of the delivered relief commodities. However it seems that some re-positioning model needs to be proposed for conformity of existing facilities and eligible facilities. Before Rezaei-Malek et al.’s [7] research paper, some investigations had emphasized the need for efficient and balanced disaster relief logistics (DRL). In this regard, Gutjahr and Nolz [8] have addressed some different combination for HRL’s efficacy evaluation including response time, travel distance, coverage, reliability and Response
46%
Mitigation 22% Preparden
ess 28%
security. Rodriguez-Espindola and Gaytan [9] contributed to the LRDSP literature through a concurrent determination of the location of emergency shelters and distribution centers (DCs) along with an allocation of required relief centers (RCs) to DCs. They presented a bi-objective mathematical model so that the first objective was minimization of acquisition costs, shipping costs and facility preparation costs (as a measure of efficiency), and the second one minimizes the total priority-weighted distance traveled by goods and people (as an efficacy measure). Ahmadi et al. [10] have proposed a two-stage stochastic, multi-depot, location-routing model considering random travel time, multiple usage of vehicles and standard relief time in order to decide and determine the locations of local depots and routing for last mile distribution after an earthquake. Noyan [11] have proposed a novel extension of Rawls and Turnquist [4] model by considering conditional value at risk (CVaR) as the risk measure on the total cost in addition to its expectation. There also exist chance-constrained variants [12, 13]. Shishebori [14] has developed a facility-location network in a real case study so that the backup facilities and failure costs are a partial of his contribution in order to enhancing the reliability. Moreover, Bozorgi-Amiri and Asvadi [15] also have addressed a multi-objective robust optimization approach for a pre-positioning model so that they have deliberated an exogenously approach to failure in a case study on planning for earthquake scenarios in 22 regions for RLCs in Iran. They have ranked RLCs considering some criteria including cost, technical issues, availability risk and coverage.
Since this paper considers link failure, therefore some papers that have considered failure and destruction assumptions in prepositioning models have been surveyed. There are two sorts of implementation of destruction on failure links called endogenous and exogenous approaches. The exogenous approach models the failure effects through defining what damage will be at every link or location, for every disaster scenario, while the endogenous damages are computed via a distance based or impact based functions. Zarrinpoor et al. [16] have designed a health service network including candidate location of hospitals, treatment units and demand nodes. They have considered congestion, exogenous failure (predefined binary parameter based one destruction scenario) on model and a robust approach derived from literature [17] as a solving approach. As mentioned above in the scope of the LRDSP investigations, Rawls and Turnquist [4] have studied a pre-positioning of supply where damage to supplies is exogenously considered as the predetermined scenarios, similar to study of Jia et al. [18].
In contrast to aforementioned researches with exogenous failure considerations, Verma and Gukler [19] have taken endogenous failure into account in a prepositioning model. They have addressed the uncertainty in the magnitude of damages caused by a large-scale disaster via the definition of a distance-damage function. In addition, Salman and Yucel [20] have provided another joint link failure approach based on reliability and proximity ordering of the existing link in the junctions. The authors have measured the distance between two links as the minimum distance between the corresponding four pairs of nodes. Our study differs from Salaman and Yucel’s method [20] in terms of more accurately measurement approach for distance of two links thorough determination of the sub-nodes distances on entire link rather than only attention to start and finish nodes on the link. This approach makes more exact proximity set around the closed link after disaster (especially in the earthquake). Moreover, as another main extension, the acceptable links’ strength versus actual values is comprised in order to clarification of the link status. To the best of authors’ knowledge, the present paper can contribute for proposing the reconfiguration of the relief network. In what follows, the main contributions of this paper (which differentiate our efforts from the other efforts dedicated to the LRDSP category) are briefly expressed:
Proposing a reconfiguration model for relief logistics and relations between echelons in a three-level relief logistics network.
Considering four decisions for the support base facilities including maintaining the existing facilities, new establishment, and consolidation the existing ones with other facilities or completely phase out the redundant facilities.
Considering an endogenous failure approach with more accurate distance function between closed link and other links.
Considering the distance based coverage radius in order to quick response to demand requests.
Appling a multi-stage stochastic programming to overcome uncertainty.
3. PROBLEM DESCRIPTION
The basic settings for repositioning model are defined by three echelons: suppliers, SBs (or DCs) and demand points (such as hospitals, shelters and etc.). In this regard, some significant concerns should be responded for the echelons and their relations such as:
A. Will the current configuration that has been established according to a valid model in the past be optimum confronting the new situation? B. If we are going to plan for the future and according
decisions will decline the fatalities, costs and other crucial factors?
C. If we have a predefined scenario tree for destruction and demands in the post disaster horizon, which solving approaches can respond to above concerns and overcome the uncertainty?
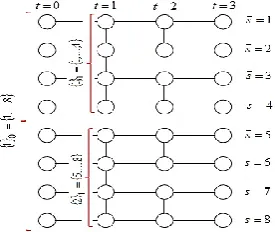
3. 1. Reconfiguration It is indisputable that long-term population changes are likely to have impacts on infrastructure and population distribution. The impacts of these changes must be evaluated on existing relief network that has been established beforehand because the previous location and network may not be optimum for current situation. Consider two main suppliers for relief goods, two existing SBs, three new eligible SBs, and three known demand point for DRL. To visualize in desire manor and as a simple illustration, Figure 2 can be a hypothetical result of applying the model and the solution method.
3. 2. Planning Horizons The planning horizons are divided to two main classifications including pre- and post-disaster horizons while each main horizon may consist one or more periods. The pre-disaster horizon is related to strategic decisions whereas post-disaster’s variables are associated with details of the relief goods flow and storage throughout first 72h.
3. 3. Dealing with Uncertainty In the present investigation, uncertainty is associated with destruction scenarios that depend on level of magnitude, longitude, latitude and peak ground acceleration (PGA).
Figure 2. New configuration of network as a sample after model implementation
Figure 3. Decisions from now up to the first 72 h
The destruction scenario tree makes the requested demands and indirectly, link destruction.
4. PROPOSED MODEL
In this section, after presentation of the notation in section 4.1, we propose the multi-stage stochastic programming model in a MIP formation in section 4.2, then in the section 4.3, non-anticipatively constraints will be presented and in the section 4.4., in order to adding the failure link assumptions to the model, the preprocessing steps are proposed.
4. 1. Notation In what follows the notations of the sets, parameters and decision variables are defined. (Nomenclature)
Sets and Indices:
I Set of suppliers, indexed by i1,...,I EJ Set of existing SBs, e1,...,EJ
NJ Set of new candidate SBs,nEJ 1,...,EJ NJ
J Set of all SBs, (JEJNJ ), j1,...,J K Set of demand nodes, k1,...,K
jk
R
Set of initial routes between j and k,
jk jk ,...,R
r 1
C Set of commodities, c1,...,C
S Set of scenarios (events) in each period, s1,...,S
S
Set of paths, each path consists of some sequential
events in the scenario tree, s1,...,S
T Set of the time periods,t0,...,T (t=0:
pre-disaster) Parameters:
s t
P Probability of occurrence for path sup to period t
s ckt
CW Shortage weight of c requested by demand point k at period t on path s
s cijt
PR
Cost per unit for Production and transportation of commodity c from supplier i to SBj at time period
t on path s
s cjkrt
TR
Shipment cost per unit of commodity c from SBj
to demand node k thorough r-th route of transportation at time period t on path s
s cjt
IC Unit handling cost of relief good c at SBj during
time period t on path s
j
FC Fixed cost of handling and maintenance for active SBj until forecasted time for crisis occurrence
j
RV
Estimated revenue achieved from cultural and social activities in SB j until forecasted time for crisis occurrence
n
NC
Fixed cost of establishing new candidate SB n
(excluding fixed cost of handling and maintenance)
e
CB Income from phase-out of the redundant existing
3rd Period Pre-disaster horizon:
Preparedness decision variables: {SBs (opening new candidate, consolidating, phasing out, remaining) }
Now Predicted beginning of earthquake
Time
Post-disaster periods: Relief goods quantity for
supply,storage, and etc.
1st Period
End of the first 72 h: Ref. [5]
SBe (sale of land, building)
ej
CRL Overhead cost caused by consolidating SBe to SBj
cj
CCP Cost per unit for capacity mobilization of the SB j (commodity c)
ce
CPRL Throughput capacity of the commodity c at SB e available for consolidation to the others
s
BDG The budget available now for satisfying the
demands on path s
MAX cit
P Maximum procurement capacity of commodity c
prepared by supplier i at period t
MAX cj
CP Maximum capacity of SB j for commodity c 0
cj
CP Initial capacity of SB j for commodity c 0
cj
II Current or initial inventory level of commodity c at existing SB j (it can be zero for the new SBs)
ce
IRL Throughput relief goods c at SB e available for consolidation
s ckt
D
Demand of node k for relief good c in period t on path s( for t=0,D equals 0)s rjkt
FL
Availability of r-th route connecting SB j to demand node k at time period t on path s(binary value)
c
Capacity coefficient of commodity c
rjkt
CY The available capacity of the r-th route between SB
j and demand node k at time period t Decision Variables (Continuous Variables):
s cijt
X Amount of relief good c provided by supplier i to SB j at time period t on path s
s cjkrt
Y
Amount of relief good type c shipped from SB j to demand node k through r-th route at time period t
on path s
s ckt
W Shortage of c requested by demand point k at period t on path s
s cjt
II Inventory level of commodity c being held at j at
the end of time period t on path s
cj
CP
Internal extended capacity of the commodity c to be added to SB j (excluding consolidated and equipped capacity from other SBs)
Decision Variables (Binary Variables):
ej
Z
Consolidation decision of SB e to SB j (for those indices in which
e
j
, SB e is consolidated withj)
jj
Z
Decision for remaining open (SB e) or establishment decision of the new SB n (
nn ee jj Z Z
Z )
4. 2. Formulation The objective function and the constraints of the proposed model are presented in this section. In this regard, the minimization objective function includes a commodity-based loss function throughout post disaster’s periods (t0) that is associated with weighted shortage of demands. The weights simultaneously depend on the necessity of the commodities at each period and the criticality of demand nodes. Moreover, the probability of each path up to each period (Pts ) is calculated based on
consecutive multiplying the probabilities of events on considered path up to the period t.
T,t 0
t s S c C
s ckt s ckt K k s
t .W .CW
P Min
(1)
Relations (2) are composed eight terms that must be less than available budget for each path of scenario tree (S ) not a scenario of particular period.
(2 1)
C
c i Ij Jt T cijts cijts X . PR ) 2 2 ( 0 \ .
Cc j Jk Kr R t T
s cjkrt s cjkrt jk Y TR ) ( J j jj j j ) ( C c j Jt T
s cjt s
cjt .II (FC RV ).Z
IC 4 2 3 2 ) 6 2 ( ) 5 2 ( ) 1 .( .
EJ e ee e NJ n nnn Z CB Z
NC
) 7 2 ( ) ( . EJ e e j J j ej ej Z CRL S s , BDG ) Z . CPRL ( CP . CCP s ) ( ) j e ( EJ e ej ce cj C c j Jcj
8 2 (2)
Terms (2.1) and (2.2) emphasize on the expenses of the procurement and shipment from the suppliers to SBs and then to the demand points. Term (2.3) considers the storage costs in the SBs. Also, terms (2.4)-(2.8) deal with strategic decisions so that term (2.4) considers the cost of maintenance the SBs (whether the active existing SBs or the newly established ones) and the predicted revenue that can be attained by temporary using the SBs for cultural and social benefits in the pre-disaster (2.5) determines the establishment cost of the new SBs that should be opened. Moreover, term (2.6) considers the income resulting from the closure of the existing redundant SBs. Term (2.7) considers the cost for consolidating the redundant existing SBs to the other active SBs and (2.8) emphasizes on the expanding cost of needed extra capacity (mobilization for consolidation or internal development). The right-hand side budget is determined based on available budget of considered path not a specific scenario.
S s T t I i C c P X J j MAX cit s
cijt
, , , , (3)Constraint (4) expresses that initial, consolidated and internal development of capacity for each SB cannot exceed the maximum capacity.
J j , C c , Z . CP CP Z . CPRL CP jj 0 cj MAX cj ) j e ( EJ e ej ce cj (4)Equalities (5) and (6) set the inventory level of pre disaster and post disaster horizons, respectively (i.e. inventory equilibrium). The pre disaster storage level is determined in equality (5) for each SB based on its own initial storage, consolidated relief goods provided by redundant SBs and ordered goods as precautionary reserve before disaster occurrence. Besides, relation (6) specifies the inventory level of each post disaster’s period so that the inventory (on-hand quantity) and dispatched relief goods at each period are procured by ordering at that period and the remained inventory received from previous period.
S s , J j , C c , 0 t , X Z . IRL II II I i s cijt ) j e ( Ej e ej ce 0 cj s cjt (5)
s ST t J j C c X II II Y jk R r s cijt s t cj s cjt K k s cjkrt
, 0 \ , , , ) 1 ( (6)inequalities (7) and (8) represent the capacity of SBs’ infrastructures in order to keeping the inventories and received orders. S s J j C c t Z CP Z CPRL CP
II cj jj
j e EJ e ej ce cj s cjt , , , 0 , . . 0 ) ( (7) S s T t J j C c Z CP Z CPRL CP X II jj cj j e EJ e ej ce cj I i s cijt s t cj , } 0 { \ , , , . . 0 ) ( ) 1 ( (8)
Constraint (9) indicates the required demands that should be met at each period and each considered path in scenario tree. This relation will lead to shortage recognition that has been mentioned in the objective function (1). Moreover, FLrjkwill be clarified in section
(4.4) based on the proposed preprocessing procedure for failure links. Also the available capacity of each route is determined in the relation (10).
S s , K k , C c , \ T t , D W Y . FL R r j Js ckt s ckt s cjkrt s rjkt 0 (9) S s , T t , K k , J j , R r , CY . FL Y
. rjkts rjkt c s cjkrt c
(10)Constraint (11) ensures an existing SB cannot be consolidated into another existing one, unless destination SB remains active. In order to reduction of constraints, the cardinality EJ is resulted by summation of the constraintsZejZjj over set EJ with
the equal RHS. Similarly, constraint (12) assures the above condition for the newly established SBs.
EJ j , Z EJ Z jj EJ e
ej (11) NJ j , Z EJ Z jj EJ e
ej
(12)
Also, inequality (13) determines that each SB can be merged with the unique destination SB. Equality (14) has been considered because we have no relief to dispatch in the pre-disaster horizon (t=0). As it mentioned in (15), collection of non- anticipatively constraints will be discussed in the next section.
EJ e Z e j J j
ej
, 1 ) ( (13) S s , R r , K k , J j , C c , t ,Ycjkrts0 0 (14)
{Non-Anticipatively Constraints} Section 4.3 (15)
0 cj s cjt s cjkrt s
cijt ,Y ,II ,CP
X (16)
0,1) ( : ),
( jj ee, nn
ej e j Z Z Z
Z (17)
Finally, Constraints (16) and (17) restrict decision variables to be positive and binary.
4. 3. Non-Anticipatively Approach In this section, split-variable formulation is proposed. For this purpose, the issue may be understood by looking at the Figures 4 and 5, where vertical dotted lines are drawn correspond to non-anticipatively requirements (two scenarios at each period). Let us denote the set of paths which are not distinguishable froms(scenario s not path s) up to time period t by
st, for example and according to Figures 4 and 5, at period t=0 whatever occurs, the decision variables can be considered equal for all coming paths that cannot be recognizable in advance (i.e.
101,...,8
). It is clear that in the firstset of decision variables for each decision node. The decision variables corresponding to a node must be equal to the variables of the other different paths at the same time t if paths are indistinguishable at time t and may occur (non-anticipatively). Therefore, we define non-anticipatively constraints and the set sfor the decision variables (except for strategic ones) as follows:
s cijt
X =Xcijts', s,s'
st (15-1)
t 's cjkrt s
cjkrt Y , s,s' s
Y (15-2)
, ' s cjt s cjt II
II s,s'
st (15-3)4. 3. Failure Link In order to decision about the binary value of FLrjkts(route status) that is affected by
the destruction intensity on scenario paths and distance from closed links, the below steps are proposed:
Step 1. Identify all possible routes (r=1,…,Rjk routes)
between j and k and denote the existing nodes of links on r-th route by
jn1jkr,n2jkr,...,npjkr,npjkr1,...,nfjkrk
. Then, set initial survival value for each route equal to 1 (1
s rjkt
FL ) with the initial assumption that all links of each route will be active. Notice that only one closed link suffices to close the route.
Step 2. Definejk, which specifies the acceptable coverage distance between j and k that may differ due to priority of emergency for each demand node.
Figure 4. A sample scenario tree with 8 paths
Figure 5. A non-anticipatively structure
Step 3. Denote acceptable survival rate (LTB:the larger the better) for each link according to each period and
considered path on scenario tree by
011 , SRt,s
jkr p n , jkr p n
and
actual survival value by
011 , Vt,s
jkr p n , jkr p n
.
Step 4. SetFLrjkts0(demolished) if at least one of the
below conditions are met for r-th route between j , k: i. Lenjkrjk : Distance Coverage
WhereLenjkris the length of r-th route between j, k.
ii. 1 1
1 1
f ,..., p , V
SR t,s
jkr p n , jkr p n s
, t
jkr p n , jkr p
n :Link stability
Notice that a route may be ruined at any period by happening a set of events on scenario tree’s path, for this reason, relation (ii) considers both scenario tree’s path and periods to determin the links status.
Step 5. Define the intervals based on distances for each link by AI, then determine the points (sub-nodes including two main nodes and other nodes in between) of each link based on AI. For example suppose a sample section of a route’s link (Len:450m), if AI=150, the below segmentation is considered (four sub-nodes):
Step 6. Calculate the euclidean disatance between two links considering the minimum distance between the corrossponding pair of two links’ sub-nodes. Let us notate the distance between the first hypotetical link
) n , n
( pjkr pjkr1 and the second link (n ,n )
' r ' k ' j ' p ' r ' k ' j '
p 1 by ))
n , n ( ), n , n ((
DL pjkr pjkr1 pj''k'r' pj''k'1r' . It is worth to noting that the proposed distance calculation between pair of sub-nodes leads to form the more accurately vicinity set around a closed link. The following sample for distance calculation between Golestan Street and Khorvardin Boulevard stresses that distance between two links based on start and end nodes of links (single line) [20] can be ameliorated by the proposed steps 5 and 6 (double-line).
Step 8. For each failure link ( t,s jkr p n , jkr p n s
, t
jkr p n , jkr p n
V SR
1
1
) that
was recognized in step 4, create vicinity set if the link )
n , n
( pj''k'r' pj''k'1r' has the conditions of
AI= 150 m
Link---)) n , n ( ), n , n (( VD )) n , n ( ), n , n ((
DL p'j'k'r' t,s pjkr pjkr p'j'k'r' p'j'k'r' '
r ' k 'j ' p jkr p jkr
p 1 1 1 1
(where VDt,s is venture distance around (npjkr,npjkr1)at period t on paths). If t,s 'jk'r'
' p n , jkr
' p n s
, t
jkr p n , jkr p n
V V
1
1
, change the
condition of (npj''k'r',npj''k'1r') to closed for all t and all paths by zero value:FLr'j'kts0
5. COMPUTATIONAL RESULTS
In this section, two problems (P1 and P2) are expressed to highlight the merits of the proposed model. In this regrad, a network including suppliers, SBs and demand points have been considered and the problem dimentions have also been summerized in Table 2. The disruption scenarios and its related demands have been derived from literature [21]. For example, the charachtristics of a scenario for a period of P1 have been tuned based on magnitude (6.531), longitude (51.131), latitude (35.844), PGA at city centre (186.59) and return period (333). Moreover, the selected districts for eight demand nodes are 5, 15, 16, 22, 20, 7, 14 and 1, respectively. Also, all main costs for reconfiguration have been gathered through inquiries done based on locations of the facilities (FC, NC, RV). Also, transportation costs have been calculated based on distances of real reference points using GIS software. To solve the problem, the model and solving approach are implimented in GAMS software (CPLEX solver).
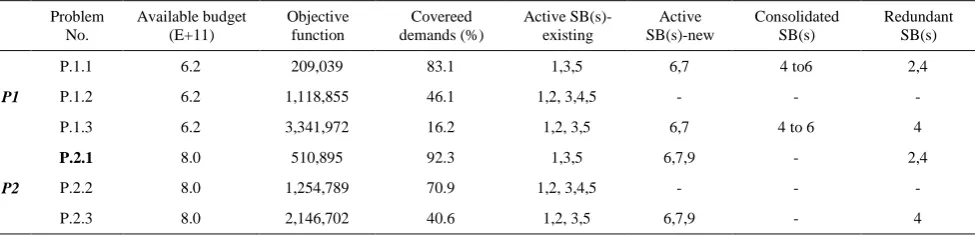
After solving the proposed model, some results including weighted unmet demands (objective function), covered demands and reconfiguration of facilities have been reported in Table 3.
For both P1and P2, we have solved three problems so that problems P11, P12 and P13 represent the reconfiguration model solved by multi stage stochastic programming (P11), countiniuing the existing configuration when faced with disaster (P12) and finally reconfiguration model solved by subtitution of the expected values instead of scenario tree (P13) for P1.
TABLE 2. Numerical examples’ characteristics
Items P1 P2
Number of Suppliers 4 5
Number of SBs 7 9
Existing SBs 5 5
Candidate SBs 2 4
Demand Nodes 8 16
Commodity classification 4 4
Max routes 4 4
Periods (after disaster occureance) 3 3
Scenarios (No. of Paths) 8 27
In what follows three solved problems of P1 are disscussed for better understanding. After solving P11, three existing SBs of five SBs must remain (1, 3 and 5), two new SBs must be established (6 and 7) and finally SB-2 and SB-4 are redundant and only the capacities of SB-4 can be consolidated to the new SB-6. The results of P11 indicate that coupling the proposed model and multi stage stochastic programming have redesigned a modified relief network so that if the predicted disaster occures, the unmet demands will not exceed 17%. That means the network reliability for demand coverage is more than 83.1%. Moreover, the results attained by encountering the existing configuration (SBs 1, 2, 3, 4 and 5) with the same predicted demands, budget and other inputs that have been considered in P11, show that the coverage of demands during the forecasted disaster equals to 46.1% while this coverage rate for P11 was 83.1%. Likewise, the weighted unmet demands (objective function) significantly decline from 1,118,855 (P12) to 209,039 (P11). Breifly, it can be similarly understood from Table 3 that P11 can definitly overcome the uncertainty versus subtitition of mean value (MV) instead of scenarios at each period. As it can be undoubtedly undestood, implimentation of multi-stage stochastic programming on the proposed reconfiguration model compared with implimentation of MV(P13) leads to increase the coverage from 16.2% to 83.1%.
TABLE 3. Results of the numerical examples
Problem No.
Available budget (E+11)
Objective function
Covereed demands (%)
Active SB(s)-existing
Active SB(s)-new
Consolidated SB(s)
Redundant SB(s)
P1
P.1.1 6.2 209,039 83.1 1,3,5 6,7 4 to6 2,4
P.1.2 6.2 1,118,855 46.1 1,2, 3,4,5 - - -
P.1.3 6.2 3,341,972 16.2 1,2, 3,5 6,7 4 to 6 4
P2
P.2.1 8.0 510,895 92.3 1,3,5 6,7,9 - 2,4
P.2.2 8.0 1,254,789 70.9 1,2, 3,4,5 - - -
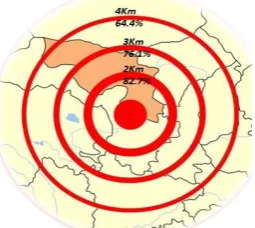
Figure 6 illustrates the top 10 configuratios in terms of demand coverage percentage and objective function. Moreover Table 4 presents more details of five top configurations. As the last analysis, the impact of VD on the vicinity set of each closed link has been appraised in Figure 7. The disaster with low impact leads to the less affected and seismic zones. As the intensity increases, the seismic zones extend and overshadow the more range of link vicinity. For example in P1, we have simplified the problem by considering a fixed VD
instead of VDt,s. Figure 7 illustrates that less than 3 km impact radius around each closed link leads 76.1% coverage while the impact of 4 km make less coverage (64.4%). To evaluate the quality of stochastic solutions for P1, let us define EV and EEVt . Let ObjEV be the optimal value of the objective function in the average scenario deterministic model, EV. EV is defined where the expected value of each parameter on the scenario tree for each time period is fixed, as follows:
T t Y y X x
T t d y B y B x A x A
y b x a Min Obj
t t
t t t 1 t 1 t t t 1 t 1 t
T t
t t t t EV
, ,
, . .
.
. '
'
EEVt is the optimal value of problem solved by multi-stage stochastic programming (Equations (1)-(17)), where the decision variables (x) until stage t −1 are fixed using the optimal value of the average scenario model (EV).
Figure 6. Top ten configuration of P1 assessed by coverage
percentage of demands and O.F.
TABLE 4. Locations for top five configuration of P1
Rank Active Existing SBs
New
Stablishment Consolidation
1 1,3,5 6,7 4 to 6
2 1,3,5 6,7 2 to 6
3 1,3,5 6,7
4 1,2,3 6,7
5 1,3, 6,7
Figure 7. Effect of V.D. on demand coverage percentage
1 t 1 t
1 1 t
x x ...
x x . t. s
) 17 ( ) 1 .( eq
EEV
Escudero et al. [22] have defined a VSS (value of stochastic solution) relation for a MSSP, even for those problems that have no feasible solution as in the case of substitution of the EV solutions in the EEV model, so that for any minimization model based on MSSP, we have the below criterion shown for performance evaluation of stochastic solution resulting from MSSP:
(VSS-Performance)
The positive values for VSS in Table 5 demonstrate the appropriate quality of stochastic solutions obtained by
MSSP. The more periods and stages that are spent, the higher value of solutions are concluded. This trend shows the considerable value of applying the MSSP in this problem. For T=0 (preparedness phase), EEV will be equal to objective function of MSSP [22].
6. CONCLUSION
In this paper, a novel reconfiguration model for the prepardeness and quick response to disaster (particlarly earthquack) was investigated. The contributions of the present research can be expressed in novel reposition and reconfiguration model for relief network. Moreover, the effect of link failure on the surrounding links has been considered based on a new compatible approach to multi-stage stochastic programming. In this regard, the total unmet demands and the demand coverage obtained by the proposed model and solving approach not only were superior to solutions of the MV, but these results also outweight the results of continiuing the current configuration. Although this research has used destruction scenarios derived from the literature, it is suggested that the model is implimented in a real case study. The future researches are proposed in Table 6.
MSSP EEV
TABLE 5. Value of stochastic solution at each stage (P1)
Decision Stage T=0 T=1 T=2 T=3
VSS 0 96191 112650 121833
TABLE 6. Future research road map
Proposed Future Research References
Integration of link restoration and
reconfiguration model for more responsiveness [25] Consideration of standard time and disatance
coverage simultaneousely. [10]
Adding the optimality and feaseability cuts to accelerate the solving approach for the large scale problems
[27]
7. REFERENCES
1. Peeta, S., Salman, F.S., Gunnec, D. and Viswanath, K., "Pre-disaster investment decisions for strengthening a highway network", Computers & Operations Research, Vol. 37, No. 10, (2010), 1708-1719.
2. Beraldi, P. and Bruni, M.E., "A probabilistic model applied to emergency service vehicle location", European Journal of Operational Research, Vol. 196, No. 1, (2009), 323-331. 3. Hoyos, M.C., Morales, R.S. and Akhavan-Tabatabaei, R., "Or
models with stochastic components in disaster operations management: A literature survey", Computers & Industrial Engineering, Vol. 82, (2015), 183-197.
4. Rawls, C.G. and Turnquist, M.A., "Pre-positioning and dynamic delivery planning for short-term response following a natural disaster", Socio-Economic Planning Sciences, Vol. 46, No. 1, (2012), 46-54.
5. Rawls, C.G. and Turnquist, M.A., "Pre-positioning of emergency supplies for disaster response", Transportation research part B: Methodological, Vol. 44, No. 4, (2010), 521-534.
6. Florez, J.V., Lauras, M., Okongwu, U. and Dupont, L., "A decision support system for robust humanitarian facility location", Engineering Applications of Artificial Intelligence, Vol. 46, (2015), 326-335.
7. Rezaei-Malek, M., Tavakkoli-Moghaddam, R., Cheikhrouhou, N. and Taheri-Moghaddam, A., "An approximation approach to a trade-off among efficiency, efficacy, and balance for relief pre-positioning in disaster management", Transportation Research Part E: Logistics and Transportation Review, Vol. 93, (2016), 485-509.
8. Gutjahr, W.J. and Nolz, P.C., "Multicriteria optimization in humanitarian aid", European Journal of Operational Research, Vol. 252, No. 2, (2016), 351-366.
9. Rodríguez-Espíndola, O. and Gaytán, J., "Scenario-based preparedness plan for floods", Natural Hazards, Vol. 76, No. 2, (2015), 1241-1262.
10. Ahmadi, M., Seifi, A. and Tootooni, B., "A humanitarian logistics model for disaster relief operation considering network failure and standard relief time: A case study on san francisco district", Transportation Research Part E: Logistics and Transportation Review, Vol. 75, (2015), 145-163.
11. Noyan, N., "Risk-averse two-stage stochastic programming with an application to disaster management", Computers & Operations Research, Vol. 39, No. 3, (2012), 541-559.
12. Rawls, C.G. and Turnquist, M.A., "Pre-positioning planning for emergency response with service quality constraints", OR Spectrum, Vol. 33, No. 3, (2011), 481-498.
13. Hong, X., Lejeune, M.A. and Noyan, N., "Stochastic network design for disaster preparedness", IIE Transactions, Vol. 47, No. 4, (2015), 329-357.
14. Shishebori, D., "Study of facility location-network design problem in presence of facility disruptions: A case study (research note)", International Journal of Engineering-Transactions A: Basics, Vol. 28, No. 1, (2014), 97.
15. Bozorgi-Amiri, A. and Asvadi, S., "A prioritization model for locating relief logistic centers using analytic hierarchy process with interval comparison matrix", Knowledge-Based Systems, Vol. 86, (2015), 173-181.
16. Zarrinpoor, N., Fallahnezhad, M. and Pishvaeeb, M., "Design of a reliable facility location model for health service networks", International Journal of Engineering-Transactions A: Basics, Vol. 30, No. 1, (2017), 75-84.
17. Mulvey, J.M., Vanderbei, R.J. and Zenios, S.A., "Robust optimization of large-scale systems", Operations Research, Vol. 43, No. 2, (1995), 264-281.
18. Jia, H., Ordóñez, F. and Dessouky, M.M., "Solution approaches for facility location of medical supplies for large-scale emergencies", Computers & Industrial Engineering, Vol. 52, No. 2, (2007), 257-276.
19. Verma, A. and Gaukler, G.M., "Pre-positioning disaster response facilities at safe locations: An evaluation of deterministic and stochastic modeling approaches", Computers & Operations Research, Vol. 62, (2015), 197-209.
20. Salman, F.S. and Yucel, E., "Emergency facility location under random network damage: Insights from the istanbul case", Computers & Operations Research, Vol. 62, (2015), 266-281. 21. Zolfaghari, M. and Peyghaleh, E., "Probabilistic earthquake
scenarios for the city of tehran", in Proceedings of the 14th European Conference of Earthquake Engineering. (2010). 22. Escudero, L.F., Garin, A., Merino, M. and Pérez, G., "The value
Re-configuration of the Relief Network Considering Uncertain Demand and Link
Failure in an Earthquake: A Multi-stage Stochastic Programming
H. R. Rezaeia, H. Khademi Zarea , M. Bashirib, M. B. Fakhrzada
a Department of Industrial Engineering, Yazd University, Yazd, Iran b Department of Industrial Engineering, Shahed University, Tehran, Iran
P A P E R I N F O
Paper history:
Received 17 April 2017
Received in revised form 25 February 2018 Accepted 15 April 2018
Keywords:
Disaster Management Re-configuring Re-positioning Preparedness Facility
Multi-stage Stochastic Programming Scenario Tree
Link Damage
هدیکچ
دنیامن یم داجیا ار یدج یناسنا ریغ و یناسنا یاهدمایپ و تارثا دیدرت یب و هراومه اه نارحب ن هب
و ناریدم هک یوح
یبایزرا یارب ییاهدرکیور لابند هب هزوح نیا نلاک نازاس میمصت هست یدنب هرکیپ ینونک یگدامآ حطس
رظن زا دوخ تلای
نازیم یر همانرب رد هدش ینیب شیپ نارحب اب ههجاوم رد هدشن هدروآرب یاهاضاقت و اه هنیزه ،تافلت زاف یز
یگدامآ یاه و
ج تلایهست یبای ناکم هب دودحم بلغا یگدامآ زاف رد ینونک تاقیقحت ،اتسار نیا رد .دنشاب یم خساپ ب دید
و هجوت نود
یاه یدنب هرکیپ و اه تیدوجوم ،اه ییاراد ی هظحلام تیعقوم لدم کی ،هلاقم نیا رد .دشاب یم دوجوم
یبای هرکیپ ای
و یرادهگن ینونک تلایهست نتسب ای یرادهگن صوصخ رد نامزمه روط هب ات تسا هدش داهنشیپ ددجم یدنب یزوت
ملاقا ع
یهست ریاس اب هدافتسا لاب تلایهست ماغدا ی هوحن ،دیدج تلایهست ثادحا ،ینابیتشپ زکارم رد دادما ف تلا
نچمه و لاع نی
س میمصت اضاقت طاقن و )عیزوت زکارم( نابیتشپ زکارم ،ناگدننک نیمات حوطس نایم دادما نایرج هوحن گ یزا
دم رد .ددر ل
هکبش یاه کنیل ،اهاضاقت و هلزلز یاه یناریو یارب ویرانس تخرد کی ی هظحلام رب هولاع ،یداهنشیپ ن
حت زی ریثات ت
یرانس تخرد رد نارحب یاهدادخر تدش رگ رظن رد یوحن هب اه کنیل بیرخت ،نیاربانب .دنریگ یم رارق و
ش هتف هک دنا هد
ظنم هب .دش دنهاوخ رتمک تمواقم اب اه کنیل نیرت کیدزن هدش هتسب هب رجنم ناریو و بارخ یاه کنیل لح رو
کی ،لدم
اهاضاقت و بیرخت یاهویرانس اب هلئسم ود رب یفداصت یا هلحرم دنچ یزیر همانرب درکیور امعا یعقاو ی
رگ ل .تسا هدید
.دهد یم ناشندوجوم یدنب هرکیپ اب سایق رد یداهنشیپ ددجم یدنب هرکیپ رد ار سوسحم یرترب ،جیاتن ه
نینچم دوبهب
ق یسررب دروم زین یتنس یاه شور زا یکی لباقم رد یا هلحرم دنچ یفداصت یزیر همانرب شور یریگراکب گ رار
تسا هتفر
.
![Figure 1 derived from literature [3]).](https://thumb-us.123doks.com/thumbv2/123dok_us/28930.2003332/2.595.116.219.622.719/figure-derived-from-literature.webp)