DOI: 10.2478/10004-1254-64-2013-2346 Scientifi c paper
INDOOR PM
1, PM
2.5, PM
10AND OUTDOOR PM
2.5CONCENTRATIONS IN PRIMARY SCHOOLS IN SARI,
IRAN
Mahmoud MOHAMMADYAN1 and Bijan SHABANKHANI2
Health Sciences Research Center1, Faculty of Health2, Mazandaran University of Medical Sciences, Sari, Iran
Received in January 2013 CrossChecked in April 2013
Accepted in July 2013
This study was carried out to determine the distribution of particles in classrooms in primary schools located in the centre of the city of Sari, Iran and identify the relationship between indoor classroom particle levels and outdoor PM2.5 concentrations. Outdoor PM2.5 and indoor PM1, PM2.5, and PM10 were monitored using a real-time Micro Dust Pro monitor and a GRIMM monitor, respectively. Both monitors were calibrated by gravimetric method using fi lters. The Kolmogorov-Smirnov test showed that all indoor and outdoor data fi tted normal distribution. Mean indoor PM1,PM2.5, PM10 and outdoor PM2.5 concentrations for all of the classrooms were 17.6 μg m-3, 46.6 μg m-3, 400.9 μg m-3, and 36.9 μg m-3, respectively. The highest levels of indoor and outdoor PM2.5 concentrations were measured at the Shahed Boys School (69.1 μg m-3 and 115.8 μg m-3, respectively). The Kazemi school had the lowest levels of indoor and outdoor PM2.5 (29.1 μg m-3 and 15.5 μg m-3, respectively). In schools located near both main and small roads, the association between indoor fi ne particle (PM2.5 and PM1) and outdoor PM2.5 levels was stronger than that between indoor PM10 and outdoor PM2.5 levels. Mean indoor PM2.5 and PM10 and outdoor PM2.5 were higher than the standards for PM2.5 and PM10, and there was a good correlation between indoor and outdoor fi ne particle concentrations.
KEY WORDS:indoor particle concentrations, outdoor particle concentrations
Recent epidemiological studies have documented an association between changes in ambient particulate matter (PM) concentrations and changes in daily mortality and morbidity (1-3). Furthermore, air quality at schools seems to be a major determinant of health outcomes (4). Most of these studies have emphasised the importance of particulate matter with aerodynamic
diameter of less than 10 μm (PM10) and, recently,
2.5 μm (PM2.5), measured at fi xed monitoring sites. It
seems that traffi c-related particles are more toxic than others. Peters et al. (5) have reported that the risk of exposure to black carbon (BC) as a surrogate of traffi c particles is higher than to other ambient particulates (5). Schwarz et al. (6) have also reported a stronger
association of BC than of PM2.5 with changes in heart
rate. In a multi-city study, Dominci et al. (7) have
shown that the association between PM10 concentrations
and increased risk of death generally remains unchanged after control for other air pollutants.
good correlation between personal exposure and indoor air particle concentrations.
The aim of this study was to address this issue by
determining the distribution of PM1, PM2.5, and PM10
in the classrooms of primary schools located in the centre of the city of Sari and by identifying the
relationship between indoor and outdoor PM2.5
concentrations.
Sari is the capital of the Iranian province of Mazandaran, located some 30 km to the south of the Caspian Sea and stretching from the northern slopes of the Elburz Mountains to across the Tajan River. It has a population of 270,000 people residing in the town and about as many residing in the suburbs. Our earlier reports have shown that personal exposure to
PM10 among taxi and bus drivers and to PM2.5 in shops
in the city centre area are higher than the standards recommended by the US Environmental Protection Agency (EPA) (20-22).
MATERIALS AND METHODS
Our indoor and outdoor monitoring involved primary schools located in the centre of Sari with four major roads of varying traffi c density. In Enghlab Street (south) it is about 1,500 vehicles per hour, in 18-Day Street (east) 2,220, in Jomhori Street (west) 1,260, and in Modarres Street (south) 1,250. Khosravi School is located in Enghlab Street; Shahed Boy and Shahed Girl Schools are located on Modarres Street; Kazemi School, Ghaemi School, and Ameneh School are located on three smaller roads less than 100 m away from Jomhori Street. School buildings are about 10 to 40 years old. Classrooms - all accommodating between 27 and 32 pupils - have a similar design, and
their area varies from 24 m2 to 34.2 m2. Floors are
stone. No mechanical ventilation or air conditionings were in use during the monitoring period. However, all classrooms were heated by radiators in the cold months.
Over 26 days of a school year (spanning from
November 2011 to June 2012), we monitored PM1,
PM2.5, and PM10 concentrations indoors and PM2.5
concentrations outdoors. Both indoor and outdoor monitoring started and ended with the classes (from 8:00 a.m. to around 12:30 p.m.). Average indoor monitoring time was 4.39 h (range 2.95 h to 4.7 h), depending on the duration of a particular class. The indoor dust monitor was placed in the centre of the classroom, about 80 cm above the floor, and the
outdoor monitor in the school yard at least one metre away from any obstacle and one metre above ground.
For indoor measurements we used a GRIMM real-time aerosol spectrometer and dust monitor (Model 1.108, Grimm Aerosol Technik GmbH, Ainring,
Germany). PM1, PM2.5 and PM10 concentrations were
recorded at one-minute intervals. This dust aerosol spectrometer has been designed for continuous particle count and for calculating particle mass based on particle density. It has an integrated gravimetric fi lter that collects all particles after optical measurement for further analysis. Data can be displayed as particle concentration and as mass concentration. Sample air is sucked through a measuring cell and a gravimetric fi lter by an internal fl ow-control pump. The fi lter serves as a dust collector and as gravimetric control of optical measurements.
For outdoor measurements we used a MicroDust Pro real-time monitor (Casella, Bedford, UK). This instrument is calibrated to a known reference dust standard. Different dust types cause a different response from this instrument due to variation in particle size, refractive indices, particle density, and colour. In order to correct for this, it is necessary to calibrate the response of the instrument. This involves the collection of a gravimetric (fi ltered) sample of the dust after it has passed through the probe optics. To
measure PM2.5 concentrations, a size-selective
sampling cyclone was used in combination with a particle size adaptor and a small polyurethane foam
(PUF) fi lter that was designed for PM2.5 size fraction
monitoring. A small personal sampling pump was used to provide continuous air fl ow through the gravimetric adaptor and photo detector. For gravimetric calibration, particles were then collected on a 37 mm, 2.0 μm Tefl on fi lter (SKC Inc., Dorset, UK), which was placed in the cassette behind air sample stream. To obtain
mean PM2.5 concentrations we divided particle mass
(in μg), obtained by weighing the fi lter, with the volume of sampled air drawn through the instrument
(in m3). For calibration we compared mean PM
2.5
concentration with the average PM2.5 concentration
obtained from direct reading from the MicroDust Pro instrument.
The GRIMM monitor was run on the particle concentration mode to measure particles between 0.3 μm and 20 μm, and the MicroDust monitor was
run to measure PM2.5. Filters were desiccated for 24 h
and weighed with a microbalance (resolution 1 μg) three times before and after sampling. Total dust weight on fi lters was divided with the calculated total volume of air sucked by pumps to determine mean gravimetric concentrations of particles. Running both instruments side by side provided information on actual average gravimetric concentrations, which were then divided by mean particle concentrations downloaded from respective instruments to obtain gravimetric calibration factors. Finally, all real-time data were multiplied by calibration factors obtained for either instrument to obtain actual particle concentrations. In total, we collected data for 7,115 one-minute indoor and outdoor particle concentration readings. Mean correction factors of 1.03 and 1.14 were applied for the GRIMM and the MicroDust Pro monitor data, respectively. One-minute data were used for statistical analysis.
Statistical analysis
The statistic package SPSS v.17 for windows was used for running the Kolmogorov- Smirnov test (K-S test) to assess the normality of the frequency distributions of PM1, PM2.5, and PM10 concentrations. This statistic package also was used for running descriptive statistics and univariate regression model
to assess the association between outdoor PM2.5
concentrations and indoor classroom PM10, PM2.5, and
PM1. The Microsoft Offi ce EXCEL 2007 software was
used to make a graph for demonstration of daily mean
indoor PM10 and PM2.5 concentrations.
RESULTS AND DISCUSSION
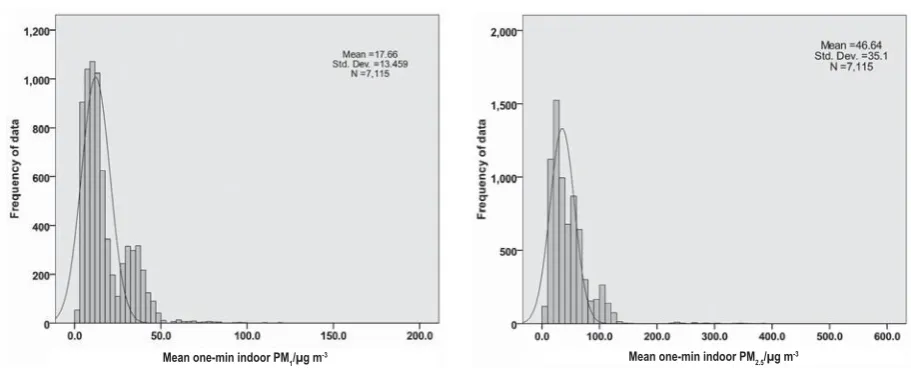
The Kolmogorov-Smirnov (K-S) test shows that all indoor particle concentration data fit normal
distribution (Figures 1-3). The indoor classroom PM2.5
concentrations show distributions that are bi-modal, suggesting that there may be outliers within the indoor
classroom PM2.5 data. Resuspension of fi ne particles
as a result of student activities may explain transient high indoor classroom particle concentrations. Mean
indoor PM1,PM2.5, PM10, and outdoor PM2.5
concentrations were 17.6 μg m-3, 46.6 μg m-3,
400.9 μg m-3, and 36.9 μg m-3 respectively. Figure 4
shows daily mean indoor classroom PM2.5 and PM10
levels. On some days, mean PM2.5 and PM10 exceeded
the respective US EPA standards of 35 μg m-3 and
150 μg m-3 (23). High concentrations of PM
10 could be due to resuspension of chalk dust, skin fl aks, and insect dander that can increase the particle concentration when the students are active. In Tehran, Halek et al.
(17) reported mean indoor classroom PM1, PM2.5, and
PM10 of 19 μg m-3, 42 μg m-3, and 274 μg m-3,
respectively. Mean PM2.5 and PM10 concentrations
were lower than in our study (46.6 μg m-3 and
400.9 μg m-3, respectively), whereas mean indoor PM
1
concentration and mean outdoor PM2.5 in our study
were similar with those reported by in Tehran
(17.6 μg m-3 and 36.9 μg m-3 vs. 19 μg m-3 and
38 μg m-3, respectively). In Munich, Germany,
Figure 1 Distribution of indoor classroom PM1 concentrations
Figure 2 Distribution of indoor classroom PM2.5 concentrations
Mean one-min indoor PM1/μg m
-3 Mean one-min indoor PM
2.5/μg m
Figure 4 Mean indoor classroom PM2.5 and PM10 concentrations
Figure 3 Distribution of indoor classroom PM10 concentrations
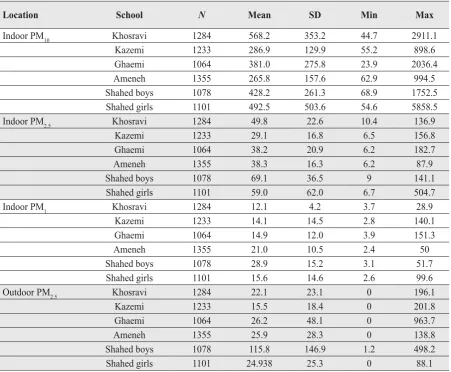
Table 1 Outdoor PM2.5 and indoor classroomPM10, PM2.5, and PM1 concentrations by school
Location School N Mean SD Min Max
Indoor PM10 Khosravi 1284 568.2 353.2 44.7 2911.1
Kazemi 1233 286.9 129.9 55.2 898.6
Ghaemi 1064 381.0 275.8 23.9 2036.4
Ameneh 1355 265.8 157.6 62.9 994.5
Shahed boys 1078 428.2 261.3 68.9 1752.5
Shahed girls 1101 492.5 503.6 54.6 5858.5
Indoor PM2.5 Khosravi 1284 49.8 22.6 10.4 136.9
Kazemi 1233 29.1 16.8 6.5 156.8
Ghaemi 1064 38.2 20.9 6.2 182.7
Ameneh 1355 38.3 16.3 6.2 87.9
Shahed boys 1078 69.1 36.5 9 141.1
Shahed girls 1101 59.0 62.0 6.7 504.7
Indoor PM1 Khosravi 1284 12.1 4.2 3.7 28.9
Kazemi 1233 14.1 14.5 2.8 140.1
Ghaemi 1064 14.9 12.0 3.9 151.3
Ameneh 1355 21.0 10.5 2.4 50
Shahed boys 1078 28.9 15.2 3.1 51.7
Shahed girls 1101 15.6 14.6 2.6 99.6
Outdoor PM2.5 Khosravi 1284 22.1 23.1 0 196.1
Kazemi 1233 15.5 18.4 0 201.8
Ghaemi 1064 26.2 48.1 0 963.7
Ameneh 1355 25.9 28.3 0 138.8
Shahed boys 1078 115.8 146.9 1.2 498.2
Shahed girls 1101 24.938 25.3 0 88.1
Fromme et al. (15) reported lower indoor and outdoor
median PM2.5 and PM10 than we have, but our fi ndings
are lower than those reported for Athens and Istanbul (25, 26).
Table 1 shows the descriptive statistics for indoor
PM10, PM2.5, PM10 and outdoor PM2.5 in monitored
schools. Khosravi school showed the highest mean
PM10 concentration and Ameneh School the lowest.
The highest indoor and outdoor PM2.5 concentration
was recorded in Shahed Boy School (69.1 μg m-3 and
115.8 μg m-3, respectively). Kazemi School, in turn,
showed the lowest indoor and outdoor PM2.5
(29.1 μg m-3 and 15.5 μg m-3, respectively). Despite
Mean one-min indoor PM10/μg m-3
Mean conc./μg m
the highest average PM10, Khosravi School also had
the lowest mean PM1 concentration (12.1 μg m-3).
We established a signifi cant correlation between
indoor classroom PM1, PM2.5, and PM10 concentrations
and outdoor PM2.5 concentrations for both schools
located near main and small roads. However, Shahed boys school, which located on a main road, showed
the highest mean indoor and outdoor PM2.5 levels and
Kazemi school located on a small road had a lowest
mean indoor and outdoor PM2.5. Mean indoor PM10
and PM2.5 concentrations in schools located on the
main roads were signifi cantly higher than in schools
on small roads (486.3 μg m-3 and 49.2 μg m-3 vs.
320.7 μg m-3 and 44.3 μg m-3,respectively). However,
mean indoor PM1 concentration was higher in schools
on small roads than in schools on the main roads
(21.0 μg m-3 vs. 14.0 μg m-3 respectively). One
possible explanation is that PM1 and PM2.5, which were
mainly emitted from combustion sources, can distribute in the ambient easily and might be an effective factor for indoor particle concentrations. Similar studies concluded that proximity to traffi c is a major determinant of the level of student exposure (12, 27).
The association between indoor fine particle
concentrations (PM2.5 and PM1) and outdoor PM2.5
levels was stronger than between indoor PM10
concentrations and outdoor PM2.5 levels (Table 2). This
is most likely because outdoor air enters classrooms through doors and windows, which are generally left open because of a moderate climate in Sari. On the other hand, the reason for the weak correlation
between coarse PM10 indoor particles and outdoor
PM2.5 concentrations is that coarse particles are mainly
produced by indoor student activities. In contrast to
our study, in which indoor PM2.5 was higher than
outdoor PM2.5, Buonanno et al. (24) reported higher
concentrations of outdoor than indoor particles of up to 3 μm in Cassino, Italy (24).
Acknowledgment
We wish to thank all primary school managers and teachers for their cooperation in the study. Our thanks
also goes to Mazandaran University of Medical Sciences for fi nancial support.
REFERENCES
1. Dockery DW, Pope CA III. Acute respiratory effects of particulate air pollution. Annu Rev Public Health 1994;15:107-32. doi: 10.1146/annurev.pu.15.050194.000543
2. Seaton A, MacNee W, Donaldson K, Godden D. Particulate air pollution and acute health effects. Lancet 1995;345:176-8. doi: 10.1016/S0140-6736(95)90173-6
3. Wallace LA. Correlations of personal exposure to particles with outdoor air measurements: a review of recent studies. A e r o s o l S c i Te c h n o l 2 0 0 0 ; 3 2 : 1 5 - 2 5 . d o i : 10.1080/027868200303894
4. Mejia JF, Choy SL, Mengersen K, Morawska L. Methodology for assessing exposure and impacts of air pollutants in school children: Data collection, analysis and health effects – A literature review. Atmos Environ 2011;45:813-23. doi: 10.1016/j.atmosenv.2010.11.009
5. Peters A, Dockery DW, Muller JE, Mittleman MA. Increased particulate air pollution and the triggering of myocardial infarction. Circulation 2001;103:2810-5. doi: 10.1161/01. CIR.103.23.2810
6. Schwartz J, Litonjua A, Suh H, Verrier M, Zanobetti A, Syring M, Nearing B, Verrier R, Stone P, MacCallum G, Speizer FE, Gold DR. Traffi c related pollution and heart rate variability in a panel of elderly subjects. Thorax 2005;60:455-61. doi: 10.1136/thx.2004.024836
7. Dominici F, McDermott A, Daniels M, Zeger SL, Samet JM. Revised analyses of the National Morbidity, Mortality, and Air Pollution Study: mortality among residents of 90 cities. J Toxicol Environ Health A 2005;68:1071-92. doi: 10.1080 /15287390590935932
8. Mohammadyan M, Ashmore MR. Personal exposure and indoor PM2.5 concentrations in an urban population. Indoor B u i l t E n v i r o n 2 0 0 5 ; 1 4 : 3 1 3 - 2 0 . d o i : 10.1177/1420326X05054293
9. Wallace LA. Indoor particles: a review. J Air Waste Manag Assoc 1996;46:98-126. PMID: 8846246
10. Spengler JD, Sexton K. Indoor air pollution: a public health perspective. Science 1983;221:9-17. doi: 10.1126/ science.6857273
11. Klepeis NE, Nelson WC, Ott WR, Robinson JP, Tsang AM, Switzer P, Behar JV, Hern SC, Engelmann WH. The National Human Activity Pattern Survey (NHAPS): a resource for assessing exposure to environmental pollutants. J Exposure Anal Environ Epidemiol 2001;11:231-52. PMID: 11477521
Table 2 Relationship between outdoor PM2.5 and indoor classroom PM10, PM2.5, and PM1 levels in schools located close to main or small roads.
PM School location
Indoor PM10 Indoor PM2.5 Indoor PM1
R Sig R Sig. R Sig.
Outdoor PM2.5 Main roads 0.09 0.00 0.35 0.00 0.51 0.00
12. Janssen NAH, van Vliet PHN, Aaarts F, Harssema H, Brunekreef B. Assessment of exposure to traffi c related air pollution of children attending schools near motorways. Atmos Environ 2001;35:3875-84. doi: 10.1016/S1352-2310(01)00144-3
13. Link B, Gabrio T, Zöllner I, Schwenk M, Siegel D, Schultz E, Scharring S, Borm P. [Programm Lebensgrundlage Umwelt und ihre Sicherung (BWPLUS) Forschungsbericht FZKA-BWPLUS, Feinstaubbelastungen und deren gesundheitliche Wirkungen bei Kindern, in German] 2004 [displayed 10 Juni 2013]. Available at http://www. fachdokumente.lubw.baden-wuerttemberg.de/servlet/ is/40191/BWB21007SBer.pdf?command=downloadConten t&fi lename=BWB21007SBer.pdf
14. Son BS, Song MR, Yang WH. A Study on PM10 and VOCs concentrations of indoor environment in school and recognition of indoor air quality. In: from 10th International Conference on Indoor Air Quality and Climate; 4-9 Sep 2005. Beijing, China. Beijing: Tshinghua University Press; 2005. p. 827-32.
15. Fromme H, Dietrich S, Twardella D, Heitmann D, Schierl R, Liebl B, Rüden H. Particulate matter in the indoor air of classrooms - exploratory results from Munich and surrounding. Atmos Environ 2007;41:854-66. doi: 10.1016/j. atmosenv.2006.08.053
16. Stranger M, Potgieter-Vermaak SS, Van Grieken R. Comparative overview of indoor air quality in Antwerp, Belgium. Environ Int 2007;33:789-97. doi: 10.1016/j. envint.2007.02.014
17. Halek F, Kianpour-rad M, Kavousirahim A. Parametric evaluation of indoor particulate matter in elementary schools in the central parts of Tehran. Indoor Built Environ 2013; 22:580-585. doi: 10.1177/1420326X11433224
18. Koistinen JK, Otto H, Tuulia R, Edwards RD, Moschandreas D, Jantunen MJ. Behavioural and Environmental determinants of personal exposure to PM2.5 in EXPOLIS – Helsinki
Finland. Atmos Environ 2001; 35:2473-2481. Doi:10.1177/ 1420326X11421510
19. Adgate JL, Ramachandran G, Pratt GC, Waller LA, Sexton K. Longitudinal variability in outdoor, indoor and personal PM2.5 exposure in healthy non smoking adults. Atmos Environ 2003; 37:993-1002. Doi:10.1177/1420326X11421510 20. Mohammadyan M, Alizadeh A, Mohammadpour RA.
Personal exposure to PM10 among bus drivers in Sari, Iran. I n d o o r B u i l t E n v i r o n 2 0 0 9 ; 1 8 : 8 3 - 9 . d o i : 10.1177/1420326X08101530
21. Mohammadyan M, Alizadeh A, Etemadinejad S. Personal exposure to PM10 among taxi drivers in Iran. Indoor Built Environ 2010;19:538-45. doi: 10.1177/1420326X10378802 22. Mohammadyan M, Sojodi L, Etemadinejad S. Survey of
concentrations of PM2.5 indoor and outdoor of shops in Sari city center. J Mazand Univ Med Sci 2011;21:72-9. 23. U.S. Environmental Protection Agency (US EPA). National
Ambient Air Quality Standards (NAAQS) [displayed 20 Sep 2012]. Available at http://www.epa.gov/air/criteria.html 24. Buonanno G, Fuoco FC, Morawska L, Stabile L. Airborne
particle concentrations at school measured at different spatial scale. Atmos Environ 2013;67:38-45. doi: 10.1016/j. atmosenv.2012.10.048
25. Diapouli E, Chaloulakou A, Mihalopoulos N, Spyrellis N. Indoor and outdoor PM mass and number concentrations at schools in the Athens area. Environ Monit Assess 2008;136:13-20. doi: 10.1007/s10661-007-9724-0
26. Ekmekcioglu D, Keskin SS. Characterization of indoor air particulate matter in selected elementary schools in Istanbul, Turkey. Indoor Built Environ 2007;16:169-76. doi: 10.1177/1420326X07076777
Sažetak
KONCENTRACIJE LEBDEĆIH ČESTICA PM1, PM2.5, PM10 U ZATVORENOM PROSTORU TE KONCENTRACIJE PM2,5 ČESTICA U OTVORENOM PROSTORU OSNOVNIH ŠKOLA U GRADU SARIJU U IRANU
Svrha je ovog istraživanja bila utvrditi raspodjelu lebdećih čestica u osnovnim školama u središtu iranskoga grada Sarija te vidjeti jesu li razine lebdećih čestica mjerenih u dvorištima škola i u učionicama međusobno povezane. Vani su mjerene PM2,5 čestice pomoću stalnog Micro Dust Pro monitora, a unutra PM1, PM2,5 i PM10 čestice pomoću GRIMM monitora. Oba su instrumenta kalibrirana gravimetrijskom metodom pomoću fi ltara. Kolmogorov-Smirnovljev test pokazao je normalnu raspodjelu vanjskih mjerenja. Srednje razine unutrašnjih čestica PM1,PM2,5, PM10, odnosno vanjskih PM2,5 čestica, za sve su škole iznosile 17,6 μg m-3, 46,6 μg m-3, 400,9 μg m-3, odnosno 36,9 μg m-3. Najviše razine unutrašnjih i vanjskih PM
2,5 čestica zabilježene u školi Shahed za dječake (69,1 μg m-3 i 115,8 μg m-3), a najniže u školi Kazemi (29,1 μg m-3 i 15,5 μg m-3). Bez obzira na to jesu li škole bile smještene na glavnim ili sporednim ulicama, povezanost između razina unutrašnjih sitnih čestica (PM2,5 i PM1) i razina PM2,5 vanjskih čestica bila je snažnija nego između razina PM10 čestica izmjerenih unutra i PM2,5 čestica izmjerenih vani. Srednje razine PM2,5 i PM10 čestica u učionicama te PM2,5 čestica u dvorištima škola bile su više od standarda, a razine sitnih čestica u zatvorenom i na otvorenom dobro su kolerirale.
KLJUČNE RIJEČI:unutrašnje čestice, vanjske čestice
CORRESPONDING AUTHOR:
Mahmoud Mohammadyan
Khazar Abad Road, Mazandarn University Campus Sari, Iran