https://doi.org/10.5194/wes-4-1-2019
© Author(s) 2019. This work is distributed under the Creative Commons Attribution 4.0 License.
Aerodynamic characterization of a soft kite by
in situ flow measurement
Johannes Oehler and Roland Schmehl
Faculty of Aerospace Engineering, Delft University of Technology, 2629 HS Delft, the Netherlands
Correspondence:Roland Schmehl ([email protected])
Received: 15 June 2018 – Discussion started: 18 July 2018
Revised: 8 November 2018 – Accepted: 14 December 2018 – Published: 8 January 2019
Abstract. Wind tunnel testing of large deformable soft kites for wind energy conversion is expensive and in many cases practically not feasible. Computational simulation of the coupled fluid–structure interaction prob-lem is scientifically challenging and of limited practical use for aerodynamic characterization. In this paper we present a novel experimental method for aerodynamic characterization of flexible membrane kites by in situ measurement of the relative flow, while performing complex flight maneuvers. We find that the measured aero-dynamic coefficients agree well with the values that are currently used for flight simulation of soft kites. For flight operation in crosswind maneuvers during which the traction force is kept constant, the angle of attack is inversely related to the relative flow velocity. For entire pumping cycles, the measurements show considerable variations in the aerodynamic coefficients, while the angle of attack of the kite varies only in a narrow range. This finding questions the commonly used representation of aerodynamic coefficients as sole functions of the angle of attack and stresses the importance of aeroelastic deformation for this type of wing. Considering the effect of the power setting (identical to the trim) solely as a rigid-body pitch rotation does not adequately describe the aero-structural behavior of the kite. We show that the aerodynamic coefficients vary as functions of the power setting (trim) of the kite, the steering commands and the flight direction.
1 Introduction
Airborne wind energy is the conversion of wind energy into electrical or mechanical power by means of flying de-vices. Some of the pursued concepts use tethered airplanes or gliders, while others use flexible membrane wings that are derived from surf kites or parafoils (Diehl et al., 2017). The present paper focuses on an airborne wind energy sys-tem (AWES) with an inflatable membrane wing that is con-trolled by a suspended cable robot (van der Vlugt et al., 2013, 2019). Compared to rigid-wing aircraft, the aerodynamics of tethered membrane wings are not so well understood and kite development still relies heavily on subjective personal expe-rience and trial and error processes (Breukels, 2011; Dunker, 2013). One reason for this is the aeroelastic two-way cou-pling of wing deformation and airflow, which can cause com-plex multi-scale phenomena. Another reason is a lack of ac-curate quantitative measurement data to support the design
process. Soft kites such as leading edge inflatable (LEI) tube kites are highly flexible and have no rigid structure to mount sensors for precise quantification of the relative flow in the vicinity of the wing. This is why many experiments rely on ground-based force measurements and position tracking of the kite. In these experiments the environmental wind veloc-ity introduces substantial uncertainties (Python, 2017; Hum-mel et al., 2018).
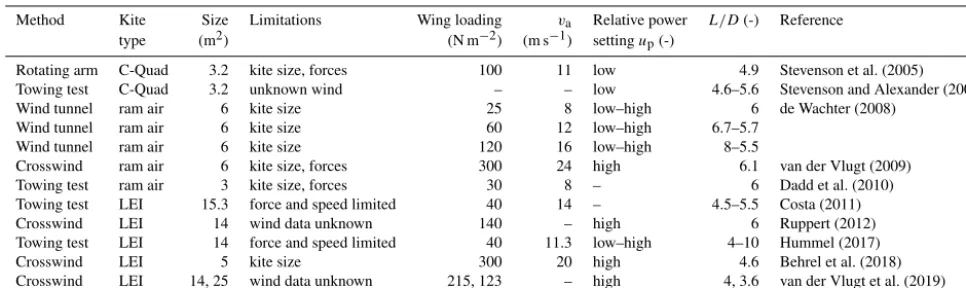
Table 1.Experimental methods for determining the lift-to-drag ratio of soft kites. Size refers here to total wing surface area.
Method Kite Size Limitations Wing loading va Relative power L/D(-) Reference
type (m2) (N m−2) (m s−1) settingup(-)
Rotating arm C-Quad 3.2 kite size, forces 100 11 low 4.9 Stevenson et al. (2005) Towing test C-Quad 3.2 unknown wind – – low 4.6–5.6 Stevenson and Alexander (2006) Wind tunnel ram air 6 kite size 25 8 low–high 6 de Wachter (2008)
Wind tunnel ram air 6 kite size 60 12 low–high 6.7–5.7 Wind tunnel ram air 6 kite size 120 16 low–high 8–5.5
Crosswind ram air 6 kite size, forces 300 24 high 6.1 van der Vlugt (2009) Towing test ram air 3 kite size, forces 30 8 – 6 Dadd et al. (2010) Towing test LEI 15.3 force and speed limited 40 14 – 4.5–5.5 Costa (2011) Crosswind LEI 14 wind data unknown 140 – high 6 Ruppert (2012) Towing test LEI 14 force and speed limited 40 11.3 low–high 4–10 Hummel (2017) Crosswind LEI 5 kite size 300 20 high 4.6 Behrel et al. (2018) Crosswind LEI 14, 25 wind data unknown 215, 123 – high 4, 3.6 van der Vlugt et al. (2019)
Center (Geiger and Wailes, 1990), while a 25 % model of the FASTWing parachute was tested in the European DNW-LLF wind tunnel (Willemsen et al., 2005). A first full-scale experiment to determine the shape of a kite in controlled flow conditions was performed by de Wachter (2008). Us-ing photogrammetry as well as laser light scannUs-ing the three-dimensional surface geometry of a small ram-air surf kite was measured in two larger wind tunnels. This geometry was used as a boundary condition for computational fluid dy-namic (CFD) analysis of the exterior flow. The results show a substantial deformation of the membrane wing by the aero-dynamic loading. Due to the difficulty of scaling, these re-sults cannot be transferred to larger kites that fly at higher speeds for the purpose of wind energy conversion.
In general, the numerical simulation of strongly coupled fluid–structure interaction (FSI) problems is computation-ally expensive. If the flow is fully attached, standard panel methods with viscous boundary layer models can be used for efficient calculation of the aerodynamic load distribution. While this approach works, for example, for ram-air wings at a lower angle of attack, it is not feasible for LEI tube kites because of the inevitable flow separation region behind the leading edge tube. Breukels (2011) and Bosch et al. (2014) develop multibody and finite-element models of LEI tube kites and use an empirical correlation framework to describe the aerodynamic load distribution on the membrane wing as a function of shape parameters. Bungart (2009) performs CFD analysis using the deformed shape of the kite measured by de Wachter (2008); however, these results cannot be extrapo-lated to different kites. We conclude that without accounting for the aeroelasticity of the membrane wing an accurate aero-dynamic characterization does not seem feasible. We further conclude that presently experiments seem to be the most vi-able option to determine the global aerodynamic characteris-tics of a kite.
In Table 1 we list experiments described in the literature to determine the lift-to-drag ratio of kites.
The relative flow velocity at the wing is denoted asvaand
the power settingupdescribes the symmetric actuation of the
rear suspension lines of the kite. A high value ofupmeans
that the wing is powered, while a low value ofupmeans that
the wing is depowered (see Eq. 6). The variety of methods, test conditions and kites as well as generated results makes it difficult to derive a clear trend. Hobbs (1990) conducted a performance study of different single-line kite designs used for wind anemometry. A first quantitative aerodynamic as-sessment method for power kites was presented by Stevenson (2003), Stevenson et al. (2005), and Stevenson and Alexan-der (2006). The test procedure involves flying kites on a cir-cular trajectory indoors as well as outdoor towing tests.
A similar manual test procedure for determining the lift-to-drag ratio of a surf kite was proposed by van der Vlugt (2009). The kite is flown in horizontal crosswind sweeps just above the ground, measuring the achievable maximum cross-wind flight speedvk,τ of the kite at a downwind position to-gether with the wind speedvw. Assuming that the measured
wind speed is identical to the wind speed at the kite, the lift-to-drag ratio can be calculated from Schmehl et al. (2013):
vk,τ= L
Dvw. (1)
The method can be generalized to characterize the aerody-namics of kites flying complex maneuvers by either measur-ing or estimatmeasur-ing the unperturbed relative flow velocityvain
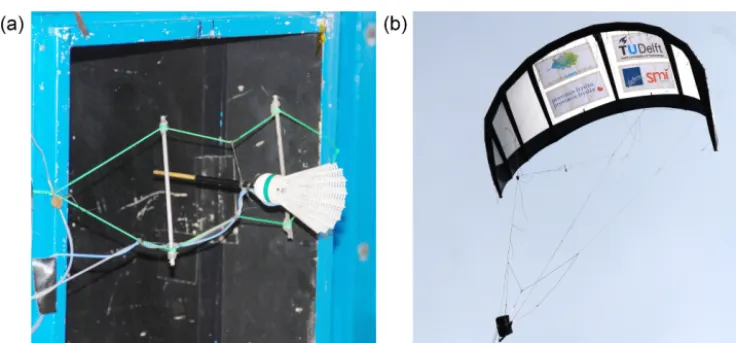
the vicinity of the wing. Figure 1 shows a self-aligning Pitot tube setup mounted in the bridle line system between the kite and its control unit.
Figure 1.Pitot tube during calibration in the wind tunnel (a) and suspended in the bridle line system of a remote-controlled 25 m2LEI V2 kite during a flight test (b).
Together with data from other onboard sensors, this has been used to feed an extended Kalman filter to get an optimal es-timate of the aerodynamic force and torque generated by the kite as well as the relative flow velocity vector and other kite state variables.
Dadd et al. (2010) and Costa (2011) used towing test se-tups to generate a variable relative flow at the wing. Operat-ing on days with calm wind allows for measurements at well-defined relative flow conditions. Hummel et al. (2018) devel-oped a similar trailer-mounted towing test setup to measure the lift-to-drag ratio and aerodynamic coefficients of surf kites. The test procedure includes active depowering, which in general aerospace engineering terminology is denoted as a change in the trim of the wing and measuring line angles at the test rig. For future experiments, Hummel et al. (2018) recommends the use of an airborne flow sensor to avoid the uncertainties caused by the wind environment and by the sagging of the tether. Behrel et al. (2018) describe a setup to measure the aerodynamic performance of kites for ship traction applications. Using a three-dimensional load cell to record the traction force vector and a wind profiler to deter-mine the wind velocity at the kite, the technique is applied to determine the lift-to-drag ratio of kites during crosswind maneuvers.
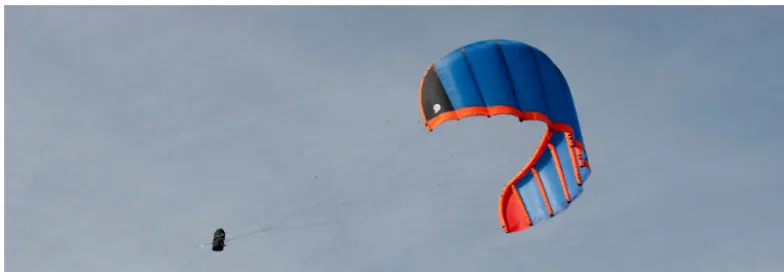
The companies Kitepower B.V. (Kitepower B.V., 2018a), a startup of Delft University of Technology, Kite Power Sys-tems (KPS) (Kite Power SysSys-tems, 2018) and Skysails Power (Skysails Power, 2018) (Weston, 2018) are currently devel-oping and testing AWES with soft kites that are operated on a single tether and controlled by a suspended cable robot. These prototypes have reached considerable sizes (see, for example, Fig. 2) and for this reason the use of measurement data acquired during flight operation is the only viable option for characterizing the aerodynamics of the complete airborne system.
None of the other experimental setups presented in Table 1 allow us to execute dynamic flight maneuvers and handle kites with a wingspan of 10 m or larger at flight speeds above 20 m s−1while withstanding tensile forces of several kN or more. It is the objective of the present study to develop an ex-perimental method for aerodynamic characterization of large deformable membrane kites that are used for energy conver-sion. At the core of this method is a novel setup for the ac-curate measurement of the relative flow conditions at the kite during energy generation in pumping cycles. Since the setup is additional equipment for tests of a commercial prototype the mounting of the setup has to consume as little time as possible.
The paper is organized as follows. In Sect. 2 we describe the airborne components of the kite power system, the mea-surement setup and the data acquisition procedure. In Sect. 3 we describe how the power setting is related to the angle of attack of the wing and how the aerodynamic properties are derived from the measured data. In Sect. 4 the results are presented and discussed.
2 System description and data acquisition
The experimental study is based on the AWES prototype de-veloped and operated by the company Kitepower as a test platform within the EU Horizon 2020 “Fast Track to Inno-vation” project REACH (European Commission, 2015). The prototype can be classified as a ground-generation AWES op-erating a remote-controlled soft kite on a single tether. This general setup is illustrated schematically in Fig. 3c.
Figure 2.LEI V5.40 kite with 40 m2wing surface area controlled by a suspended cable robot. This prototype temporarily reached a tether force of 15 kN and a mechanical power of 100 kW during a test flight in May 2018 (Kitepower B.V., 2018b).
Figure 3.Basic components of the kite power system (c) and wing with suspended control unit, together denoted as the kite (b); measurement frame attached to the power lines (a). Sensor positions: tether forceFtand tether reel-out speedvtare recorded at the ground station (1), GPS and IMU modules are mounted on the center strut of the kite (2), and the kite control unit (3) actuates the wing for steering and changing its power state, also measuring the instantaneous lengths of steering and depower tapes; the relative flow sensors for inflow anglesαm,βsand apparent wind speedvaare mounted on a rigid frame (4) that is attached to the two power lines connecting to the inflatable leading edge tube of the wing. The depicted velocityv∗ais the component of the apparent wind velocityvaprojected into the drawing plane.
flight patterns with alternating traction and retraction phases. During the traction phase the kite performs crosswind ma-neuvers, such as figure-eight or circular flight patterns, while the tether is reeled off a drum that is connected to a generator. In this phase the AWES generates electricity. For the subse-quent retraction phase the crosswind maneuvers are stopped and the generator is operated as a motor to reel in the tether. This phase consumes some of the generated electricity. To maximize the net gain of energy per cycle the wing is de-powered during retraction. Both steering lines are released symmetrically such that the entire wing pitches down to a lower angle of attack, which significantly reduces the aero-dynamic lift force.
Just below the KCU the main tether splits into two power lines of constant length that run along the sides of the KCU
and support the inflatable leading edge tube and also partially the strut tubes of the wing. This is depicted schematically in Fig. 3a and b and in more detail in Fig. 5a without the mea-surement setup. A short line segment connects the KCU to the end point of the main tether, while steering and depower tapes connect the KCU to the steering lines and eventually, via a fan of bridle lines, to the wing tips and trailing edge. Details on this specific layout will be described in the fol-lowing section. The KCU can actuate the two steering lines either symmetrically to power and depower the kite or asym-metrically to steer the kite.
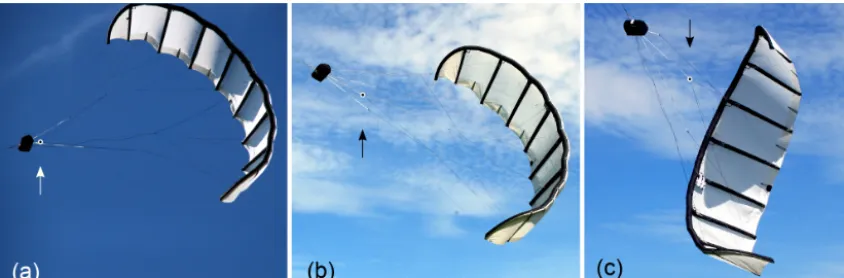
genera-Figure 4.An almost fully powered LEI V3 kite (a), a depowered kite (b) and deformation of the wing by extreme steering input in depowered state (c). Dots indicate the end of the depower tape.
tion, the two right photos are taken during a flight maneuver close to the launch mast.
The sensors on the ground station (1), the kite (2) and the KCU (3) provide data that are required for the autopilot of the kite power system (see Fig. 3). The experiments described in this paper have been performed with a LEI V3 kite with a wing surface area of 25 m2, a battery-powered KCU for 2– 3 h of continuous operation and a ground station with 20 kW of nominal traction power. These components have been de-veloped by the kite power research group of Delft Univer-sity of Technology and reflect the technology status in 2012 (van der Vlugt et al., 2013; Schmehl, 2014; Schmehl et al., 2014; van der Vlugt et al., 2019).
Because the membrane wing is continuously deforming during operation it is not as straightforward as for a rigid-wing aircraft to define the orientation of the kite relative to the flow. One option is to use the inflated center strut as a reference component to mount the flow measurement equip-ment (Borobia et al., 2018; van Reijen, 2018). Mounting the equipment directly on the suspended KCU is not considered to be an option because this relatively heavy component is deflected substantially when flying sharp turns (Fechner and Schmehl, 2018) and can also exhibit transverse vibrations. Another option is to mount the measurement equipment on the two power lines. These lines transfer the major part of the aerodynamic force from the wing to the tether and for this reason are generally well tensioned and span a plane that characterizes the orientation of the kite (wing and suspended KCU). Considering the deformation of the membrane wing by asymmetric and symmetric actuation as well as aeroelas-ticity, we consider this plane to be the most suitable reference geometry.
Figure 3a illustrates how the three relative flow sensors (4) are mounted on a rigid frame that is attached to the two power lines about 8.5 m below the wing. In Appendix A we use a simple lifting-line model of the wing to show that the assumption of free-stream conditions at this distance from the kite is justified. The Pitot tube can rotate freely around
its pitch and yaw axis to align with the relative flow, mea-suring the barometric pressure, the differential pressure and the temperature from which the apparent wind velocityva
can be calculated. The two flow vanes are used to determine the inflow anglesαmandβs, which are measured from the
normal vector of the plane spanned by the two power lines. The two angles are measured by total magnetic encoders with a resolution of 0.35◦. The data are recorded at a frequency of 20 Hz, converted to a digital signal by a Pixhawk® mi-crocomputer, transmitted to the KCU via antenna and from there to the ground station to be logged simultaneously with all other acquired sensor data. It is important to note that the relative flow sensors are add-on measurement equipment for the present study and are not essential for the operation of the kite power system. More information on the sensors and the measurement setup can be found in Oehler (2017).
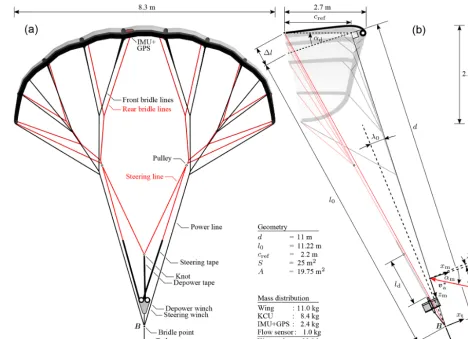
Figure 5.Front view (a) and side view (b) of the LEI V3 kite with reference frames, geometric parameters, mass distribution and definition of the reference chordcref. The total wing surface area is denoted asS, while the projected value is denoted asA. The mass of the bridle lines is part of the wing mass. The side view distinguishes between the physical (real) kite and bridle line system, displayed in the background, and the overlaid simplified geometric depower model. The explicit dimensions describe the unloaded design shape of the wing.
3 Data processing
The raw data from the rotary encoders and the pressure sen-sor can have missing data points and can also fluctuate due to variations in the supply voltage. To address these issues we apply a moving-average filter using the MATLAB®function “smooth” with a span of seven measurement points (0.3 s). This operation returns a smooth signal while still being able to capture systematic oscillations that occur at frequencies of up to 1.2 Hz (Oehler, 2017). In the following, we describe how the relative flow data are used together with the data from the other sensors to determine the aerodynamic proper-ties of the kite.
3.1 Geometry and reference frames
The geometry of the wing and the layout of the tensile sup-port system, comprising bridle lines, steering and depower lines, as well as steering and depower tapes, are illustrated in Fig. 5.
The two pulleys are attached to the two branches of the rear bridle line systems and allow the steering lines to slip freely to adjust the line geometry to the actuation state. The instantaneous length of the depower tape is denoted as ld.
Both renderings show a depowered kite, as illustrated by the photo in Fig. 4b, using the design shape (CAD geometry) of the wing and thus not accounting for additional deformation. As shown in Fig. 5b, we define two different reference frames to describe the orientation of the tether and the kite. The tether reference frame (xt, yt, zt) is attached to the kite
end of the tether with its origin at the bridle pointB where the tether splits into the two power lines. Thezt axis is
tan-gential to the tether, while thextaxis is located in the plane
spanned by the zt axis and the normal vector of the plane
spanned by the two tensioned power lines. This definition is identical to the “kite reference frame” used by Fechner et al. (2015) as a basis for a point mass model. The measurement reference frame (xm, ym, zm) is attached to the rigid frame on
of the frame, while theymaxis is aligned with the transverse
member. Because the measurement frame is attached to the two tensioned power lines thexmaxis defines the heading of
the kite. The rotation of thext axis into the xm axis is
de-scribed by the angleλ0, which is not constant and cannot be
controlled actively. The angle depends on the aerodynamic load distribution acting on the wing, the kite design and the bridle layout. The inflow anglesβsandαmare determined in
the measurement reference frame. Because the zm axis can
be regarded as the yaw axis of the kite, the inflow angleβs
is equivalent to the sideslip angle. Similarly, theymaxis can
be regarded as the pitch axis of the kite and the inflow angle αmis a measure for its pitch orientation with respect to the
relative flow.
To transformαminto a meaningful angle of attack of the
wing we define a reference chord cref, which describes the
pitch orientation of the wing within the kite system as a func-tion of the symmetric actuafunc-tion of the steering lines.
This two-dimensional, simplified geometric depower model is illustrated in Fig. 5b. For the fully powered kite, the reference chord is defined to be perpendicular to the plane spanned by the power lines. Depowering the kite is modeled as a pitching of the reference chord around the front sus-pension point, while the real wing additionally deforms by spanwise twisting and bending. The specific bridle layout of the LEI V3 kite shifts the front suspension point about 0.5 m backwards from the leading edge.
The rotation is described by the depower angleαdand by
definition the fully powered state is given byαd=0. A
refer-ence chord that is perpendicular to the power line plane is a reasonable approximation of the fully powered wing, which is designed for optimal transfer of the aerodynamic load from the membrane wing to the bridle line system. These structural requirements are generally best met if the front bridle lines, which transmit most of the forces, connect perpendicularly to the wing. It is in principle straightforward to account for a constant offset angleα0(Fechner et al., 2015); however, for
the investigated kite design this offset angle is rather small. For this reason we setα0=0.
The geometrical dimensions are extracted from the CAD geometry of the kite. The distance of the front suspension point from the bridle point isd=11.0 m. For the fully pow-ered kite, the distance to the rear suspension point from the bridle point isl0=11.22 m. The length of the reference
chord can be determined ascref=2.2 m. The kite is
depow-ered by extending the rear suspension of the wing by1l. In the following section, we relate this length extension to the deployed lengthldof the depower tape and the relative power
settingup. The angle of attack of the relative flow with
re-spect to the reference chord is calculated from the measured inflow angle and the depower angle as
α=αm−αd, (2)
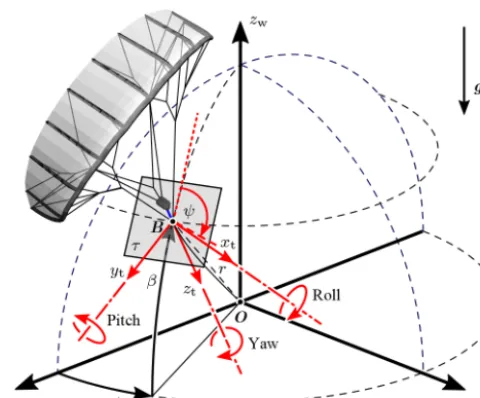
Figure 6. Ground reference frame (xw, yw, zw), tether refer-ence frame (xt, yt, zt), heading angleψ and spherical coordinates (β, φ, r). Only in the case of a straight tether does theztaxis point in the radial direction to the ground attachment pointO.
while the angle of attack of the relative flow with respect to the tether reference frame is calculated as
αt=αm+λ0. (3)
Figure 6 illustrates how the azimuth angleφ, the elevation angleβ and the radial distancerare used to specify the po-sition of the bridle pointBrelative to the ground attachment pointO.
The heading angleψspecifies the orientation of the kite in the local tangential planeτ. The angle is measured between the local upward direction (dotted line) and the projection of thextaxis onto the tangential plane. Similarly, the course
an-gleχ(not displayed) specifies the direction of the tangential kite velocityvk,τ in the local tangential plane. Combining Eqs. (2) and (3) to eliminate the measured inflow angleαm
we can differentiate three distinct contributions to the angle of attack:
α=αt−λ0−αd. (4)
The contribution of the tether angle of attackαt is due to
the flight motion of the kite, represented by the bridle point B, through the wind environment. The contribution of the line angleλ0is due to the pitch of the entire kite, represented
by the plane spanned by the power lines, with respect to the tether. The contribution of the depower angleαdis due to the
pitch of the wing with respect to the plane spanned by the power lines.
3.2 Kinematics of depowering
Fechner et al. (2015), we use the geometric depower model illustrated in Fig. 5b to calculate an analytic equation for the depower angleαdby applying the law of cosines:
cos(90◦+αd)=
d2+c2ref−(l0+1l)2
2dcref
. (5)
Considering the specific layout of the actuation system de-picted in Fig. 5a, the extension of the rear suspension of the reference chord is approximated as
1l=1
2ld= 1−up
2 ld,max, (6)
whereldis the deployed length of the depower tape with the
maximum value ld,max=1.7 m. Because we employ a
pul-ley system to decrease the required forces in the actuation system, only half of the length of the depower tape is trans-lated into lengthening or shortening the rear suspension of the reference chord. Equation (6) shows that a full depower-ing of the wdepower-ing with up=0 leads to a maximum extension
1lmax=1/2ld,max, from which a maximum depower angle
ofαd,max=24◦can be calculated on the basis of Eq. (5).
Aside from a general increase in the aerodynamic load, an increasing angle of attack also leads to a gradual back-wards shift of the load distribution toback-wards the rear of the wing. To balance this load shift, the entire kite has to pitch down around the bridle point, which increases the angleλ0.
This aerodynamic characteristic of LEI tube kites has been observed experimentally by Hummel (2017) and van Reijen (2018). Because the chordwise location of the center of pres-sure controls how the total aerodynamic load is distributed on the front and rear bridle line systems, measuring the line forces is a way to quantify the load shift. To describe how much of the total load is transferred through the front bridle lines, we define the force ratiosFt,f/Ft,randFt,f/(Ft,f+Ft,r),
whereFt,fandFt,rare the magnitudes of the resultant forces
transferred through the front and rear bridle line systems, re-spectively (see also Fig. 11).
The force ratios measured for an LEI Hydra V5 kite are illustrated in Fig. 7, indicating that the aerodynamic load gradually shifts towards the rear bridle lines for an increas-ing power settincreas-ingup. At the highest power setting the loads
transferred through the front and rear bridle line systems are about equal.
Since we did not measure the bridle line forces of the LEI V3 kite we assume a constant position of the center of pres-sure, derived as an average of several different types of kites by Hummel (2017). Measuring the bridle line force ratio for the LEI V3 kite in flight would help increase the accuracy of this study but would require additional instrumentation and is recommended for future tests.
However, it is not only the shifting center of pressure that affects the orientation of the kite with respect to the tether. Another important factor is the gravitational and in-ertial force of the KCU, which contributes almost 40 % of
Figure 7.Distribution of tensile forces in the bridle line system from low to high power setting (red, green, blue, black) measured for a commercially available LEI Hydra V5 kite with 14 m2wing surface area by Genetrix Kiteboarding (adapted from van Reijen, 2018).
the kite system mass and is suspended below at considerable distance from the wing (see Fig. 5). When the kite is flying upwards, the gravitational force pulls the suspended KCU down, increasingλ0, while when it is flying downwards, the
effect is inverted andλ0is decreased. When the kite is flying
sideways, the mass of the KCU affects the roll orientation of the kite with respect to the tether. In general, the gravitational effect of the KCU increases towards lower elevation angles and lower tension in the tether.
The competing effects of kite aerodynamics and KCU mass are illustrated in Fig. 8 for two extreme load cases.
The partially depowered kite on the left is flying statically and is thus only lightly loaded. For this reason, the rear bridle lines are sagging and the wing membrane is not taut. From the photo we can measure a depower angleαd=5.6◦ and
a line angleλ0=14.7◦. The relatively large line angle
indi-cates that the gravitational effect of the KCU mass by far out-weighs the aerodynamic effect. On the other hand, the fully powered kite on the right is flying fast crosswind maneuvers and is thus heavily loaded. As a result, the wing membrane and bridle lines are taut. In this particular test, the wing is operated without the KCU andλ0thus depends solely on the
aerodynamic load distribution on the wing. From the photo we can measure a line angleλ0=5.1◦ and can further
rec-ognize that the concept of a reference chord perpendicular to the front bridle lines is a good representation of the actual center chord of the wing.
In this work, the wing is idealized as a lifting surface with fixed geometry. The proposed geometric depower model is a simplified two-dimensional approximation of the complex three-dimensional aeroelastic response of the bridled mem-brane wing.
The photographic footage depicted in Fig. 9 illustrates how the wing shape changes when transitioning from a de-powered to de-powered state.
Figure 8.Side view of a kite partially depowered during a landing maneuver (a) and fully powered during a crosswind flight maneuver (b). The photo on the right was taken during a flight test in which the KCU was replaced by a ring that collected the joined power lines and the two steering lines and redirected them as a triplet of parallel lines to the pilot on the ground. The position of this ring is indicated by an overlaid transparent image of the KCU.
Figure 9. Depowered kite (a) and powered kite (b) from a video camera mounted on the KCU and looking into the wing. The video sequence of the entire maneuver is available from Schmehl and Oehler (2018).
from which we can make several qualitative comparisons. It is obvious that the powering of the wing tensions the entire
bridle line system such that the two pulleys (marked by cir-cles) move forward towards the leading edge. The increasing projected center chord indicates that the wing pitches into the projection plane. The slightly increasing projected span indicates that the entire wing straightens under the substan-tially increased aerodynamic loading when being powered. This effect is also described by van Reijen (2018, p. 61). The curvature (sweep) of the leading edge tube also slightly de-creases. It is clear that these effects cannot be described by a geometric model without accounting for the fluid–structure interaction problem, including membrane wing, bridle line system and steering actuation.
3.3 Determining the Lift-to-drag ratio
A common method to estimate the lift-to-drag ratio of a kite is to measure the elevation angleβof the tether with the hor-izontal during static flight (Stevenson, 2003). Disadvantages of this method are the uncertainties arising from the tether sag and the usually unknown wind conditions at the posi-tion of the kite. Stevenson (2003) introduces the tether angle of attackαt to account for all forces acting on the kite
sys-tem above the bridle point, in our case the KCU, the bridle line system and the wing. This angle, which is related to the measured inflow angle αm by Eq. (3), can thus be used to
characterize the aerodynamics of the entire kite. However, the value ofαtalso depends on the gravitational and inertial
forces acting on the kite components. These vary with the specific flight situation such as flying upwards, downwards, sideways or turning maneuvers, as outlined in the previous section.
To understand how the aerodynamic characteristics of the kite are related to the kite design and measured properties we first neglect the effect of gravity. For steady flight, the resul-tant aerodynamic forceFa is in equilibrium with the tether
forceFt. Because the flexible tether can only support a
ten-sile force but no bending moment, the two forces are tangen-tial to the tether at the bridle point, pointing in opposite direc-tions. The aerodynamic force can be further decomposed into lift and drag componentsLandD, respectively. By defini-tion, the drag force is aligned with the apparent wind velocity vectorvaand becauseFa is aligned withzt, the lift-to-drag
ratioL/Dis related to the tether angle of attackαtby
L
D =cotαt. (7)
When flying on a curved path, as, for example, during figure-eight maneuvers, the centrifugal force perpendicular to the tether needs to be balanced by an additional lateral compo-nent of the aerodynamic force vector. How this side force Fa,s in theytdirection is generated depends on the specific
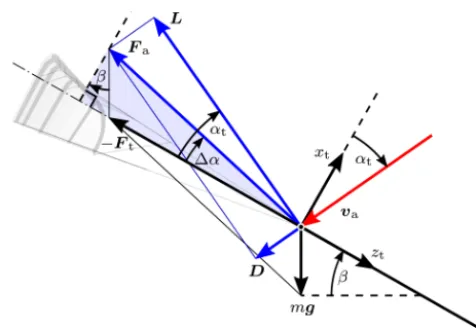
Figure 10. Force equilibrium of a kite in steady-state flight for the special case of the kite oriented upwards withψ=0◦, flying in the plane spanned by the wind velocity vector and the vertical, described byφ=0◦. The forces acting on the kite components are lumped to the bridle point. See Schmehl et al. (2013, Fig. 2.11) for an illustration of the force equilibrium extended to the general case of kite flight in three dimensions.
lift vector tilts towards the center of turn. Most flexible mem-brane wing concepts, on the other hand, yaw and twist the wing using the vertical surface of the wing tips to generate a side force and turning moment. This mechanism is depicted in Fig. 4 and described in more detail in Bosch et al. (2013, Sect. 17.3.1) and Fechner and Schmehl (2018, Sect. 15.2.2). In a similar way, the effect of gravity needs to be balanced by an additional component of the aerodynamic force vector. This is formally expressed by the force equilibrium at the bridle point for steady flight:
Fa+mg+Ft=0. (8)
However, in difference to the centrifugal acceleration during turning maneuvers, the resultant gravitational forcemgacts not only sideways but also depending on the orientation of the kite in all three directions,xt,ytandzt. To derive the
re-quired balancing components ofFawe express the resultant
gravitational force of all kite components in the tether refer-ence frame:
mg=
−cosβcosψ
cosβsinψ
sinβ
mg. (9)
This representation is based on the assumption of a straight tether such that the angle between the horizontal and the zt axis is identical to the elevation angleβ of the kite (see
Fig. 6).
The force equilibrium given by Eq. (8) is illustrated in Fig. 10 for the special case of an upwards-oriented kite (ψ=0◦).
The vector diagram shows how the gravitational force is compensated for by an upwards rotation of the aerodynamic
force by an angle1α. For arbitrary orientation of the kite, the aerodynamic force components that are required to com-pensate for the gravitational force are given by the inverse of Eq. (9). Considering the compensation in thext–zt plane
only, we can derive the following relation between tether force, gravitational force and the compensation angle1α:
tan (1α)=mgcosβcosψ
Ft+mgsinβ
, (10)
which is illustrated by the shaded right triangle in Fig. 10 for the special caseψ=0◦. Using the tether angle of attackαt
defined by Eq. (3), the lift-to-drag ratio can be determined from
L
D =cot(αt−1α). (11)
The gravitational force in theytdirection is compensated for
by a steering force
Fa,s= −mgcosβsinψ, (12)
which for the investigated type of kite is generated by a sideslip angleβs (Fechner and Schmehl, 2018). When
fly-ing figure-eight maneuvers, the angles β and ψ continu-ously vary and the gravity compensation accordingly alter-nates through thext,ytandztdirections. Neglecting this
ef-fect would have the consequence that the measured aerody-namic characteristics seemingly vary along the flight maneu-ver.
For orientations with an upward component (−90◦< ψ < 90◦), we obtain positive values for1α. For orientations with a downward component, gravity opposes the aerodynamic drag of the wing, resulting in negative values for1α. The elevation angleβ of the kite is determined by the position of the kite with respect to the ground station (see Fig. 6) and only in the case of a straight tether identical to the in-clination of the tether force (see Fig. 10). One of the key ad-vantages of the described measurement method is that sag-ging of the tether does not directly affect the measurement ofL/D. We use the elevation angleβonly to correct for the effect of gravity in Eq. (10). This correction is also affected by the ratio of gravitational force to tether force. In contrast to this, sagging has a direct effect for methods that are based on ground-based measurements of the tether angle of attack, as proposed, for example, by Hummel (2017).
The tether angle of attackαtcan be calculated from Eq. (3)
using the measured inflow angleαm and the line angle λ0.
The latter is determined numerically by solving for the quasi-steady force equilibrium of the simplified mechanical model illustrated in Fig. 11.
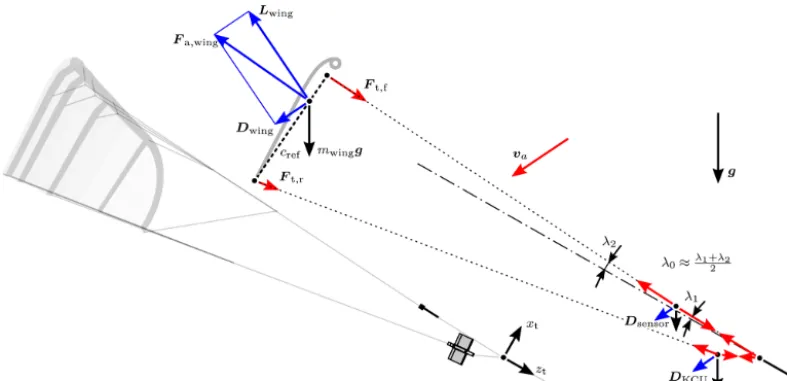
Figure 11.Fully powered kite (a) and simplified mechanical model of the kite system (b), including the wing, measurement setup and KCU, showing external forces (black: gravitational forces and tether force at the bridle point, blue: aerodynamic forces) and internal forces (red: bridle line forces) to calculate the bridle line anglesλ1andλ2. Depicted is the special case of an upwards-oriented kite with apparent flow velocity and all model forces in the drawing plane. Force vectors are not to scale.
total resultant aerodynamic force and the gravitational force acting on the kite components are thus decomposed as
Fa=Lwing+Dwing+DKCU+Dsensor, (13)
mg= mwing+mKCU+msensorg. (14)
In a first step, we calculate the resultant aerodynamic force Fa,wing=La,wing+Da,wing that is required to balance the
given tether forceFtand the aerodynamic and gravitational
forces acting on the kite components. Approximating the KCU and the measurement setup as blunt bodies with an aerodynamic drag coefficient of CD=1.0, we calculate a
drag contribution of the KCU of about 10 % of the wing drag and a contribution of the measurement setup of about 1 %.
In a second step, we use a shooting method to itera-tively adjust the bridle line angles until the two-dimensional model geometry for the known external forces and bridle line lengths is in quasi-steady equilibrium. For this we assume that a bridle line force is always in line with the connection line of the two attachment points. We further assume that the center of pressure and the center of mass of the wing are both at 25 % of the reference chord (see Fig. 11). This is in line with the mass distribution used by Bosch et al. (2013) and the average ratio of 3:1 for the forces in front and rear bri-dle lines measured by Hummel (2017) for different kites at various power settings. Starting from an initial guess for the line angleλ1, we calculate the angleλ2and the respective
an-gles for the steering lines. Based on the resulting geometry, we then compute the distance between the front and rear bri-dle attachments on the chord line of the wing. If this distance is larger thancref, the value ofλ1is reduced and the
calcula-tion repeated. The iteracalcula-tion loop is terminated when the target distancecrefof the bridle attachment points is reached. The
algorithm generally converges within four iterations using a termination criterion of 0.01 m or 0.5 %.
Compared to ground-based methods, for example, with angular sensors at the ground attachment point of the tether, the sagging of the tether does not affect the measurement significantly. Also, the effect of gravity on the measurement setup was found to be negligible. This is because the mea-surement setup is a lightweight construction compared to the KCU and because the power lines are generally well ten-sioned. We have observed that the line anglesλ1andλ2in
general differ only by 0.1◦to 0.2◦such that the power lines can practically be considered straight. We thus use the mean value ofλ1andλ2as line angleλ0. The KCU, on the other
hand, has a considerable effect, especially during reel-in ma-neuvers when the force in the rear suspension lines is of the order of the gravitational force of the KCU.
The calculated values vary over 0◦< λ0<2◦ for flying
downward. For upward flight and during reel-in we find val-ues of 3◦< λ
0<7◦. For low tether tension and upward flight
values of 10◦< λ0<12◦ occur. These computed ranges
agree well with photographic evidence, such as the snapshots shown in Fig. 8. The highest values occur when both tether tension and elevation angle are low, which is the case during launch and landing.
lines increases the powering of the kite and can be modeled as a reduction of the depower angleαd.
3.4 Determining the lift coefficient
The lift coefficientCLis a dimensionless number,
L=1
2ρCLv
2
aA, (15)
characterizing the lift force as a function of the air density ρ, relative flow velocityvaand projected wing surface area
A. Density and relative flow velocity are measured directly, while a constant value for the projected wing surface area is used (see the table included in Fig. 5). Using the lift-to-drag ratioL/Dwe can compute the lift force generated by the kite as
L=Fa
v u u t
L D
2
1+ L D
2. (16)
We resolve Eq. (8) in the horizontal and vertical directions to relate the force magnitudes as
Fa=
q
(Ftcosβ)2+(Ftsinβ+mg)2, (17)
again making use of the idealization that the tether force is aligned with the radial direction from the ground attachment point. The special case of an upwards-oriented kite with all forces in the drawing plane is illustrated in Fig. 10.
4 Results
The data for this study were acquired during a 1 h test flight of the prototype described in Sects. 2 and 3.2 on 24 March 2017 at the former naval air base Valkenburg, close to Lei-den, the Netherlands. A video camera mounted on the mea-surement setup documented that all sensors were moving freely in the airflow and did not exhibit any visible faulty be-havior. This is illustrated in Fig. 12, with the diagram show-ing 27 s at the beginnshow-ing of a representative traction phase.1
The first 180 s of the 1 h test flight are available as video footage from Oehler and Schmehl (2018). The maximum ap-parent flow velocity occurs during the first 2 s of the depicted time window, when the kite transitions from the retraction to the traction phase. Because the kite flies downwards during this maneuver, it is additionally accelerated by the effect of gravity, which leads to a temporary increase in the apparent flow velocity.
Our measurements contradict the earlier study of Ruppert (2012), who reported considerable variations in the angle of attack (up to 30◦during the traction phase) and sideslip angle
1In this study, time is counted from the launch of the kite,
start-ing att=0.
(−20◦< βs<20◦). In our study, the angle of attack is
lim-ited to a narrow range of 6◦< α <16◦ during the traction phase. The measured sideslip angle deviates from its mean value by a maximum of1βs=10◦ only during very sharp
turns, which is indicative for the high aerodynamic side force produced by a moderate sideslip angle. We conclude that an accurate determination of the relative flow at the kite is not feasible without in situ measurements at the kite. Using only GPS and IMU data and ground-based measurements, as proposed by Ruppert (2012), leads to a substantial degrada-tion of the achievable accuracy. The apparent flow speed is aroundva=18 m s−1during the traction phase andva<15
m s−1 during the retraction phase. In the analyzed data set, the mean value of the sideslip angle was not zero, which we would have expected for a symmetric kite. This offset re-sulted from an asymmetric layout of the bridle lines, causing the kite to fly in an asymmetric pattern during the traction phase. We recommend investigating the effect of the sideslip angle on the kite aerodynamics in a future study using alter-native data for a verified symmetric layout of the bridle line system.
A common technique to analyze measurement data from wind turbines or other rotating machinery is phase averag-ing. In contrast to Behrel et al. (2018) we did not use this technique because of the difficulty to determine a clear phase location of the data. Harvesting wind energy with tethered flying devices operated in pumping cycles has many more degrees of freedom than conventional wind turbines and even though the operation in a variable wind environment requires these to be actively controlled, the location of the lightweight devices along the flight path is tightly coupled to the evolu-tion of the wind field along this path. For a wind turbine with rotor blades that are mechanically linked and have a compar-atively large rotational inertia, the determination of a phase location is comparatively straightforward. Instead of using rigorous phase averaging, we only differentiate between trac-tion and retractrac-tion phases, subdividing the crosswind maneu-vers further into flying upwards (against gravity) and flying downwards (with gravity). This can be regarded as a low-resolution phase averaging tailored to the specific physics of tethered flight in pumping cycles. However, the available data covered only five separate cycles, which is by far not suffi-cient for a meaningful statistical analysis.
4.1 Reeling oscillations
The flight data illustrated in Fig. 12 exhibit strong fluctua-tions at a distinct frequency of 1.2 Hz in both va andαm.
These oscillations occur repeatedly for several seconds dur-ing the retraction and traction phases. Other independently measured variables also exhibit this behavior, for example the tether forceFt, the tether reeling speedvt, the pitch rate of
Figure 12.Video still of the relative measurement setup taken from the right power line (a), raw values of apparent flow velocityva, and inflow anglesαmandβsrecorded over time at the beginning of a representative traction phase (b).
a previous study (Oehler and Schmehl, 2017): a first mode of radial oscillations of the kite that are commanded by the reeling control of the ground station and a second flight dy-namic mode. These tangential oscillations in the forward– backward direction are kinematically coupled to pitch oscil-lations. Based on a simple model of a driven oscillator, we determined for the flight dynamic mode a relatively strong damping, with a coefficient ζk of 0.63, and
eigenfrequen-ciesfkof 0.81 Hz for the traction phase and 0.39 Hz for the
retraction phase. Because these values differ from the fre-quency of the observed fluctuations we conclude that we are not observing a flight dynamic mode of the kite system but that the reeling controller of the ground station is the root cause of the oscillations. This is supported by the additional observation that the fluctuations cease when the reeling of the tether stops. It is clear that this behavior could be suppressed by an adjustment of the ground station controller; however, this is not part of the study.
To estimate the effect of these forced oscillations with fre-quencyfGS=1.2 Hz on the kite aerodynamics we determine
the reduced frequency (Hassig, 1971):
k=f π c
va
. (18)
Using a chord length of c=2.7 m and an apparent flow speed of va=20 m s−1, we calculate a value ofkGS=0.5.
This means that the flow around the kite is unsteady, which in turn can cause a phase shift of the aerodynamic load with respect to the angle of attack. To mitigate the effect of a pos-sible phase shift, we smoothen the data over an interval of T =2.5 s, which is equivalent to three oscillation periods. In doing this we essentially regard the forced oscillations and resulting unsteady aerodynamics of the kite as a subscale process, which we filter out to retain the assumption of quasi-steady flight.
To assess the effect of the turning maneuvers during cross-wind flight on the aerodynamics of the kite we determine a characteristic frequency of fturn=0.1 Hz, which
corsponds to a half turn in about 5 s. The corresponding re-duced frequency of kturn=0.042 indicates that the
aerody-namic timescale is more than an order of magnitude smaller than the turning timescale, which also confirms the assump-tion of quasi-steady flight from this perspective.
4.2 Lift-to-drag ratio
The lift-to-drag ratioL/D is a key parameter to character-ize the aerodynamic performance of a wing. As described by Eq. (1), this parameter determines how fast a kite can the-oretically fly in a given wind environment and by that also what tether force can be achieved for a given size of the wing (Loyd, 1980; Schmehl et al., 2013). In contrast to a conven-tional aircraft, the C-shaped flexible membrane wing is used as a single aerodynamic control surface with the double func-tion of steering and generating a tether force that can be mod-ulated over a wide range. This is of particular importance for the considered operation in pumping cycles because the achievable net energy per cycle crucially depends on the abil-ity of the wing to alternate between a high lift-to-drag ratio during the traction phase and a low ratio during the retraction phase.
In Fig. 13 we investigate the influence of the angle of at-tackαof the wing and the power settingupof the kite.
The lift-to-drag ratio of the entire kite (all components from bridle point outwards) is derived on the basis of Eq. (11) using Eq. (3) to account for the measured flow angleαmand
the estimated line angleλ0 and Eq. (10) to account for the
effect of gravity, expressed as compensation angle1α. No further filtering or smoothing is applied to the data. Al-though the effect of gravity on all kite components is taken into account as is the aerodynamic drag on the KCU and measurement setup, the data are still scattered considerably. In the following we will show that this is to a considerable degree due to occasional dips in the tether tension, steering actuation and the associated sideslip angle.
Figure 13.Measured lift-to-drag ratioL/Dof the kite plotted over the angle of attackαof the wing (a) and relative power settingupof the kite (b). No filtering or smoothing is applied to the data.
Figure 14.Measured lift-to-drag ratioL/Dof the kite plotted over the angle of attackαand colored by the relative power settingup. The coloring ranges from blue, for lower values ofupwhen retract-ing the kite, up to dark red, for the fully powered kite withup=1 during the traction phase. Table 2 filters no. 1 and no. 2 have been applied.
the traction phases are indicated by power settings up≈1.
Values between these regions are typical for the transition between the retraction and traction phases. During the trac-tion phases we measure an average lift-to-drag ratio of about L/D=4, and during the retraction phases we measure an average ratio of aboutL/D=3, which is desired to reduce the tether force and thus also the energy consumption during retraction of the kite.
In the next step we filter the data as outlined in Table 2, reducing the spreading and removing outliers.
The correlated effect of the angle of attack and the relative power setting on the lift-to-drag ratio is illustrated in Fig. 14, for which we have also applied the moving-average smooth-ing described in Sect. 4.1 (filter no. 1).
To identify the cause of the high L/D values, we fur-ther exclude data points with a tefur-ther forceFt<400 N
(fil-ter no. 2). For such low tether tensions the assumptions of a straight tether and quasi-steady flight state are no longer valid, which can lead to substantial measurement errors. Ex-cluding data points withFt<400 N in fact eliminates many
of the unphysically highL/Dvalues.
Figure 15.Evolution of the lift-to-drag ratio during pumping cycle operation.
The diagrams in Figs. 13 and 14 show that for an increas-ing power settincreas-ingupthe angle of attackαand the lift-to-drag
ratioL/D increase. A low angle of attack results in a low lift force and therefore a low force ratio. The maximum of aboutL/D=5 occurs in the range 5◦< α <10◦and is only reached forup=1. For a higher angle of attack the force
ratio decreases again because of the substantially increasing drag force. The measured dependency follows the same gen-eral trend as for conventional aircraft wings and was already observed by van der Vlugt et al. (2013).
Figure 15 shows the temporal evolution ofup andL/D
during pumping cycle operation.
During the traction phases withup=1 we observe
peri-odic drops to force ratiosL/D <4. The drops are correlated with the turning maneuvers and are caused by the steering-induced deformation of the wing and the additional drag component of the required side force (Fechner et al., 2015).
To investigate the effect of the steering on the entire data set in Fig. 16, we color the measuredL/Ddata by the steer-ing intensity.
Table 2.Three filtering procedures applied to the measured lift-to-drag ratio.
Filter Description Reason Visible effect
1 moving average forced oscillations withfGS; reduces spread overT=2.5 s remove subscale dynamics during retraction 2 Ft>400 N model limitation eliminate outliers 3 exclude steering strong deformation eliminate outliers
Figure 16.Measured lift-to-drag ratioL/Dof the kite plotted over the angle of attackαof the wing and colored by the relative power settingup, colored by the steering intensity ranging from blue for no steering up to yellow and red for strong steering actuation during turning maneuvers. Table 2 filters no. 1 and no. 2 have been applied.
et al. (2018a). Next to the described effects of deformation and steering-induced drag, there is also a feedback loop be-cause an increasing drag lowersL/D, which in turn increases αt and to a certain extent alsoα. The increasing αlowers
L/Dfurther.
4.3 Comparison with aerodynamic models
Ruppert (2012) and Fechner et al. (2015) present two differ-ent real-time-capable models for the dynamic simulation of pumping kite power systems. In both approaches the aero-dynamics of the kite are described byCL(α) andCD(α)
cor-relations that have been derived from existing measurement data on two-dimensional sail wing sections. According to the authors, major adjustments were required to fit the simulated flight behavior of the kite to measured reference trajectories. Both dynamic models predict the flight path and power pro-duction with reasonable accuracy for a broad range of oper-ational conditions and are thus suitable for optimization of kite control.
Two different definitions of the angle of attack are used. Fechner et al. (2015) measure the angle from the center chord to the relative flow velocity vector, while Ruppert (2012) measures it from the orientation of the wing-mounted IMU. Both definitions are difficult to reproduce experimentally for subsequent measurement campaigns because the orientation of the center chord is a virtual geometric property and can only be estimated, while the IMU is mounted on one of the inflatable struts with Velcro®tape, which introduces a con-siderable degree of uncertainty, even when using the same kite.
To compare the two existing sets of aerodynamic correla-tions with our measurement data we first need to eliminate the offsets introduced by the different definitions ofα. For this purpose we shift theL/Dcorrelations of Ruppert (2012) and Fechner et al. (2015) in theαrange such that the max-ima occur atα=7.5◦, which is where the maximum average L/Dof our data set is located. For reference we note that the maxima of the unshifted correlations occurred atα=12.5◦ (Ruppert, 2012) andα=16◦(Fechner et al., 2015).
As stated above the lift-to-drag ratio decreases during turn-ing maneuvers because of the additional drag of the wturn-ing tips. This can be clearly recognized from the data plotted in Fig. 15, which exhibit strong variations when flying cross-wind maneuvers during the traction phases. On the other hand, the existing aerodynamic correlations have been de-rived for a wing in straight flight, with symmetric steering input. Ruppert (2012), for example, has excluded from his analysis data points that were associated with strong asym-metric steering input. We have applied a similar filtering pro-cedure to our data. In Fig. 17 we compare the filtered data with the existing aerodynamic correlations.
Figure 17.Comparison of measured lift-to-drag ratio with existing aerodynamic correlations. Table 2 filters no. 1, no. 2 and no. 3 have been applied.
(LEI V3) and a small (LEI Hydra V5) kite using lift-to-drag ratios of 3.6 and 4.0, respectively, during the traction phases as opposed to 3.5 and 3.1, respectively, during the retraction phases.
Overall, we find a reasonable agreement between our measured data and existing aerodynamic characterization at-tempts. The correlations of Ruppert (2012) and Fechner et al. (2015) slightly overestimate the lift-to-drag ratio, with force ratios L/D >4 even for angles α >15◦. This is consis-tent with the common assumption of a high angle of at-tack during the traction phase (van der Vlugt et al., 2013). Our measurements, however, show that the angle of attack is lower and generally does not exceedα=15◦. The lift-to-drag data proposed by van der Vlugt et al. (2019) for traction and retraction phases correspond very well with the average lift-to-drag ratios measured in these phases. The depowered kite (up<0.5) and the powered kite (up=1) show
differ-ent trends. The data plotted in Fig. 14 indicate that the lift-to-drag ratio of the depowered wing depends mainly on the power setting up, while the effect of the angle of attack is
only minor. In contrast to this, the force ratio of the pow-ered kite depends mainly on the angle of attack with L/D decreasing for increasingα.
With Eq. (4) we have formally separated three fundamen-tal contributions to the angle of attackαof the wing. While the tether angle of attack αt and the line angle λ0
repre-sent the contributions due to flight motion and pitching of the entire kite with respect to the tether, the depower an-gle αd, which is linked to the relative power setting up by
Eqs. (5) and (6), also causes a complex deformation of the bridled membrane wing (see Sect. 3.2). The spanwise twist-ing and bendtwist-ing has a strong secondary effect on the aerody-namics of the wing, and accounting only for the dependency onαleads to considerable uncertainty in the measured aero-dynamic characteristics. This effect is one of the contributing factors to the broad spreading of the data in Fig. 17. For this reason, we recommend keeping the relative power setting as a separate influencing parameter, next to the angle of attack, to improve the aerodynamic characterization of a pumping
Figure 18.Measured lift coefficientCLof the kite as a function of the relative flow velocityva and colored by the heading. The heading range from down to up covers both heading angle ranges 180◦> ψ >0◦and 180◦< ψ <360◦equally (see Fig. 6).
cycle AWES over the whole flight envelope. In fact, the tran-sition from a powered to depowered state of the wing should be regarded as a sequence of different wings.
4.4 Lift coefficient
The tests considered in this study are based on a constant force control strategy for the traction phases, with a set value Ft,o=3.25 kN. Whenever the actual tether forceFtdrops
be-low this value, the ground station reduces the reeling speed vt; when the force exceeds this value, it increases the
reel-ing speed. This control strategy ensures that the aerodynamic loading of the system is limited despite operating in a fluctu-ating and varying wind environment.
In Fig. 18 we plot the measured lift coefficientCLof the
kite as a function of the relative flow velocityva, colored by
the heading.
The diagram only includes data from the traction phases and whenFt>3 kN. Flight situations that do not meet this
condition are, for example, the transitions to and from the retraction phase or sharp turning maneuvers. Because of Eq. (15) and the constant force control the data points are correlated by
CLva2=const. (19)
Figure 18 clearly shows how the flight motion of the kite adjusts continuously to the force balance that varies along the crosswind maneuvers to maintain the commanded tether forceFt,o. As a result of gravity, the kite flies faster, with
lowerα andCL on trajectory segments with a downwards
component, while it flies slower with higherα andCL on
segments with an upwards component. Because of the con-stant force control, the relative flow velocityva exhibits an
inversely proportional behavior to the angle of attackαand the lift coefficientCL. The inversely proportional correlation
ofαandvacan also be recognized in Fig. 12.
Figure 19.Measured lift coefficientCLof the kite as a function of the angle of attack,α, colored by the heading.
does not vary along its flight path through a constant uniform wind field. The described effect of gravity and the natural wind environment induce a variation in the angle of attack, although the power setting is kept constant atup=1 when
flying crosswind maneuvers. Because of the constant power setting, the wing does not deform and the variations in CL
andL/D can be attributed solely to changes in the angle of attack.
Figure 19 shows the measured lift coefficientCLas a
func-tion of the angle of attack, colored by the heading of the kite. To better differentiate the effect of the heading, we sub-divide the range from pointing downwards to pointing up-wards into 10 classes. The heading classes are equidistant in cosψ, i.e.,1cosψ=0.2, as indicated by the circular legend in Fig. 19. Per class we compute the average data point and display this as a symbol according to the color legend.
The dark blue data point with the lowest angle of attack thus represents the average of all measured flight conditions with a heading that is most closely aligned with the gravity vector.
Despite the filtering, Figs. 17 and 19 still show a consid-erable dispersion of the measured data. The various idealiza-tions required to model the flexible membrane kite system and the assumption of quasi-steady flight with negligible in-ertial effects contribute to that as does the fact that the evalu-ated pumping cycles differed in flight path, wind conditions and many other parameters. Yet, we can recognize two clear trends in the averaged data:
– the lift coefficient increases with the angle of attack, and
– the angle of attack and lift coefficient are higher when flying upwards.
The first trend reflects the common aerodynamic charac-teristics of a wing, while the second trend is caused by the constant force control strategy and was already observed by Oehler (2017). The average lift coefficient plotted in Fig. 19 exhibits a steep slope for lower angles of attack.
Atα=9◦we measure an average valueCL=0.7, while at
α=12.5◦this value has risen toCL=1.0, which is close to
the ideal case of a two-dimensional lifting surface. For wings
with a low aspect ratio, such as the considered soft kite, we generally expect a more gentle slope of the lift coefficient. The increasing camber and flattening of the wing for higher angles of attack are two mechanisms that can contribute to this steep slope (see Sect. 3.2 and Fig. 9). Since we use a constant reference wing surface area in Eq. (15) these mech-anisms increase the lift coefficient.
Because the power setting of the kite is kept constant dur-ing the traction phase we cannot actively control the angle of attack of the wing. Instead, the angle results from the quasi-steady force equilibrium of the kite and is thus affected by the varying gravitational force contribution and the wind en-vironment. Our analysis shows that for operation with con-stant force control the heading of the kite has the strongest influence on the angle of attack during crosswind maneu-vers. When the kite is flying upwards, drag and gravitational force point in similar directions, while for downwards flight, both forces point in opposite directions. This causes the dif-ferences in relative flow velocity in Fig. 18 and in angle of attack in Fig. 19.
5 Conclusions
In this study we present a method to determine the lift-to-drag ratio and lift coefficient of a soft kite during flight op-eration by in situ measurement of the relative flow. Tailored towards a kite system with a suspended control unit, the flow sensor is installed in the power lines and independently mea-sures the magnitude of the relative flow velocity, the sideslip angle and an orthogonal inflow angle from which the angle of attack of the wing is derived. The effect of gravity on the in-dividual kite components is taken into account in processing the data as is the aerodynamic drag of the kite control unit and measurement setup. Further included are a smoothing procedure to remove the effect of low-frequency oscillations induced by the ground station and filtering procedures to re-move the effects of too-low tether tension and high steering intensity.
We distinguish three fundamental contributions to the an-gle of attack of the wing: the tether anan-gle of attackαt, which
is related to the flight motion of the kite, the line angleλ0,
which characterizes the pitch of the entire kite relative to the tether, and the depower angleαd, which characterizes the
pitch of the wing relative to the kite due to depower actuation. Whileλ0is influenced by the interaction of the tether force
and the gravitational and aerodynamic forces acting on the individual kite components,αdis inversely related to the
rel-ative power settingupand correlated with a spanwise
twist-ing and bendtwist-ing of the bridled membrane wtwist-ing.
varia-tion of the angle of attack during the tracvaria-tion phases is limited to about 8◦. Because of the constant force control operation of the ground station, the angle of attack is inversely related to the relative flow velocity. During the traction phase, the angle of attack and the lift coefficient are both increased, yet strongly influenced by the effect of gravity, which varies with the heading of the kite. When flying upwards, the flight speed of the kite decreases and the angle of attack increases to com-pensate for the effect of gravity; when flying downwards, the speed increases and the angle decreases.
We find that the aerodynamic characteristics of the bridled membrane wing depend not only on the angle of attack, as is common for rigid wings, but also on the level of aerodynamic loading. For the investigated C-shaped wing, we observe, for example, that increasing the loading causes the wing to flat-ten, which enlarges the projected area and amplifies the ef-fective aerodynamic force. Because the loading is actively controlled by the relative power setting, we can use this pa-rameter to correlate the effect of the loading on the aerody-namic characteristics. How exactly the power setting affects the wing shape depends strongly on the layout of the bridle line system.
Our measurements show that accounting only for the de-pendency on the angle of attack variation, as is commonly done, leads to considerable uncertainty in the aerodynamic characteristics.
We expect that using the relative power setting as a sec-ondary influencing parameter will improve the aerodynamic characterization of a pumping cycle AWES over the whole flight envelope.
Using a Kalman filter, as shown by Schmidt et al. (2017), could help to increase the accuracy of the measured data and the actual state of the system by including knowledge about system behavior and the data from other onboard sensors, such as the inertial measurement unit. Another possible im-provement of the analysis would be to retrofit the power and steering lines with force sensors to assess the aerodynamic load distribution on the wing.
The effect of the kite control unit is considerable as it con-tributes about 40 % of the total kite mass and 10 % of the drag. Because of the suspension in the steering lines it can exhibit unpredictable movements, particularly during turns and when the tether force is low during the retraction phase. This adds uncertainty to the calculated orientation of the kite. Moving the control unit towards the bridle point and connect-ing it to power and steerconnect-ing lines could potentially avoid this problem.
Appendix A: Flow velocity induced by the wing at the measurement location
To estimate the aerodynamic effect on the relative flow at the measurement location below the wing we introduce a lifting-line approximation of the C-shaped wing, as depicted in Fig. A1.
The center section is represented as a straight vortex seg-ment of finite length with circulation01, while the tip
sec-tions are represented by straight segments with circulation 02. The contribution of a vortex segmentito the induced
ve-locityvindat the measurement location is calculated by the
Biot–Savart law:
vind,i= 0i 4π ri
cosδi,1+cosδi,2, (A1)
whereri is the perpendicular distance between the measure-ment location and the vortex segmeasure-ment, and δi,1 andδi,2 are
the angles between the segment and the (dotted) lines con-necting its ends with the measurement location. Following the superposition law of potential flow, the velocity induced by the three vortex segments at the measurement location is calculated as
vind=vind,1+2vind,2. (A2)
Because of the symmetric layout of the wing with respect to the measurement location, we first calculate the velocity induced by one wing half and then double this effect. Using the geometric parameters defined in Fig. A1 we can deter-mine the line anglesδ and from these calculate the velocity induced by the center section,
vind,1=2
01
4π hcos
arctan 2h
b1
, (A3)
and by each tip section:
vind,2= √
202
4πh+b1
2
cos 3
4π−arctan 2h
b1
−cos 3
4π−arctan
2(h−h
1)
b
. (A4)
The apparent flow velocityvaat the measurement location
is the sum of the free-stream velocity v∞ and the induced velocityvind. Using the values listed in Table A1 we calculate
an induced velocity ofvind<0.2 m s−1.
Table A1.Model parameters of the LEI V3 kite for lifting-line the-ory.
b b1 h h1 02/01 L v∞ 8 m 4 m 8.5 m 2 m 5/8 3250 N 18 m s−1
Figure A1.Front view of the lifting-line model of the kite, flying towards the reader.
Considering the induced downwash due to the wing tip vortices, the induced angle of attack at the measurement lo-cation isαind<0.6◦. Accordingly, the effect of the induced